Early light curves for Type Ia supernova explosion models
Abstract
Upcoming high-cadence transient survey programmes will produce a wealth of observational data for Type Ia supernovae. These data sets will contain numerous events detected very early in their evolution, shortly after explosion. Here, we present synthetic light curves, calculated with the radiation hydrodynamical approach Stella for a number of different explosion models, specifically focusing on these first few days after explosion. We show that overall the early light curve evolution is similar for most of the investigated models. Characteristic imprints are induced by radioactive material located close to the surface. However, these are very similar to the signatures expected from ejecta–CSM or ejecta–companion interaction. Apart from the pure deflagration explosion models, none of our synthetic light curves exhibit the commonly assumed power-law rise. We demonstrate that this can lead to substantial errors in the determination of the time of explosion. In summary, we illustrate with our calculations that even with very early data an identification of specific explosion scenarios is challenging, if only photometric observations are available.
keywords:
hydrodynamics – radiative transfer – supernovae: general1 Introduction
Type Ia supernovae (SNe Ia) are believed to originate from thermonuclear explosions in carbon–oxygen (CO) white dwarfs (WDs; Hoyle & Fowler, 1960). However, details of the progenitor stars and explosion mechanisms are still uncertain and various models are discussed. One uncertainty concerns the mass of the exploding object, in particular whether the explosion occurs in a WD close to the Chandrasekhar mass limit or well below. Furthermore, the details of the thermonuclear burning, i.e. whether the flame proceeds as a deflagration, a detonation or a mixture of both, are still unresolved (Hillebrandt & Niemeyer, 2000). It is also still heavily debated whether the WD accretes material from a companion star or if the supernova occurs in the merger with a second WD (e.g. Ruiter et al., 2009). Finally, more exotic models, such as head-on collisions (e.g. Rosswog et al., 2009) or the core-degenerate mechanism (Soker et al., 2014), are discussed as well. For a comprehensive overview on the open questions, see the recent reviews by Hillebrandt et al. (2013) or Maoz et al. (2014).
Robotic transient searches, such as the Panoramic Survey Telescope And Rapid Response System (Pan-STARRS) or the Palomar Transient Factory (PTF), conducted during the last decade have presented the scientific community with a wealth of supernova observations. Since the cadence of these surveys continuously shortened, supernovae were caught at ever earlier times, shortly after explosion (e.g. SN 2011fe, Nugent et al., 2011). This situation will again dramatically improve with upgrades of current surveys, for example, of the All-sky Automated Survey for SuperNovae (ASAS-SN), and with future transient searching campaigns, such as the Zwicky Transient Facility or the Large Synoptic Survey Telescope, which will drastically increase the number of SNe Ia detected in their early evolutionary phases.
Entirely new avenues to study supernova physics and learn more about the progenitor system, the circumstellar environment in the immediate vicinity of the explosion site and even the actual explosion mechanism are opened by such data sets. These prospects have sparked increased interest in examining the expected very early observational signatures from a theoretical perspective (e.g. Dessart et al., 2014a). In particular, the signatures from cooling of shock heated ejecta (Piro et al., 2010; Rabinak et al., 2012) or the characteristic imprints in the early light curve induced by the interaction of ejecta with a companion (Kasen, 2010) or with circumstellar material (CSM, e.g. Piro & Morozova, 2016) have been studied. Likewise, the distribution of radioactive material in the outer ejecta regions is expected to leave traces in the early observables as well (e.g. Diehl et al., 2014; Piro & Nakar, 2014; Piro & Morozova, 2016).
Some of the diagnostic possibilities that very early observations offer have already been showcased by a number of individual, nearby objects. For example, thanks to the availability of observations shortly after explosion, Nugent et al. (2011) and Bloom et al. (2012) were able to constrain the progenitor radius of SN 2011fe to unprecedented precision. Similar studies have been attempted for other SNe Ia, among them SN 2013dy (Zheng et al., 2013), SN 2014J (Zheng et al., 2014; Goobar et al., 2015), ASASSN-14lp (Shappee et al., 2016b) and SN 2015F (Im et al., 2015), for which very early and densely sampled observational data have been collected. Although no companion interaction has been detected in past surveys (Hayden et al., 2010b; Bianco et al., 2011), the observation of such signatures has recently been claimed for a few individual objects, in particular for the normal SN 2012cg (Marion et al., 2016) and the sub-luminous iPTF14atg (Cao et al., 2015). These observations are typically interpreted as evidence for the single degenerate scenario for SNe Ia (but see e.g. Livio & Riess 2003, Raskin & Kasen 2013, Liu & Stancliffe 2016, Kromer et al. 2016 and Shappee et al. 2016a).
With this work, we aim at exploring the very early observables for a set of detailed explosion models of SNe Ia. We calculate synthetic light curves in various photometric bands for these models with the well-established radiation hydrodynamics method Stella (Blinnikov & Bartunov, 1993; Blinnikov et al., 1998, 2000) for the first ten days after explosion. We study the overall shape and the rise behaviour of these early light curves and search for characteristic signatures that may help to robustly discriminate different explosion mechanisms based on early photometric data. Our work is organized as follows. We briefly review the key aspects of the numerical approach, we rely on in Section 2 and present the various explosion models we investigate in Section 3. The early light curves calculated with Stella for these models are presented in Section 4 and discussed in detail in Section 5. We conclude with a summary and an outlook about future work in Section 6.
2 Method
During the early phases of supernova evolution, the ejecta are still very dense and thus optically thick. Radiation has to diffuse from nickel-rich zones where it is generated to the very outer ejecta regions which are transparent. The high optical thickness of the ejecta during the early phases argues against the use of Monte Carlo-based radiative transfer approaches such as Artis (Kromer & Sim, 2009) or Sedona (Kasen et al., 2006) as they become very inefficient in this regime. Instead, we rely on the radiation hydrodynamics approach Stella to predict early observables for SNe Ia in this work. This code has been developed by Blinnikov & Bartunov (1993), Blinnikov et al. (1998) and Blinnikov et al. (2000) and has been successfully used to study a variety of aspects of supernova research. Prominent examples include studying SN 1987A (Blinnikov et al., 2000), supernova shock breakouts (e.g. Blinnikov & Tolstov, 2011), calculating light curves for SNe Ia (Blinnikov et al., 2006; Woosley et al., 2007), exploring super-luminous supernovae (Baklanov et al., 2015; Sorokina et al., 2016), investigating pair-instability supernovae (Kozyreva et al., 2017) or studying ejecta–CSM interaction in the context of super-Chandrasekhar SNe Ia (Noebauer et al., 2016).
We briefly review some of the essential characteristics of Stella, which are of relevance for the current study. More details and in-depth descriptions of the involved techniques may be found in Blinnikov et al. (1998, 2006). Stella is a one-dimensional radiation hydrodynamics code, which employs a fully implicit solution procedure and tackles the radiation transfer aspect of the problem with a multi-group variable Eddington factor scheme. Hereby, the effects of atomic line interactions, electron scattering, inverse bremsstrahlung and photoionization are taken into account. In particular, the contribution of roughly 160,000 lines, taken from the Kurucz & Bell (1995) data base, is included in the opacity calculation by employing the expansion opacity formalism of Friend & Abbott (1986). Local thermodynamic equilibrium (LTE) is assumed when determining the ionization and excitation balance. However, no such assumptions are imposed on the radiation field itself, whose non-equilibrium evolution is followed. In conjunction with the detailed multi-group treatment, a simple single-group diffusion scheme is also included to track the transport and deposition of -radiation energy released in the radioactive decays (cf. Blinnikov et al., 2006). For most calculations presented here, only the energy generation in the most important decay chain in SNe Ia is taken into account, namely the decay of to and . However, for studying the double-detonation scenario (cf. Section 3.1.4), the additional decay channels and have been implemented into Stella. Half-lives and the amounts of energy that are released in form of -radiation and particles have been adopted from Dessart et al. (2014b). The latter contribution is treated as an instantaneous heating term in Stella. In all calculations a grey specific absorption cross-section of for -radiation is used in the single group diffusion scheme.
3 Models
In this work, we aim at predicting and investigating early-time observables of SNe Ia, in particular light curves, for a set of explosion models. Hereby, we primarily focus on models that produce about of radioactive material and are thus broadly compatible with the brightness of normal SNe Ia, like SN 2011fe for example (Pereira et al., 2013). Based on these criteria, we selected two Chandrasekhar-mass () explosion models and three sub-Chandrasekhar models as the basis for this work. In the investigation of specific early light curve features (see Section 5.4), we also focus on the consequences of mixing in the ejecta. For this purpose, a small suite of toy models was constructed and two pure deflagration explosion models were considered. The latter two serve as an example of completely mixed ejecta. With the exception of the W7 model (Nomoto et al., 1984), all original explosion calculations have been performed by the SN Ia group formerly based at the Max Planck Institute for Astrophysics (MPA). These models are part of the recent public release of the Hesma111https://hesma.h-its.org/ data base (Kromer et al., 2017). In the following, all models are briefly introduced individually.
3.1 Explosion models for normal SNe Ia
3.1.1 Carbon deflagration: W7
Despite its parametrized description of the thermonuclear burning process in 1D, the ejecta structure of the so-called W7 model of Nomoto et al. (1984) has been quite successful in reproducing observations of normal SNe Ia (Branch et al., 1985; Jeffery et al., 1992; Höflich, 1995; Nugent et al., 1997; Lentz et al., 2001; Salvo et al., 2001; Baron et al., 2006; Gall et al., 2012) and is still considered a standard theoretical reference model for the thermonuclear explosion of CO WDs. In this work, we use the revised version of this model published by Iwamoto et al. (1999), which includes an extended nucleosynthesis calculation. The model contains of located in a shell roughly between and . While the innermost regions are composed of stable iron, a region rich in intermediate mass elements (IME) lies on top of the nickel shell. Finally, the outermost zones of the W7 model have not burnt and are thus composed entirely of CO fuel.
3.1.2 Delayed detonation: N100
Delayed detonations (Blinnikov & Khokhlov, 1986, 1987; Khokhlov, 1991) have long been considered as the most promising mechanism to explain normal SNe Ia (e.g. Röpke et al., 2012) for CO WD progenitors. In this scenario, the thermonuclear flame first propagates as a subsonic deflagration which later transitions into a detonation. Seitenzahl et al. (2013) have explored this scenario with 3D hydrodynamical simulations, investigating a range of different possible realizations. Following Röpke et al. (2012), who compared the N100 model of this series to SN 2011fe, we use this model for this work as well. In this realization of the delayed detonation scenario, the initial deflagration is triggered in 100 ignition spots distributed randomly in the centre of a CO WD. After the deflagration and successive detonation have traversed the WD and burning has ceased, a total of of radioactive nickel have been synthesized in the explosion (cf. Table 1).
3.1.3 Violent merger
The violent merger scenario (e.g. Pakmor et al., 2010, 2012, 2013; Moll et al., 2014; Tanikawa et al., 2015) constitutes an alternative route to SNe Ia. In this scenario, the merger of two sub-Chandrasekhar mass CO WDs in a close binary, triggers a carbon detonation in the more massive of the WDs, which, in turn, disrupts the whole system. Pakmor et al. (2012) presented a binary configuration consisting of a and a CO WD, which produced of 56Ni and explains the optical spectra of normal SNe Ia reasonably well (Röpke et al. 2012; note, however, that the predicted polarization signal for violent mergers is significantly stronger than observed in normal SNe Ia Bulla et al. 2016). For this work, we adopt this model as an example of the merger scenario.
3.1.4 Sub-Chandrasekhar mass detonation models
Shigeyama et al. (1992) and Sim et al. (2010) showed that centrally ignited detonations in sub-Chandrasekhar mass CO WDs successfully reproduce important characteristics of normal SNe Ia thus highlighting the potential significance of sub-Chandrasekhar models as progenitors for SNe Ia. However, more realistic simulations (e.g. Kromer et al., 2010; Woosley & Kasen, 2011), where the carbon detonation in the core of the sub-Chandrasekhar mass WD is triggered by an initial detonation in a He surface layer that has been accreted from a binary companion (so-called double-detonation mechanism, e.g. Iben et al. 1987), are less promising. In these models, iron-group elements (IGE) rich ashes from the initial detonation in the He surface layer typically lead to observational fingerprints that are not observed in normal SNe Ia (but see Kromer et al. 2010; Shen & Moore 2014 for mechanisms to partially suppress the IGE pollution.)
Here, we pick two models to investigate the early-time observables of both double detonations and bare CO detonations in sub-Chandrasekhar mass WDs. For the double detonation scenario (SubChDoubleDet), we take model 3 of Fink et al. (2010) and Kromer et al. (2010), which yields of from an initial WD with a CO core and a He shell of . In the initial helium-shell detonation, of , of and of have been synthesized close to the ejecta surface. As a bare CO detonation (SubChDet), we use the model of a detonation of a WD that yields of (model 1.06 of Sim et al. 2010).
3.2 Models with increased mixing
3.2.1 N100 toy model suite
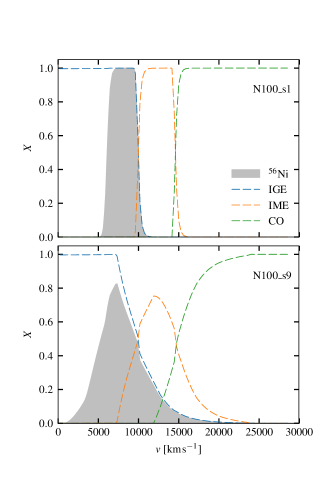
Mixing in the ejecta has some important consequences on the shape of the early SN Ia light curves, as will be shown later. To reveal the correlations between mixing and certain features in the early light curves systematically, a small suite of toy models is considered. This model series, which adopts a simplified ejecta composition, has been constructed by Klauser (B.A. Thesis, LMU) to study the effect of mixing of iron-group elements on synthetic light curves around maximum light and has also been used by Sasdelli et al. (2017). For the base model of the series, the density profile of the N100 model is adopted (see Section 3.1.2). Also, the total masses of , IGE222All elements heavier than calcium., IME and unburned fuel (CO) were taken from N100. These elemental groups are then rearranged to form a highly stratified ejecta structure. In particular, the innermost regions are filled up entirely by stable IGEs. Adjacent to this core region, a layer containing exclusively the entire radioactive material is located, which is followed by an IME zone and finally the outermost regions which only contain unburned fuel. For simplicity, it is assumed that the stable IGE layer is composed of only of iron and that the total IME mass is distributed in equal parts on silicon, sulphur, magnesium and calcium. To explore the consequences of strong layering on the light curve in more detail, variants of this model are constructed by applying various degrees of smoothing to the base ejecta composition. In particular, a Gaussian smoothing kernel is used, whose strength is controlled via the standard deviation of the Gaussian. In total, a suite of five toy models is generated by using
| (1) |
and in . The impact of this smoothing on the model composition is highlighted in Fig. 1, which compares the distribution of the main elemental groups in the models with and .
3.2.2 Pure deflagrations
Subsonic, turbulent burning introduces strong mixing. Thus, we also consider two pure deflagrations from the model suite studied by Fink et al. (2014). In that work, a range of possible realizations of pure deflagrations in CO WDs were explored in detailed three-dimensional calculations. With the N5def and N1600Cdef models, we adopt two examples from the ends of the range of deflagration strengths considered. The N5def model is of particular interest since it belongs to the family of so-called failed deflagrations where the burning is not energetic enough to unbind the entire WD and a bound remnant remains. It has been shown that such models are good candidates for the faint SN 2002cx-like objects (e.g. Kromer et al., 2013).
3.3 Mapping into Stella
With the exception of the W7 and the double-detonation model, the original explosion calculations have been performed until after explosion. At this time the ejecta are in almost perfect homologous, i.e. force free, expansion. In particular, Röpke (2005) showed that already at deviations from homology are very small. Thus, input models for SNe Ia radiative transfer calculations are typically constructed in perfect homologous expansion (e.g. Kasen et al., 2009; Hillier & Dessart, 2012). We follow this practice when mapping into Stella. In particular, we project the different explosion models on to a uniform spherical grid consisting of initially equidistant cells. In this process, small deviations in the mass distribution may occur, leading to total ejecta masses slightly different from the values reported in the original publications of the respective explosion models. We start all Stella calculations at after explosion. We bridge the very early phase from to , when the ejecta are very optically thick and virtually opaque to radiation, by homologously expanding the models. For simplicity, we assume an isothermal stratification in the ejecta with at the simulation start. This value is somewhat arbitrary but overall in rough agreement with the adiabatic cooling effect due to volume expansion, which is expected to have reduced the temperature of the initially hot ejecta material, heated by thermonuclear burning and shock heating. A total of frequency groups are used, which are logarithmically distributed between and , corresponding to the wavelength range roughly from to . We have explicitly checked that increasing the spectral and spatial resolution does not change the results significantly at the example of the W7 model.
All explosion models are summarized in Table 1 in terms of their fundamental properties, and their density profiles at after explosion are shown in Fig. 2.
| Model | ||||
|---|---|---|---|---|
| W7 | 1.380 | 0.587 | 1.103 | 20.0 |
| N100 | 1.406 | 0.604 | 1.424 | 100.0 |
| Merger | 1.935 | 0.613 | 1.607 | 100.0 |
| SubChDet | 1.062 | 0.559 | 0.978 | 100.0 |
| SubChDoubleDet | 1.095 | 0.549 | 1.230 | 7.8 |
| N5def | 0.353 | 0.152 | 0.131 | 100.0 |
| N1600Cdef | 1.400 | 0.320 | 0.562 | 100.0 |
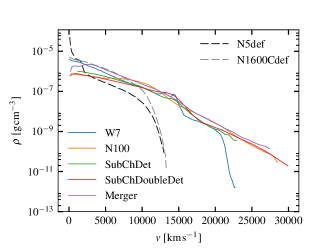
The toy model suite does not appear in these summaries since their fundamental properties and density profiles are identical to N100.
4 Results
After mapping the explosion models into Stella, their radiation hydrodynamical evolution is followed. As expected from previous studies (see Pinto & Eastman, 2000; Woosley et al., 2007; Noebauer et al., 2012), the dynamical impact of the radiation generated by the radioactive decay is small and the ejecta remain almost in perfect homologous expansion. During the first after explosion, deviations from homology remain smaller than 5 per cent in the ejecta velocity and 10-20 per cent in the density, barring numerical effects at the computational boundaries.
As the ejecta evolution is followed, Stella calculates in each time-step the SED of the emergent radiation field. Although this SED is too coarse for spectral synthesis purposes, it is well suited for determining colour curves. Throughout this work, light curves will be shown in terms of absolute AB-magnitudes, which have been obtained by convolving the synthetic SED with the respective filter transmission curves (cf. Bessell & Murphy, 2012)
| (2) |
Here, the synthetic flux at a distance of in units of enters.
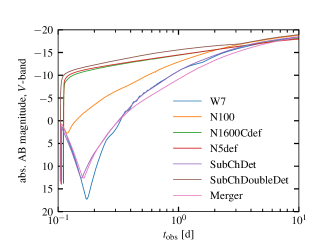
Fig. 3 shows the resulting light curves in the Bessell , , and bands (Bessell & Murphy, 2012) of all models for the first after explosion.
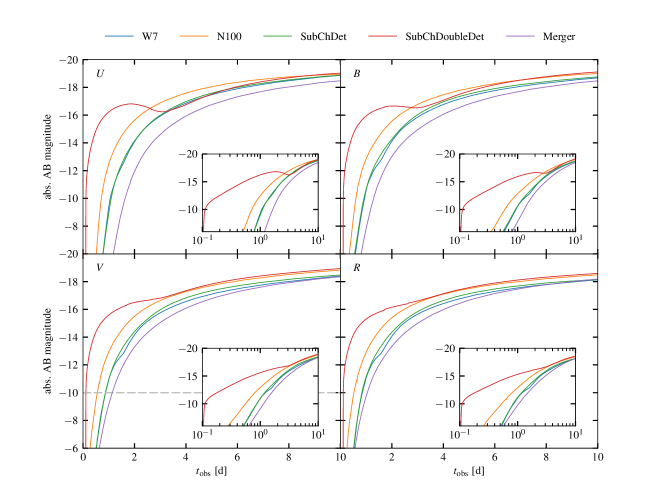
Overall, the light curve shape is largely similar, with the exception of the double-detonation model. Here, the radioactive material close to the surface, which has been synthesized in the helium-shell detonation (, , ) leads to prominent first peaks or shoulders in the light curves in all investigated bands. Although most models show similarly shaped early light curves, differences in the rise are clearly seen. If we consider the time when the light curves reach an absolute magnitude of in the band, a spread of about is observed.
Contrary to the commonly used assumption (e.g. Riess et al., 1999; Conley et al., 2006; Strovink, 2007; Hayden et al., 2010a; Nugent et al., 2011; Firth et al., 2015), the light curves do not follow a strict power law (not even a broken one) during these early phases. This becomes evident when displaying the light curve versus a logarithmic time axis, as done in insets shown in Fig. 3. A power-law evolution would follow a straight line in this visualization, which is not the case for all models included in this comparison during the first . This has important implications for reconstructing the time of explosion from observed early photometric data (see Section 5.5)
For the W7 model a small but visible break in the light-curve evolution around is observed in all but the band. We explore the origin of this light curve break in detail in Section 5.3.
5 Discussion
5.1 Rising phase
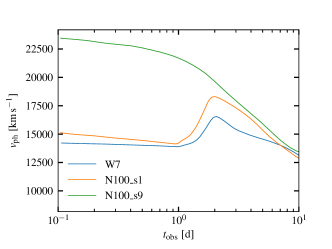
While all models that do not contain radioactive material close to the ejecta surface (i.e. with the exception of the double-detonation model) exhibit similarly shaped light curves, a different rise behaviour is observed. In particular, the various model light curves reach certain limiting absolute magnitudes at different times after explosion. The largest difference exists between the N100 and the merger model, which surpass the (arbitrarily chosen) limiting magnitude of in the band roughly apart. The remaining models fall between these two extremes. The reason for this different behaviour in the light curve rise lies in varying ejecta masses and different distributions. These properties can be combined into the column density
| (3) |
measured from the ejecta surface at and to the outermost ejecta zones where is still abundant (we selected here). As shown in Fig. 4, a clear correlation exists between this model property (measured at after explosion) and the time at which the limiting magnitude is reached.
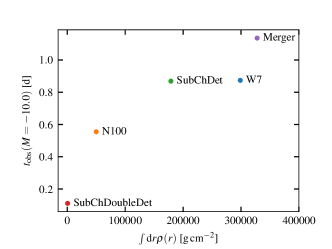
Hereby, models with less material on top of the -rich regime rise earlier, since the radiation generated in the radioactive decay can more easily diffuse out of the ejecta.
5.2 Surface Radioactivity
As seen in Fig. 3, even small amounts of radioactive material close to the surface of the SN ejecta lead to a very early rise of the light curves. For the double-detonation model investigated here, of radioactive material has been synthesized in the He-shell detonation (see Section 3.1.4). Since this material is clearly separated from the in the central ejecta regions, the corresponding radioactive decays lead to a first peak in the and -band light curves and a pronounced shoulder in and . In the model presented here, the prompt surface radioactivity signal is dominated by the decays of and that occur much faster than the chain. However, qualitatively similar results are also obtained with only close to the surface and separated from the core material as shown in Fig. 5.
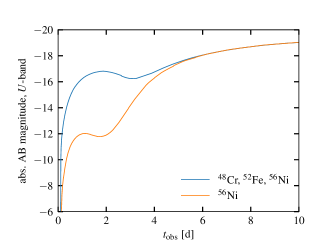
Here, the full SubChDoubleDet model is compared with a modified version, in which only the energy generation due to the decay chain is taken into account. As shown in the figure, already the produced in the He-shell detonation produces a prominent early peak in the -band light curve (see also Blinnikov & Sorokina, 2000, who found a similar behaviour for UV light curves of a double-detonation model).
Surface radioactivity has also a profound influence on the early colour evolution as demonstrated in Fig. 6 in terms of .
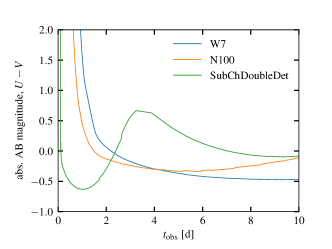
During the first in which the light output is powered by the decay of radioactive material close to the surface, the supernova appears very blue. As the prompt emission fades, the supernova becomes red again until the colour evolution is dominated by the radiation emanating from energy generation processes in the inner ejecta regions.
Qualitatively, the early evolution of the supernova colour and of the light curves in the different bands due to surface radioactivity is very similar to the predictions by Kasen (2010) concerning the signatures induced by the interaction of the ejecta with a companion. Also, interaction between ejecta and CSM may lead to similar early peaks and shoulders, as demonstrated by Piro & Morozova (2016). Consequently, we caution that not every blue excess detected very early on has to be interpreted as an indication for interaction between ejecta and CSM or a companion, but may also point towards radioactive material close to the surface. Information about the early SED of the exploding object may help to break this degeneracy.
5.3 Stratification
A peculiar result of the early light curve comparison in Section 4 is certainly the small but prominent break that the W7 model exhibits (cf. Fig. 3). This kink in the light curve cannot be caused by surface radioactivity since the entire 56Ni is confined to regions with and thus located quite far from the ejecta surface. Furthermore, we can exclude a link between this feature and the steep density drop-off that W7 exhibits in the outer ejecta regions and which is not observed in other SN Ia models (cf. Fig. 2). For this purpose, we constructed a W7-like toy model in which the density over the entire velocity range of the original model is replaced by the exponential profile
| (4) |
The composition of this toy model is adopted from the original W7 model. In this procedure, the parameters and are chosen such that the total mass remains constant. The masses of the various elements merely change slightly since the density differences are only significant in the outermost ejecta regions. The light curves calculated for this toy model still exhibit an almost identical early light curve break as the original W7 model.
Instead, this light curve feature seems to be associated with the strong stratification and layered composition in the W7 model. To explore this correlation, the toy model suite based on the N100 model in which the degree of internal mixing is gradually increased is considered (see Section 3.2.1). In Fig. 7, the resulting -band light curves for these models as calculated with Stella are shown.
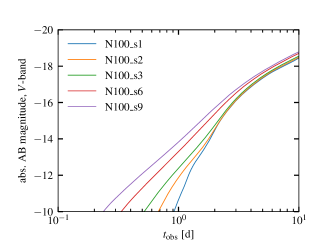
While the highly stratified model strongly exhibits a light curve kink as seen in W7, the kink gradually disappears as the degree of mixing increases.
Physically, the light curve break is associated with the strong variations in opacity at sharp interfaces between IME and CO regions. In strongly stratified models, radiation generated in the ejecta core due to radioactive decays is trapped and can only slowly leak out of the IME layer. During these early phases the ‘photosphere’ is located at the IME/CO interface and remains there as illustrated in Fig. 8.
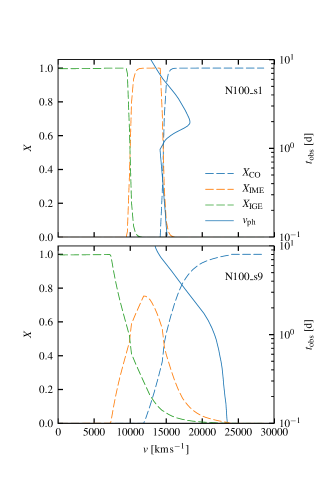
Here, and in the following the photosphere is defined as the location at with the optical depth for radiation at the centre of the -passband reaches . Only after the ejecta have expanded to make the IME layers sufficiently transparent, radiation can break out and heat the outer regions. This process temporarily shifts the photosphere outwards. However, shortly after this ‘break-out’ the photosphere follows its expected evolution and gradually recedes as the ejecta expand and cool. This non-monotonous evolution of the photosphere does not occur in well-mixed ejecta since the opacity drops off more regularly in such a configuration and radiation can continuously leak out from the centre (see Fig. 8). These differences in the photosphere evolution are again summarized in Fig. 9.
5.4 Power-law rise
None of the models for standard SNe Ia investigated in Section 4 produce early light curves that follow a strict power law. However, the calculations with the suite of toy models presented in Section 5.3, demonstrate that the light curves approach a power-law rise as the degree of mixing in the ejecta increases (see Fig. 7). We explore whether this trend generalizes to pure deflagration models, since this subsonic turbulent burning mode typically induces strong mixing in the ejecta. For this purpose, we calculate early light curves for one-dimensional representations of the pure deflagration models N5def and N1600Cdef, which represent extreme ends of the range of ignition configurations investigated by Fink et al. (2014). As demonstrated in Fig. 10, the strong mixing in these models indeed leads to a nearly perfect power-law rise of the light curve during the first ten days.
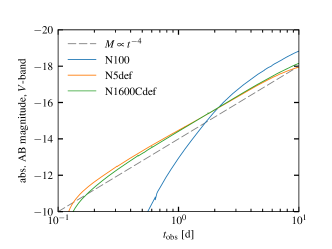
Specifically, both models roughly follow an rise in the band. The same behaviour holds also in other bands, particularly in the , and bands.
Although the pure deflagration scenario is not a suitable candidate for explaining normal SNe Ia, mainly due to its difficulty in producing large amounts of radioactive material, this model is currently heavily discussed in the context of SNe Iax (e.g. Phillips et al., 2007; Jordan et al., 2012; Foley et al., 2013). In particular, weak realizations of the pure deflagration model, which leave a bound remnant (‘failed deflagrations’ such as N5def) match observations of these objects very well (Kromer et al., 2013, 2015). Consequently, we predict that SNe Iax should be characterized by an early time strict power-law rise, provided that the association with the pure/failed deflagration scenario persists.
5.5 Estimating explosion times
From an observational point of view, the time of explosion of an SN Ia is typically determined by fitting a power law to early photometric data and extrapolating to (e.g. Riess et al., 1999; Conley et al., 2006; Strovink, 2007; Hayden et al., 2010a). This common practice should be questioned given that none of our normal SN Ia models produce early light curves, which follow a power-law behaviour. We explore and illustrate the consequences and uncertainties of such an explosion time determination by applying it to the synthetic Stella light curves and confronting the reconstructed with the real time of explosion.
For this purpose, we extract ‘virtual’ observations from the synthetic light curves. Hereby, we assume that the first observation is obtained at time after explosion and that further observations are available in daily intervals. The first four of these thus obtained epochs will be used in the fitting process, which is similar to the situation of estimating the explosion date for SN 2011fe (Nugent et al., 2011). In the fitting procedure, we attempt to model these virtual observations first by a generic power law, with an arbitrary but constant exponent (i.e. )
| (5) |
and secondly by the often used fireball model (see e.g. Nugent et al., 2011), which assumes that the luminosity evolves proportionally to and thus
| (6) |
In these two expressions, and are measured in days and , , and in the power-law case, are free parameters which are marginalized. Once the fitting procedure is complete, describes any offset between the reconstructed and the real explosion time. All model -band light curves were fitted with this procedure for in using the differential evolution module of SciPy (version 0.19.0, Jones et al., 01), which is based on the algorithm by Storn & Price (1997). Hereby, we restricted the parameter space to and minimized
| (7) |
The obtained results are listed in Tables 2 and 3 and illustrated at the example of the N100 model in Fig. 11.
| Model | (d) | (d) | |||
|---|---|---|---|---|---|
| W7 | |||||
| W7 | |||||
| W7 | |||||
| W7 | |||||
| N100 | |||||
| N100 | |||||
| N100 | |||||
| N100 | |||||
| N1600Cdef | |||||
| N1600Cdef | |||||
| N1600Cdef | |||||
| N1600Cdef | |||||
| N5def | |||||
| N5def | |||||
| N5def | |||||
| N5def | |||||
| SubChDet | |||||
| SubChDet | |||||
| SubChDet | |||||
| SubChDet | |||||
| Merger | |||||
| Merger | |||||
| Merger | |||||
| Merger |
| Model | (d) | (d) | ||
|---|---|---|---|---|
| W7 | ||||
| W7 | ||||
| W7 | ||||
| W7 | ||||
| N100 | ||||
| N100 | ||||
| N100 | ||||
| N100 | ||||
| N1600Cdef | ||||
| N1600Cdef | ||||
| N1600Cdef | ||||
| N1600Cdef | ||||
| N5def | ||||
| N5def | ||||
| N5def | ||||
| N5def | ||||
| SubChDet | ||||
| SubChDet | ||||
| SubChDet | ||||
| SubChDet | ||||
| Merger | ||||
| Merger | ||||
| Merger | ||||
| Merger |
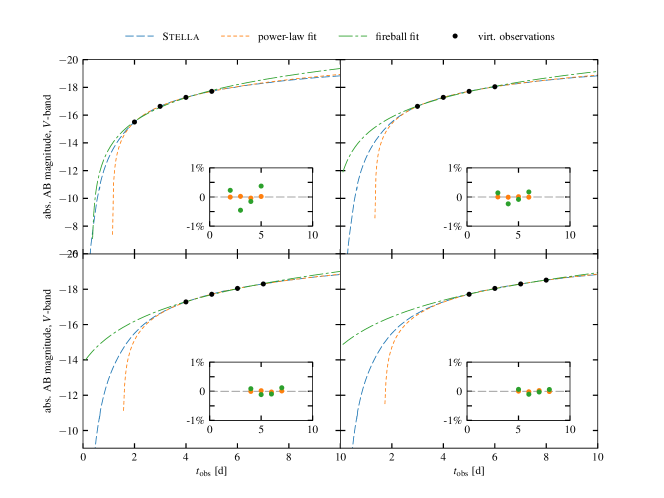
The illustration clearly demonstrates that very good fits can be achieved with both the power-law and the fireball model despite the fact that the underlying synthetic light curve does not follow a power-law trend. The accuracy of the fit is illustrated in the inset in Fig. 11 and is always below one per cent for the N100 model. Similar accuracies have been obtained for all other models as well. However, despite the goodness of fit, the time of explosion cannot be accurately reconstructed in most cases as illustrated in Fig. 12. The discrepancies between the actual and assumed functional form of the early light curve evolution are absorbed in the offset between real and reconstructed explosion time.
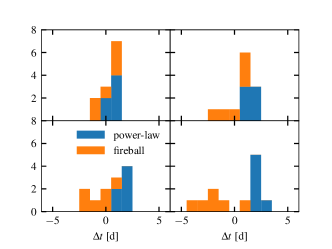
Overall, the determination of the explosion time is more accurate and reliable the earlier the observations are available (see also discussion in Section 5.6). Furthermore and as expected, the explosion time can be quite well determined for the deflagration models, which follow a power law. However, since the power-law index for these models is overall lowest and smaller than (see Section 5.4), the fireball fit yields the largest deviations for these models. In summary, this exploration clearly demonstrates that obtaining an accurate power-law fit to observed early-time photometric data roughly available in one day intervals does not necessarily imply that the explosion time can be well reconstructed. This severely affects constraining progenitor radii from early-time light curves (e.g. Bloom et al., 2012), which requires an accurate knowledge of the explosion date.
A similar problem has also been pointed out by Hachinger et al. (2013) and Mazzali et al. (2014) who found a discrepancy of between explosion dates inferred from early-time photometry and spectral modelling for the Type Ia SNe 2010jn and 2011fe, respectively. This has been interpreted as a sign of a ‘dark phase’ between the rise of the radioactively powered light curve and the actual explosion time, which is theoretically expected since it takes some time until radiation diffuses from the radioactively heated layers to the surface of the ejecta (Piro & Nakar, 2014).
In our simulations we do find a delay in the rise of the radioactively powered light curve of (see Fig. 13).
The actual value for the different models depends strongly on the distribution in the ejecta (compare also Section 5.1). Regardless, the delay associated with this ‘dark phase’ is significantly smaller than the typical error in the explosion date derived from a power-law fit to the model light curves. However, we caution that the detailed properties of the ‘dark phase’, in particular its duration and the absolute magnitude at which the cooling curve joins the radioactivity-dominated rise, are very sensitive to the gas temperature in the outer ejecta regions at the start of the calculations. As pointed out in Section 3.3, we use as a crude estimate. However, the true temperature value may very well be lower or higher.
5.6 Limitations
All results presented in this work are based on one-dimensional calculations. This simplification is appropriate for some explosion models since they are either produced in one-dimensional explosion calculations (W7) or do not show significant asymmetries in the multidimensional explosion simulations (N100, SubChDet). For others, however, significant asymmetries are predicted (SubChDoubleDet, merger) and the value of spherically averaged one-dimensional models may be questioned. For example, the double-detonation model by Fink et al. (2010) was ignited at the pole and the production of heavy elements and radioisotopes which lie close to the ejecta surface is strongest in this region. As a consequence, one expects that the surface radioactivity signatures as predicted in this work are strongest along lines of sight looking on to this ignition region and weakest when viewed from opposite directions. A quantitative estimate of the impact of such deviations from spherical symmetry is challenging and would require dedicated multidimensional calculations. However, tools which have been designed for this purpose, such as Artis, are currently ill-suited to treat the optically thick conditions at very early times.
In addition to the restriction to one-dimensional geometries, Stella compromises with respect to the level of detail in the radiative transfer treatment in order to offer an implicit solution to the full radiation hydrodynamical problem. For instance, ionization and excitation are assumed to be governed by LTE. This assumption should be appropriate at the very early phases during which the ejecta are largely optically thick, but it becomes more and more inaccurate as the ejecta expand. Despite the LTE assumption for the calculation of the plasma state, the source function, , is non-LTE (Blinnikov et al., 2006)
| (8) |
Nevertheless, based on the findings by Baron et al. (1996), Stella adopts a global thermalization parameter for line interactions (Blinnikov et al., 2006), which leads to a simplified treatment of fluorescence processes. Again, the consequences of all these simplifications are difficult to assess with the tools at hand. Eventually, dedicated and more detailed radiative transfer treatments should be used to predict early observables. In this context, the inefficiency of standard Monte Carlo approaches in optically thick regimes prohibits a simple extension of Artis calculations to early times.
For simplicity, all Stella calculations have been started at . As outlined in Section 3.3, the ejecta are very dense at these epochs and virtually opaque for radiation. Thus we do not expect a significant contribution to the observables at these times or an influence on the later evolution. For completeness, we have verified this by recalculating the N100, W7 and SubChDoubleDet models for . Hereby, we found no significant deviations in the light curves as shown in Fig. 3. Also the fits performed in Section 5.5 are largely unaffected when starting the simulations earlier. Only for and , differences can be observed, prominently in . However, as detailed in Section 5.5 and shown in Fig. 12, the largest deviations between the actual and inferred explosion time, as measured by , were already observed in these situations. Also, the fitting process becomes increasingly uncertain for larger . This is illustrated at the example of the fireball fit to the N100 synthetic light curve in Fig. 14.
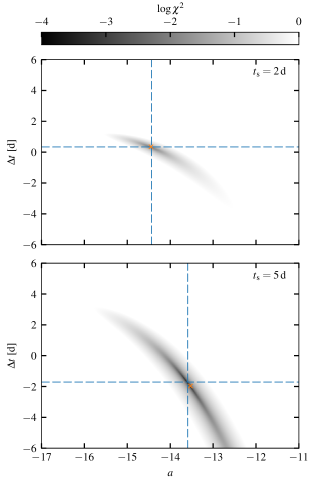
It shows the behaviour of from equation (7) in the parameter space around the best-fitting values. This illustration highlights that the region of parameter space that corresponds to good-quality fits (i.e. low ) grows as photometric data points further from the time of explosion are fitted. A very similar behaviour is observed when the generic power law is used. On the one hand, this explains why slightly different fitting results are obtained for light curves, which are almost identical. On the other hand, this finding strongly supports the statement already made in Section 5.5 about the increasing uncertainty of the explosion time reconstruction for light curve fits which use ever later data.
For the double detonation, which has radioactive material located close to the surface, the light curve rise starts slightly earlier when the simulations are initiated at an earlier time. In particular, the steep rise at (see insets in in Fig. 3) is superseded by a more gentle slope. However, the signal is so faint at these early epochs that this is of little practical consequence. Also the corresponding data point in Fig. 3 would only shift slightly to earlier times. The same argument applies to the deflagration models where radioactive material is spread throughout the ejecta.
We also explored the consequences of our assumption about the initial isothermal temperature. As discussed in Section 5.5, the temperature assumption should mainly affect the initial cooling phase. Thus, different temperatures will quantitatively change the results shown in Fig. 13. However, the later light-curve evolution that is dominated by radioactive decay, should be unaffected. We explicitly verified this at the example of the W7 model, by performing additional calculations with , and . In all calculations, the light curves after the initial cooling phase remain identical. In particular, the light curve break discussed in Section 5.3 and attributed to stratification persists. Only in the calculation with the highest assumed initial temperature the break is washed out slightly. This simply occurs because the initial cooling period now extends into the epoch at which the break happens. Ultimately, we emphasize that we do not expect high initial temperatures (i.e. at ) to prevail in the ejecta due to the strong effect of adiabatic cooling.
6 Summary and Conclusions
With our radiation hydrodynamical calculations presented in this work, we provide predictions for early light curves for a number of SN Ia explosion models based on detailed radiative transfer simulations. Compared to previous works by, for example, Piro & Morozova (2016), we perform detailed radiative transfer simulations and consider explosion models, which are mostly based on self-consistent, state-of-the art explosion calculations. Dessart et al. (2014a) use even more sophisticated radiative transfer methods, however, their analysis does not include the very early epochs () and their sample is restricted to Chandrasekhar-mass explosions. With our calculations, we aim at providing predictions for upcoming surveys and at exploring whether different explosion scenarios may be robustly differentiated based on very early photometric data.
We have calculated and presented light curves in the , , and bands for all our models during the first ten days after explosion. Overall, we find a very similar light-curve evolution during these early phases for most of the examined models. Differences are observed in the time when a certain absolute magnitude is reached, which can be linked to different diffusion times due to varying amounts of material on top of the -rich zones.
Notwithstanding the similar light-curve evolution, a number of ejecta properties were identified that imprint characteristic signatures on to the early observables. Most prominently, radioactive material close to the surface, as present in the double-detonation model, leads to a fast and very early rise of the light curve and extended shoulders or even a first maximum. However, a very similar behaviour is predicted for the interaction between ejecta and a companion (Kasen, 2010) or between ejecta and CSM (Piro & Morozova, 2016). Thus, it may prove challenging to identify the true underlying cause of such signatures from an observational point of view. Additional information, for example in terms of the detailed spectral behaviour or the emission in more energetic regimes, may be required to differentiate between these possibilities. For example, the detection of narrow or intermediate-width emission lines in early spectra would be strong indications for ejecta–CSM interaction. Likewise, the observation of -lines early on may point towards radioactive material close to the surface. However, such observations are only realistic for very nearby objects. In the past, this was possible in the case of SN 2014J, for which narrow lines were detected and attributed to (Diehl et al., 2014) located in the outer ejecta regions.
Finally, we have identified a modest break in early light-curve evolution in the W7 model and demonstrated that this feature may be a generic consequence of strong stratification in the supernova ejecta. The opposite situation of complete mixing in the ejecta, as seen in the pure deflagration models we investigated, also impacts the early light curves and leads to a strict power-law rise. Since SNe Iax are currently strongly associated with weak deflagrations (Kromer et al., 2013), we predict that the early light curves of such objects should feature a power-law rise.
Such a power-law rise of the light curve is often assumed when attempting to determine explosion times from early observational data. However, apart from the completely mixed deflagration models, none of the investigated models yielded light curves that evolved in such a manner. This has important consequences for reconstructing explosion times. We have illustrated this by fitting power laws to observations generated from our synthetic light curves. Despite the non-power-law evolution of the underlying models, we were able to fit the data with generic power laws and the fireball model to high accuracy, with deviations less than one per cent. This agreement was achieved, however, by a very inaccurate dating of the explosion time. In our tests, deviations of one to two days were very commonly encountered.
Upcoming survey programmes will establish a vast pool of very early data for SNe Ia. We demonstrated with our calculations, that based on early photometric data alone, it is challenging to unambiguously identify certain explosion scenarios or specific properties or mechanisms. In this context, our calculations should be viewed as first explorations, which should be expanded in the future by detailed predictions about the early spectral evolution and appearance in the - or X-ray regimes.
Acknowledgements
The authors thank R. Pakmor and S. Sim for many invaluable discussions, B. Shappee for fruitful correspondence and the anonymous reviewer for valuable comments, which helped to improve the paper. This work has been supported by the Transregional Collaborative Research Center TRR33 ‘The Dark Universe’ of the Deutsche Forschungsgemeinschaft and by the Cluster of Excellence ‘Origin and Structure of the Universe’ at Munich Technical University. The work of ES (statistical approach for opacity calculation) and PB (inclusion of new radioactive decay chains as additional sources of -energy) has been supported by a grant of the Russian Science Foundation 16-12-10519. The Swiss National Science Foundation has supported the work of SB through Grant no. IZ73Z0 152485 SCOPES. MK acknowledges support from the Klaus Tschira Foundation. PB is grateful to W. Hillebrandt and U. Noebauer for hospitality during his stay at the MPA. Data analysis and visualization was done using numpy, scipy (van der Walt et al., 2011) and matplotlib (Hunter, 2007).
References
- Baklanov et al. (2015) Baklanov P. V., Sorokina E. I., Blinnikov S. I., 2015, Astronomy Letters, 41, 95
- Baron et al. (1996) Baron E., Hauschildt P. H., Nugent P., Branch D., 1996, MNRAS, 283, 297
- Baron et al. (2006) Baron E., Bongard S., Branch D., Hauschildt P. H., 2006, ApJ, 645, 480
- Bessell & Murphy (2012) Bessell M., Murphy S., 2012, PASP, 124, 140
- Bianco et al. (2011) Bianco F. B., et al., 2011, ApJ, 741, 20
- Blinnikov & Bartunov (1993) Blinnikov S. I., Bartunov O. S., 1993, A&A, 273, 106
- Blinnikov & Khokhlov (1986) Blinnikov S. I., Khokhlov A. M., 1986, Soviet Astronomy Letters, 12, 131
- Blinnikov & Khokhlov (1987) Blinnikov S. I., Khokhlov A. M., 1987, Soviet Astronomy Letters, 13, 364
- Blinnikov & Sorokina (2000) Blinnikov S. I., Sorokina E. I., 2000, A&A, 356, L30
- Blinnikov & Tolstov (2011) Blinnikov S. I., Tolstov A. G., 2011, Astronomy Letters, 37, 194
- Blinnikov et al. (1998) Blinnikov S. I., Eastman R., Bartunov O. S., Popolitov V. A., Woosley S. E., 1998, ApJ, 496, 454
- Blinnikov et al. (2000) Blinnikov S., Lundqvist P., Bartunov O., Nomoto K., Iwamoto K., 2000, ApJ, 532, 1132
- Blinnikov et al. (2006) Blinnikov S. I., Röpke F. K., Sorokina E. I., Gieseler M., Reinecke M., Travaglio C., Hillebrandt W., Stritzinger M., 2006, A&A, 453, 229
- Bloom et al. (2012) Bloom J. S., et al., 2012, ApJ, 744, L17
- Branch et al. (1985) Branch D., Doggett J. B., Nomoto K., Thielemann F.-K., 1985, ApJ, 294, 619
- Bulla et al. (2016) Bulla M., Sim S. A., Pakmor R., Kromer M., Taubenberger S., Röpke F. K., Hillebrandt W., Seitenzahl I. R., 2016, MNRAS, 455, 1060
- Cao et al. (2015) Cao Y., et al., 2015, Nature, 521, 328
- Conley et al. (2006) Conley A., et al., 2006, AJ, 132, 1707
- Dessart et al. (2014a) Dessart L., Blondin S., Hillier D. J., Khokhlov A., 2014a, MNRAS, 441, 532
- Dessart et al. (2014b) Dessart L., Hillier D. J., Blondin S., Khokhlov A., 2014b, MNRAS, 441, 3249
- Diehl et al. (2014) Diehl R., et al., 2014, Science, 345, 1162
- Fink et al. (2010) Fink M., Röpke F. K., Hillebrandt W., Seitenzahl I. R., Sim S. A., Kromer M., 2010, A&A, 514, A53
- Fink et al. (2014) Fink M., et al., 2014, MNRAS, 438, 1762
- Firth et al. (2015) Firth R. E., et al., 2015, MNRAS, 446, 3895
- Foley et al. (2013) Foley R. J., et al., 2013, ApJ, 767, 57
- Friend & Abbott (1986) Friend D. B., Abbott D. C., 1986, ApJ, 311, 701
- Gall et al. (2012) Gall E. E. E., Taubenberger S., Kromer M., Sim S. A., Benetti S., Blanc G., Elias-Rosa N., Hillebrandt W., 2012, MNRAS, 427, 994
- Goobar et al. (2015) Goobar A., et al., 2015, ApJ, 799, 106
- Hachinger et al. (2013) Hachinger S., et al., 2013, MNRAS, 429, 2228
- Hayden et al. (2010a) Hayden B. T., et al., 2010a, ApJ, 712, 350
- Hayden et al. (2010b) Hayden B. T., et al., 2010b, ApJ, 722, 1691
- Hillebrandt & Niemeyer (2000) Hillebrandt W., Niemeyer J. C., 2000, ARA&A, 38, 191
- Hillebrandt et al. (2013) Hillebrandt W., Kromer M., Röpke F. K., Ruiter A. J., 2013, Frontiers of Physics, 8, 116
- Hillier & Dessart (2012) Hillier D. J., Dessart L., 2012, MNRAS, 424, 252
- Höflich (1995) Höflich P., 1995, ApJ, 443, 89
- Hoyle & Fowler (1960) Hoyle F., Fowler W. A., 1960, ApJ, 132, 565
- Hunter (2007) Hunter J. D., 2007, Computing in Science and Engineering, 9, 90
- Iben et al. (1987) Iben Jr. I., Nomoto K., Tornambe A., Tutukov A. V., 1987, ApJ, 317, 717
- Im et al. (2015) Im M., Choi C., Yoon S.-C., Kim J.-W., Ehgamberdiev S. A., Monard L. A. G., Sung H.-I., 2015, ApJS, 221, 22
- Iwamoto et al. (1999) Iwamoto K., Brachwitz F., Nomoto K., Kishimoto N., Umeda H., Hix W. R., Thielemann F., 1999, ApJS, 125, 439
- Jeffery et al. (1992) Jeffery D. J., Leibundgut B., Kirshner R. P., Benetti S., Branch D., Sonneborn G., 1992, ApJ, 397, 304
- Jones et al. (01 ) Jones E., Oliphant T., Peterson P., et al., 2001–, SciPy: Open source scientific tools for Python, http://www.scipy.org/
- Jordan et al. (2012) Jordan IV G. C., Perets H. B., Fisher R. T., van Rossum D. R., 2012, ApJ, 761, L23
- Kasen (2010) Kasen D., 2010, ApJ, 708, 1025
- Kasen et al. (2006) Kasen D., Thomas R. C., Nugent P., 2006, ApJ, 651, 366
- Kasen et al. (2009) Kasen D., Röpke F. K., Woosley S. E., 2009, Nature, 460, 869
- Khokhlov (1991) Khokhlov A. M., 1991, A&A, 245, 114
- Kozyreva et al. (2017) Kozyreva A., et al., 2017, MNRAS, 464, 2854
- Kromer & Sim (2009) Kromer M., Sim S. A., 2009, MNRAS, 398, 1809
- Kromer et al. (2010) Kromer M., Sim S. A., Fink M., Röpke F. K., Seitenzahl I. R., Hillebrandt W., 2010, ApJ, 719, 1067
- Kromer et al. (2013) Kromer M., et al., 2013, MNRAS, 429, 2287
- Kromer et al. (2015) Kromer M., et al., 2015, MNRAS, 450, 3045
- Kromer et al. (2016) Kromer M., et al., 2016, MNRAS, 459, 4428
- Kromer et al. (2017) Kromer M., Ohlmann S. T., Roepke F. K., 2017, preprint (arXiv:1706.09879)
- Kurucz & Bell (1995) Kurucz R. L., Bell B., 1995, Atomic Line List. Kurucz CD-ROM, Cambridge, MA: Smithsonian Astrophysical Observatory
- Lentz et al. (2001) Lentz E. J., Baron E., Branch D., Hauschildt P. H., 2001, ApJ, 557, 266
- Liu & Stancliffe (2016) Liu Z.-W., Stancliffe R. J., 2016, MNRAS, 459, 1781
- Livio & Riess (2003) Livio M., Riess A. G., 2003, ApJ, 594, L93
- Maoz et al. (2014) Maoz D., Mannucci F., Nelemans G., 2014, ARA&A, 52, 107
- Marion et al. (2016) Marion G. H., et al., 2016, ApJ, 820, 92
- Mazzali et al. (2014) Mazzali P. A., et al., 2014, MNRAS, 439, 1959
- Moll et al. (2014) Moll R., Raskin C., Kasen D., Woosley S. E., 2014, ApJ, 785, 105
- Noebauer et al. (2012) Noebauer U. M., Sim S. A., Kromer M., Röpke F. K., Hillebrandt W., 2012, MNRAS, 425, 1430
- Noebauer et al. (2016) Noebauer U. M., Taubenberger S., Blinnikov S., Sorokina E., Hillebrandt W., 2016, MNRAS, 463, 2972
- Nomoto et al. (1984) Nomoto K., Thielemann F., Yokoi K., 1984, ApJ, 286, 644
- Nugent et al. (1997) Nugent P., Baron E., Branch D., Fisher A., Hauschildt P. H., 1997, ApJ, 485, 812
- Nugent et al. (2011) Nugent P. E., et al., 2011, Nature, 480, 344
- Pakmor et al. (2010) Pakmor R., Kromer M., Röpke F. K., Sim S. A., Ruiter A. J., Hillebrandt W., 2010, Nature, 463, 61
- Pakmor et al. (2012) Pakmor R., Kromer M., Taubenberger S., Sim S. A., Röpke F. K., Hillebrandt W., 2012, ApJ, 747, L10
- Pakmor et al. (2013) Pakmor R., Kromer M., Taubenberger S., Springel V., 2013, ApJ, 770, L8
- Pereira et al. (2013) Pereira R., et al., 2013, A&A, 554, A27
- Phillips et al. (2007) Phillips M. M., et al., 2007, PASP, 119, 360
- Pinto & Eastman (2000) Pinto P. A., Eastman R. G., 2000, ApJ, 530, 744
- Piro & Morozova (2016) Piro A. L., Morozova V. S., 2016, ApJ, 826, 96
- Piro & Nakar (2014) Piro A. L., Nakar E., 2014, ApJ, 784, 85
- Piro et al. (2010) Piro A. L., Chang P., Weinberg N. N., 2010, ApJ, 708, 598
- Rabinak et al. (2012) Rabinak I., Livne E., Waxman E., 2012, ApJ, 757, 35
- Raskin & Kasen (2013) Raskin C., Kasen D., 2013, ApJ, 772, 1
- Riess et al. (1999) Riess A. G., et al., 1999, AJ, 118, 2675
- Röpke (2005) Röpke F. K., 2005, A&A, 432, 969
- Röpke et al. (2012) Röpke F. K., et al., 2012, ApJ, 750, L19
- Rosswog et al. (2009) Rosswog S., Kasen D., Guillochon J., Ramirez-Ruiz E., 2009, ApJ, 705, L128
- Ruiter et al. (2009) Ruiter A. J., Belczynski K., Fryer C., 2009, ApJ, 699, 2026
- Salvo et al. (2001) Salvo M. E., Cappellaro E., Mazzali P. A., Benetti S., Danziger I. J., Patat F., Turatto M., 2001, MNRAS, 321, 254
- Sasdelli et al. (2017) Sasdelli M., et al., 2017, MNRAS, 466, 3784
- Seitenzahl et al. (2013) Seitenzahl I. R., et al., 2013, MNRAS, 429, 1156
- Shappee et al. (2016a) Shappee B. J., Piro A. L., Stanek K. Z., Patel S. G., Margutti R. A., Lipunov V. M., Pogge R. W., 2016a, preprint (arXiv:1610.07601)
- Shappee et al. (2016b) Shappee B. J., et al., 2016b, ApJ, 826, 144
- Shen & Moore (2014) Shen K. J., Moore K., 2014, ApJ, 797, 46
- Shigeyama et al. (1992) Shigeyama T., Nomoto K., Yamaoka H., Thielemann F.-K., 1992, ApJ, 386, L13
- Sim et al. (2010) Sim S. A., Proga D., Miller L., Long K. S., Turner T. J., 2010, MNRAS, 408, 1396
- Soker et al. (2014) Soker N., García-Berro E., Althaus L. G., 2014, MNRAS, 437, L66
- Sorokina et al. (2016) Sorokina E., Blinnikov S., Nomoto K., Quimby R., Tolstov A., 2016, ApJ, 829, 17
- Storn & Price (1997) Storn R., Price K., 1997, Journal of Global Optimization, 11, 341
- Strovink (2007) Strovink M., 2007, ApJ, 671, 1084
- Tanikawa et al. (2015) Tanikawa A., Nakasato N., Sato Y., Nomoto K., Maeda K., Hachisu I., 2015, ApJ, 807, 40
- Woosley & Kasen (2011) Woosley S. E., Kasen D., 2011, ApJ, 734, 38
- Woosley et al. (2007) Woosley S. E., Kasen D., Blinnikov S., Sorokina E., 2007, ApJ, 662, 487
- Zheng et al. (2013) Zheng W., et al., 2013, ApJ, 778, L15
- Zheng et al. (2014) Zheng W., et al., 2014, ApJ, 783, L24
- van der Walt et al. (2011) van der Walt S., Colbert S. C., Varoquaux G., 2011, Computing in Science Engineering, 13, 22