First Spectroscopic Confirmations of z 7.0 Ly Emitting Galaxies in the LAGER Survey
Abstract
Narrowband imaging is a highly successful approach for finding large numbers of high redshift Ly emitting galaxies (LAEs) up to . However, at there are as yet only 3 narrowband selected LAEs with spectroscopic confirmations (two at , one at ), which hinders extensive studies on cosmic reionization and galaxy evolution at this key epoch. We have selected 23 candidate LAEs in COSMOS field with the large area narrowband survey LAGER (Lyman-Alpha Galaxies at the End of Reionization). In this work we present spectroscopic followup observations of 12 candidates using IMACS on Magellan. For 9 of these, the observations are sufficiently deep to detect the expected lines. Ly emission lines are identified in six sources (yielding a success rate of 2/3), including 3 luminous LAEs with Ly luminosities of 1043.5 erg s-1, the highest among known spectroscopically confirmed galaxies at . This triples the sample size of spectroscopically confirmed narrowband selected LAEs at , and confirms the bright end bump in the Ly luminosity function we previously derived based on the photometric sample, supporting a patchy reionization scenario. Two luminous LAEs appear physically linked with projected distance of 1.1 pMpc and velocity difference of 170 km s-1. They likely sit in a common ionized bubble produced by themselves or with close neighbors, which reduces the IGM attenuation of Ly. A tentative narrow N v1240 line is seen in one source, hinting at activity of a central massive black hole with metal rich line emitting gas.
Subject headings:
galaxies: formation – galaxies: high-redshift – cosmology: observations – dark ages, reionization, first stars1. Introduction
In the past two decades, narrowband imaging surveys have been proven a highly efficient approach for finding high redshift Ly emitting galaxies (LAEs). Many LAEs from to 6.6 have been selected via narrowband imaging and spectroscopically identified (e.g. Hu & McMahon 1996; Hu et al. 2004, 2010; Wang et al. 2009; Rhoads et al. 2003, 2004; Dawson et al. 2004, 2007; Ouchi et al. 2005, 2008, 2010; Tapken et al. 2006; Westra et al. 2006; Shibuya et al. 2014, 2017; Zheng et al. 2016).
As Ly photons can be resonantly scattered by the neutral hydrogen in the IGM in the early universe, Ly emitters provide a powerful probe of cosmic reionization. Comparison of Ly luminosity functions at and 6.5 (Malhotra & Rhoads 2004; Hu et al. 2010; Ouchi et al. 2010; Kashikawa et al. 2011; Matthee et al. 2015) suggest a mostly ionized IGM at ( xHI 0.3). However, at , when the dominant phase of cosmic reionization took place, only a few candidate LAEs have been selected from various narrowband surveys (at redshifts of 6.9 – 7.0, 7.3, 7.7 and 8.8, Iye et al. 2006; Ota et al. 2008, 2012; Ota & Iye 2012; Hibon et al. 2010, 2011, 2012; Shibuya et al. 2012; Konno et al. 2014; Tilvi et al. 2010; Krug et al. 2012; Matthee et al. 2014). More importantly, only 3 of them have been spectroscopically confirmed (two at , one at , Iye et al. 2006; Rhoads et al. 2012; Shibuya et al. 2012), demonstrating the significant challenge in the search for LAEs at . The challenge is at least partly due to IGM attenuation of Ly line flux at (e.g. Zheng et al. 2017; Konno et al. 2014; Shibuya et al. 2012; Tilvi et al. 2010; Matthee et al. 2014). Much larger samples of LAEs, particularly spectroscopically confirmed ones, are essential to probe the physics of reionization and galaxy formation/evolution in the early universe.
LAGER (Lyman-Alpha Galaxies in the Epoch of Reionization) is an ongoing large narrowband survey for LAEs at , using the Dark Energy Camera (DECam, with FOV 3 deg2) on the NOAO-CTIO 4m Blanco telescope with an optimally designed custom narrowband filter NB964 (FWHM 90Å).
In the first LAGER field (COSMOS), we have selected 23 LAE candidates at (Zheng et al. 2017). The Ly luminosity function shows a rapid faint-end evolution from to and 5.7, suggesting an IGM neutral hydrogen fraction of xHI=0.4–0.6 at . More strikingly, the LF shows a clear excess in the bright end, including 4 of the brightest candidates (with LLyα 1043.4 erg s-1, Zheng et al. 2017). Such bright end LF excess suggests that reionization could be patchy, and those 4 luminous candidates located in ionized bubbles which reduce the IGM attenuation of Ly lines.
In this paper we present spectroscopic followup observations of 12 of the candidate LAEs. In §2 we present the observations and data reduction. The spectra and identifications are given in §3, followed by discussion in §4. Throughout this work, we adopt a flat CDM cosmology with , and H km s-1 Mpc-1.
2. Observations and Data Reduction
2.1. Spectroscopic Observations
With the narrowband filter NB964 (Å, FWHM 90 Å) and the DECam mounted on the CTIO Blanco 4m telescope, we have obtained 34 hrs NB exposure in COSMOS field, reaching a 3 limiting AB magnitude of 25.6 (2″ diameter aperture). Candidate LAEs were selected with flux excess between NB964 and deep z band images (z - NB964 1.0). Foreground contaminations are efficiently excluded using deep bluer broadband images. The final sample includes 23 candidates (for details see Zheng et al. 2017). All of our candidates have erg s-1 and rest-frame EW0,Lyα 10 Å.
We carried out spectroscopic follow-up for 12 of 23 candidate LAEs using the Inamori Magellan Areal Camera and Spectrograph (IMACS) on the 6.5m Magellan I Baade Telescope on 2017 February 6-8 and March 21-22. We used the IMACS camera (with FOV of 27′ diameter) with 300-line red-blazed grism. IMACS masks with 1″ slit width were designed to cover candidate LAEs, foreground fillers, 6 late-type standard stars from UltraVISTA catalog (Muzzin et al. 2013) for on-mask flux calibration, and at least 11 alignment stars. Two masks were observed during the run, with each mask covering 6 candidate LAEs (LAE-4,6,8,13,17,18 on Mask 1, and LAE-1,2,3,11,21,23 on Mask 2). We ultimately obtained 390 minutes IMACS exposure for Mask 1 and 340 minutes exposure for Mask 2 (Table 1). The seeing was during the February run and in the March run, however the February run (Mask 2) was affected by significant moon light pollution (with the moon 81%–95% illuminated and 65∘–38∘ from the field on 2017 Feb 6–8).
| Mask ID |
|
|
|
|
|
|||||
|---|---|---|---|---|---|---|---|---|---|---|
| Mask 1 | 2017 Mar 21 | 600 | 1 | 600 | ||||||
| Mask 1 | 2017 Mar 21-22 | 1200 | 19 | 22800 | ||||||
| Mask 2 | 2017 Feb 6-8 | 1200 | 17 | 20400 |
-
*
Exposure time per frame.
-
**
Total exposure time.
2.2. Data Reduction and Analysis
We used COSMOS2111http://code.obs.carnegiescience.edu/cosmos software package for IMACS data reduction. COSMOS2 does bias subtraction, flat fielding using quartz lamp exposures, wavelength solution and calibration using arc lamp exposures, and sky subtraction. Finally, it extracts a two-dimensional spectrum for each slit. After standard data reduction steps, we remove cosmic rays using L.A.Cosmic (van Dokkum 2001), and stacked spectra from individual frames using a weighted-stack method to maximize the SN of the co-added spectra. The signal-to-noise ratio of an exposure is inversely proportional to the RMS background variation. Thus, it is reasonable to built a wavelength-dependent weighting map for an exposure based on this background variation as measured from source-free pixels along the slit direction at each wavelength:
| (1) |
where is the weight at in the th exposure, and is the RMS background variation at . Finally, we obtained a two-dimensional stacked spectrum for each slit. We then extracted one-dimensional spectra from stacked two-dimensional spectra using IRAF task APALL with an extraction window of along the spectral traces. We flux-calibrated the spectrum of each candidate LAE using the spectra of the six stars included on the slit mask, using the stars’ known magnitudes and colors to estimate their intrinsic spectral energy distributions.
| Name | RA | DEC |
|
|
|
EW | EW |
|
|
|
S/N | ||||||
|---|---|---|---|---|---|---|---|---|---|---|---|---|---|---|---|---|---|
| LAE-1 | 10:02:06.0 | +2:06:46.1 | 6.936 | 7.79 | 14.3 | ||||||||||||
| LAE-2 | 10:03:10.5 | +2:12:30.8 | 6.922 | 5.86 | 8.1 | ||||||||||||
| LAE-3 | 10:01:53.5 | +2:04:59.6 | 6.931 | 5.11 | 10.3 | ||||||||||||
| LAE-14 | 9:58:45.2 | +2:31:29.2 | 6.924 | 1.48 | 8.6 | ||||||||||||
| LAE-17 | 9:59:21.7 | +2:14:53.2 | 6.885 | 1.20 | 8.4 | ||||||||||||
| LAE-18 | 9:59:59.8 | +2:29:06.5 | 6.925 | 1.21 | 4.5 |
-
a
a The redshift is determined from the Ly emission line fitted with Gaussian profile;
-
b
b Spectroscopically measured Ly line flux ();
- c
-
d
d Rest frame Ly line EW0 derived using spectroscopical line flux and Y band based continuum flux (Å).
-
e
e Weighted skewness, as defined in Kashikawa et al. (2006).
-
f
f UV magnitude, measured using Ultra-VISTA J band (DR3) photometry (McCracken et al. 2012).
-
g
g Line width corrected for the instrumental broadening, .
3. Spectroscopic Results
Among the 12 candidates, emission lines at expected wavelengths are detected in six sources. The lines are visible in both halves of the dataset stacked separately, showing that they are not artificial features. We do not detect continuum from any of them. We present the 2-d and 1-d spectra of the 6 sources in Fig. 1. Except for LAE-18 (in which we identified two lines), these lines are the only ones we detected in the spectra. We fitted a Gaussian profile to every detected line, and measured line fluxes using the Pyspeckit Python module (Ginsburg & Mirocha 2011). The uncertainties in the line fluxes are estimated through Monte-Carlo simulations. We added random noise based on the variation along the slit direction to the 2D spectra, re-extracted the 1D spectra, and re-measured the line fluxes. We run the simulations 10000 times and fitted a Gaussian to the flux distribution to derive the uncertainty of the flux measurement. The same technique was applied to obtain the uncertainties of other line parameters. We also performed weighted skewness (Kashikawa et al. 2006) measurements for those emission lines. Weighted skewness 3 is considered a robust indication that a line is asymmetric (Kashikawa et al. 2006). Table 2 summarizes the spectroscopic properties of our candidate LAEs.
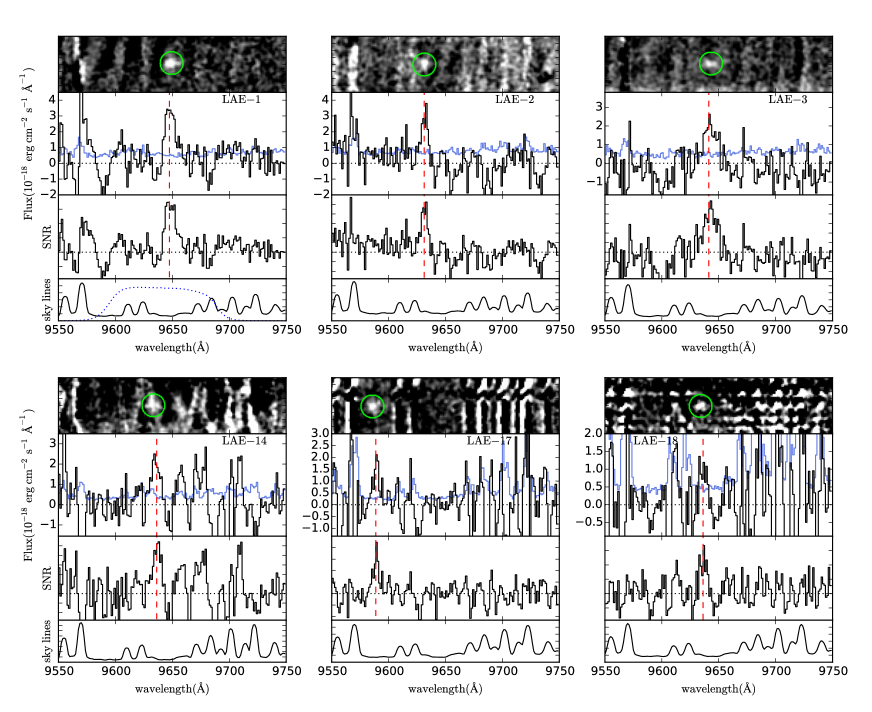
The significant emission lines in LAE-1 and LAE-3 are clearly asymmetric with red wings, typical of high redshift Ly emission lines. The 4 other lines are narrower and statistically consistent with symmetry, though the non-detections of line asymmetry in these sources might be due to low line S/Ns or an adjacent sky line (in LAE-2). The intrinsic line widths of the 6 sources span 100 – 300 km s-1, while the instrumental spectral resolution is 184 km s-1. Although line profiles alone can only robustly confirm LAE-1 and LAE-3 as LAEs, we identify all the six lines as Ly at 6.9, and low- foreground emission lines can be ruled out as follows.
[O iii]4959 can be ruled out because the stronger [O iii]5007 lines are not seen. If the detected lines are [O iii]5007, the lower limits to the [O iii]5007/H ratio of most sources would be implausibly large ( 10). For LAE-17, if the observed line was [O iii]5007, the lower limit of [O iii]5007/[O ii]3727 ( 11.45) would require a rather low metallicity of 12+log(O/H) 7 (Nagao et al. 2006). However LAE-17 has a red color (z-J 1) inconsistent with a young and low metallicity galaxy at .
H is disfavored as the upper limits to [O iii]5007/H line ratio ( 0.08 - 0.5) correspond to metallicities of (Nagao et al. 2006). Galaxies at with such high metallicity should be very massive and bright, and should have been detected in the deep broadband images; For LAE-17, we lack the spectral coverage to measure [O iii]5007 if the detected line were H, but the [O ii]3727/H line ratio ( 0.15) would again require very low metallicity.
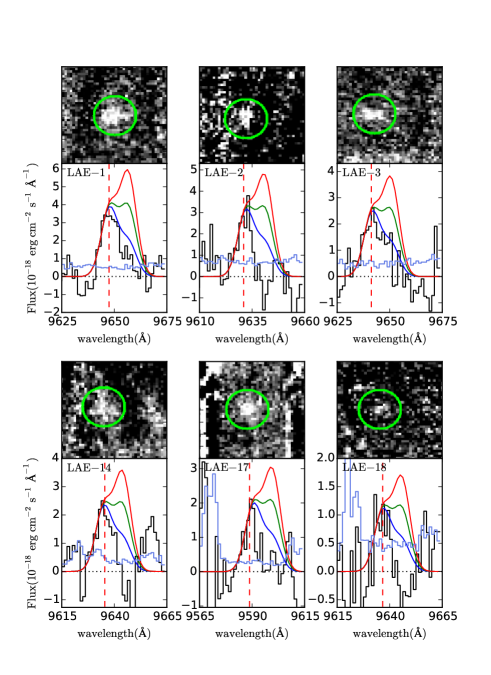
If the detected lines are H, then H and/or [O iii] should be detected for each candidate LAE. Finally, the [O ii]3727 doublet can also be ruled out. For LAE-2, LAE-14, LAE-17 and LAE-18, the detected line are too narrow to be [O ii]3727 (see Fig. 2). If the broader and asymmetric lines in LAE-1 and LAE-3 were [O ii]3727, they will have improbably large [O ii] equivalent widths ( 3000 Å in the rest frame, derived with NB964 magnitudes and 3 upper limits to band magnitude). [O ii] emitters usually have small line EW0s. A sample of 1300 [O ii] emitters at have an average line EW0 of 45 Å, and the largest line EW0 1000Å (Ly et al. 2012). Furthermore, according to an [O ii] luminosity function (Comparat et al. 2015), we expect 400 [O ii] emitters in our field as bright as LAE-1 and LAE-3. Therefore, even if [O ii] emitters with EW0 3000Å do exist and have a fraction of 1/1300, we only expect 0.3 of them in LAGER COSMOS field.
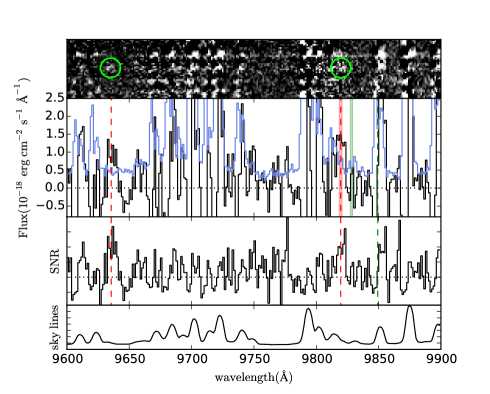
In LAE-18, we detect a second emission line at 9819.61.1 Å (see Fig. 3). We identify it as N v1239 line at the same redshift of Ly ()222 The possibility that the two lines are H () and [O iii]4959 (, while [O iii]5007 sits on a sky line) respectively can be ruled out, as it would require a blueshift of 26044 km s-1 in [O iii] line. Although large [O iii] blueshifts are not unusual among AGNs, sources with such large [O iii] blueshifts always have line width FWHM 470 km s-1 ( 200 km/s, see Figure 6 in Bae & Woo (2014)), much broader than the lines we detected (FWHM 173 km s-1)., with a 3 upper limit of 130 km/s to the potential velocity shift between Ly and N v. We fit the line with a Gaussian and derive a flux of 1.130.34, corresponding to a N v/Ly line ratio of 1.330.50. Note Hamann et al. (2017) presents an extreme red quasar population which exhibits similarly large N v/Ly ratios at . Tilvi et al. (2016) also shows a tentative N v line with N v/Ly line ratio of 0.850.25 in a LBG.
The Ly identifications of the six lines are further strengthened by non-detections in the deep broadband images bluer than z band (Zheng et al. 2017). We find no g, r, i detections either using the recently released ultra deep HSC images (Aihara et al. 2017).
We identified neither lines nor continuum from the spectra of the remaining 6 sources. For the 3 non-detections on Mask 2 (LAE-11, 21, 23), the sky background is elevated by bright moonlight. The expected line S/Ns are therefore rather low ( 2, based on photometric line fluxes, and assuming 50% slit loss, which is typical for our spectroscopically confirmed LAEs— cf. table 2). Deeper spectroscopy is therefore still required to clarify whether these sources are in fact LAEs.
For the 3 sources on Mask 1 (LAE-4, 6, 8), we expect to detect Ly lines with S/N of 4 – 9.333 Note the expected line S/N would be considerably lower if the line is intrinsically broader than detected in this work. Assuming a line width of 500 km/s, for LAE-4, 6, 8 the expected line S/N would be 2 – 4. Particularly LAE-4 is one luminous LAE candidate, among the 4 we identified. These sources are therefore unlikely LAEs, and they could be faint transients instead.
4. Discussion
We obtained IMACS spectra for 12 candidate LAEs, and spectroscopically confirmed 6 sources at , including 3 luminous LAEs with Ly luminosities of 1043.5 erg s-1 and 3 fainter ones at 1042.9 erg s-1. The three luminous LAEs have the highest Ly luminosities among known spectroscopically confirmed 7.0 galaxies (e.g. Stark et al. 2017; Iye et al. 2006; Rhoads et al. 2012; Ono et al. 2012). Considering the expected S/Ns are insufficient for 3 candidates on mask, we achieved a success rate of 67% (6/9). Including the LAE J095950.99+021219.1 (which was independently identified both in LAGER and by Hibon et al. (2011), and spectroscopically confirmed by Rhoads et al. (2012)) we now have a spectroscopic sample of 7 LAEs at in COSMOS field. This demonstrates for the first time that narrowband imaging is a highly efficient tool to select LAEs at , as at lower redshifts. The high success rate validates the direct use of the photometric sample to derive Ly luminosity function (Zheng et al. 2017).
4.1. The Luminous LAEs and Ionized Bubbles
The spectroscopic confirmations of the 3 (out of 4) luminous LAEs at are particularly encouraging. The bright end excess in the Ly luminosity function we presented in Zheng et al. (2017) is thus spectroscopically affirmed, supporting a patchy reionization scenario. The 4th source showed no signal in IMACS spectra, and is likely a transient.
The projected distance between the two luminous LAEs (LAE-1 and LAE-3) is rather small (3.6′, 1.1 pMpc). Their redshifts differ by only 0.0045, corresponding to a velocity difference of 170 km s-1. Assuming the 3 luminous confirmed LAEs are randomly distributed in the volume our narrowband image probes, the chance probability to have a pair like LAE-1 and LAE-3 is only 0.2%. This indicates LAE-1 and LAE-3 are physically connected. They likely sit in a common ionized bubble, which alleviates the neutral IGM attenuation. Such a bubble could be produced in some combination by the observed LAEs themselves and probably also their close neighbors (such as nearby faint candidate LAE-11) (Malhotra et al 2017, in prep). These galaxies may have undergone AGN phases (see §4.2) which could also have helped produce an ionized bubble. The presence of such a bubble could also aid the detection of fainter LAEs, which can be tested with deeper narrowband imaging.
4.2. The Tentative Detection of NV Emission Line
In LAE-18, we detect a possible N v1240 emission line, with a S/N of 3.3. Comparing with N v, Ly shows no velocity offset.
The presence of high ionization N v1240 requires a very hard ionizing spectrum: Production of the N v line requires ionizing photons of 5.7 Ryd. For comparison, the ionization potentials to produce other high ionization UV nebular lines detected in high- LAEs/LBGs are 4 Ryd (He ii), 3.5 Ryd (C iv), and 2.5 ([O iii]) respectively (e.g. Stark et al. 2015a, b; Mainali et al. 2017; Schmidt et al. 2017; Shibuya et al. 2017; Sobral et al. 2015). LAE-18 should thus be a narrow line AGN, driven by a central accreting super-massive black hole. Furthermore, the presence of N v line also suggests the line emitting gas is metal rich. The line ratios of N v/C iv and N v/He ii are often adopted to measure the metallicity in quasars (Hamann & Ferland 1993). Super-solar metallicities have been reported for luminous 6 quasars (Pentericci et al. 2002; Jiang et al. 2007; Juarez et al. 2009). It is interesting to find out whether such high metallicity is also seen in less luminous AGNs at such high redshifts. No X-ray or radio counterpart of LAE-18 was detected with COSMOS archival images444http://irsa.ipac.caltech.edu/data/COSMOS/, which is perhaps to be expected, as the images are not deep enough to detect a normal AGN at such high redshift. Further deep NIR spectroscopic followup is urged to confirm the physical nature of LAE-18 and measure its metallicity.
The N v line in LAE-18 can be combined with a possible N v line detected in a LBG (Tilvi et al. 2016), and with the detections of high ionization C iv1549 emission lines (which could also be powered by AGN activity, or very hot metal-poor stellar population) in UV selected LBGs at 6 – 7 (Stark et al. 2015a; Mainali et al. 2017; Schmidt et al. 2017). Note Shibuya et al. (2017) also presented one tentative detection of C iv1540 line in one luminous LAE at . Meanwhile, the AGN fraction among narrowband selected high redshift (up to 5.7) LAEs, at Ly luminosities similar to that of LAE-18, was known to be very small ( 5 – 10%) (Wang et al. 2004; Ouchi et al. 2008; Wang et al. 2009; Zheng et al. 2010). Together, these results suggest that the AGN fraction among galaxies at may be elevated compared to that at 4 – 6. If such sources are confirmed as AGNs and are common among 6 galaxies, they would produce more ionizing photons at a given UV luminosity comparing with typical star forming galaxies, and could have played a non-negligible role in cosmic reionization (e.g. Giallongo et al. 2015; Madau & Haardt 2015).
References
- Aihara et al. (2017) Aihara, H., Armstrong, R., Bickerton, S., et al. 2017, ArXiv e-prints, arXiv:1702.08449 [astro-ph.IM]
- Bae & Woo (2014) Bae, H.-J., & Woo, J.-H. 2014, ApJ, 795, 30
- Comparat et al. (2015) Comparat, J., Richard, J., Kneib, J.-P., et al. 2015, A&A, 575, A40
- Dawson et al. (2007) Dawson, S., Rhoads, J. E., Malhotra, S., et al. 2007, ApJ, 671, 1227
- Dawson et al. (2004) —. 2004, ApJ, 617, 707
- Finkelstein et al. (2013) Finkelstein, S. L., Papovich, C., Dickinson, M., et al. 2013, Nature, 502, 524
- Giallongo et al. (2015) Giallongo, E., Grazian, A., Fiore, F., et al. 2015, A&A, 578, A83
- Ginsburg & Mirocha (2011) Ginsburg, A., & Mirocha, J. 2011, PySpecKit: Python Spectroscopic Toolkit, Astrophysics Source Code Library, ascl:1109.001
- Hamann & Ferland (1993) Hamann, F., & Ferland, G. 1993, ApJ, 418, 11
- Hamann et al. (2017) Hamann, F., Zakamska, N. L., Ross, N., et al. 2017, MNRAS, 464, 3431
- Hibon et al. (2012) Hibon, P., Kashikawa, N., Willott, C., Iye, M., & Shibuya, T. 2012, ApJ, 744, 89
- Hibon et al. (2011) Hibon, P., Malhotra, S., Rhoads, J., & Willott, C. 2011, ApJ, 741, 101
- Hibon et al. (2010) Hibon, P., Cuby, J.-G., Willis, J., et al. 2010, A&A, 515, A97
- Hu et al. (2010) Hu, E. M., Cowie, L. L., Barger, A. J., et al. 2010, ApJ, 725, 394
- Hu et al. (2004) Hu, E. M., Cowie, L. L., Capak, P., et al. 2004, AJ, 127, 563
- Hu & McMahon (1996) Hu, E. M., & McMahon, R. G. 1996, Nature, 382, 231
- Iye et al. (2006) Iye, M., Ota, K., Kashikawa, N., et al. 2006, Nature, 443, 186
- Jiang et al. (2007) Jiang, L., Fan, X., Vestergaard, M., et al. 2007, AJ, 134, 1150
- Juarez et al. (2009) Juarez, Y., Maiolino, R., Mujica, R., et al. 2009, A&A, 494, L25
- Kashikawa et al. (2006) Kashikawa, N., Shimasaku, K., Malkan, M. A., et al. 2006, ApJ, 648, 7
- Kashikawa et al. (2011) Kashikawa, N., Shimasaku, K., Matsuda, Y., et al. 2011, ApJ, 734, 119
- Konno et al. (2014) Konno, A., Ouchi, M., Ono, Y., et al. 2014, ApJ, 797, 16
- Krug et al. (2012) Krug, H. B., Veilleux, S., Tilvi, V., et al. 2012, ApJ, 745, 122
- Ly et al. (2012) Ly, C., Malkan, M. A., Kashikawa, N., et al. 2012, ApJ, 757, 63
- Madau & Haardt (2015) Madau, P., & Haardt, F. 2015, ApJ, 813, L8
- Mainali et al. (2017) Mainali, R., Kollmeier, J. A., Stark, D. P., et al. 2017, ApJ, 836, L14
- Malhotra & Rhoads (2004) Malhotra, S., & Rhoads, J. E. 2004, ApJ, 617, L5
- Matthee et al. (2017) Matthee, J., Sobral, D., Darvish, S., et al. 2017, ArXiv e-prints, arXiv:1706.06591
- Matthee et al. (2015) Matthee, J., Sobral, D., Santos, S., et al. 2015, MNRAS, 451, 400
- Matthee et al. (2014) Matthee, J. J. A., Sobral, D., Swinbank, A. M., et al. 2014, MNRAS, 440, 2375
- McCracken et al. (2012) McCracken, H. J., Milvang-Jensen, B., Dunlop, J., et al. 2012, A&A, 544, A156
- Muzzin et al. (2013) Muzzin, A., Marchesini, D., Stefanon, M., et al. 2013, ApJS, 206, 8
- Nagao et al. (2006) Nagao, T., Maiolino, R., & Marconi, A. 2006, A&A, 459, 85
- Ono et al. (2012) Ono, Y., Ouchi, M., Mobasher, B., et al. 2012, ApJ, 744, 83
- Ota & Iye (2012) Ota, K., & Iye, M. 2012, MNRAS, 423, 444
- Ota et al. (2012) Ota, K., Richard, J., Iye, M., et al. 2012, MNRAS, 423, 2829
- Ota et al. (2008) Ota, K., Iye, M., Kashikawa, N., et al. 2008, ApJ, 677, 12
- Ouchi et al. (2005) Ouchi, M., Shimasaku, K., Akiyama, M., et al. 2005, ApJ, 620, L1
- Ouchi et al. (2008) —. 2008, ApJS, 176, 301
- Ouchi et al. (2010) Ouchi, M., Shimasaku, K., Furusawa, H., et al. 2010, ApJ, 723, 869
- Pentericci et al. (2002) Pentericci, L., Fan, X., Rix, H.-W., et al. 2002, AJ, 123, 2151
- Rhoads et al. (2012) Rhoads, J. E., Hibon, P., Malhotra, S., Cooper, M., & Weiner, B. 2012, ApJ, 752, L28
- Rhoads et al. (2003) Rhoads, J. E., Dey, A., Malhotra, S., et al. 2003, AJ, 125, 1006
- Rhoads et al. (2004) Rhoads, J. E., Xu, C., Dawson, S., et al. 2004, ApJ, 611, 59
- Schmidt et al. (2017) Schmidt, K. B., Huang, K.-H., Treu, T., et al. 2017, ApJ, 839, 17
- Shibuya et al. (2012) Shibuya, T., Kashikawa, N., Ota, K., et al. 2012, ApJ, 752, 114
- Shibuya et al. (2014) Shibuya, T., Ouchi, M., Nakajima, K., et al. 2014, ApJ, 788, 74
- Shibuya et al. (2017) Shibuya, T., Ouchi, M., Harikane, Y., et al. 2017, ArXiv e-prints, arXiv:1705.00733
- Sobral et al. (2015) Sobral, D., Matthee, J., Darvish, B., et al. 2015, ApJ, 808, 139
- Stark et al. (2015a) Stark, D. P., Walth, G., Charlot, S., et al. 2015a, MNRAS, 454, 1393
- Stark et al. (2015b) Stark, D. P., Richard, J., Charlot, S., et al. 2015b, MNRAS, 450, 1846
- Stark et al. (2017) Stark, D. P., Ellis, R. S., Charlot, S., et al. 2017, MNRAS, 464, 469
- Tapken et al. (2006) Tapken, C., Appenzeller, I., Gabasch, A., et al. 2006, A&A, 455, 145
- Tilvi et al. (2010) Tilvi, V., Rhoads, J. E., Hibon, P., et al. 2010, ApJ, 721, 1853
- Tilvi et al. (2016) Tilvi, V., Pirzkal, N., Malhotra, S., et al. 2016, ApJ, 827, L14
- van Dokkum (2001) van Dokkum, P. G. 2001, PASP, 113, 1420
- Wang et al. (2009) Wang, J.-X., Malhotra, S., Rhoads, J. E., Zhang, H.-T., & Finkelstein, S. L. 2009, ApJ, 706, 762
- Wang et al. (2004) Wang, J. X., Rhoads, J. E., Malhotra, S., et al. 2004, ApJ, 608, L21
- Westra et al. (2006) Westra, E., Jones, D. H., Lidman, C. E., et al. 2006, A&A, 455, 61
- Zheng et al. (2016) Zheng, Z.-Y., Malhotra, S., Rhoads, J. E., et al. 2016, ApJS, 226, 23
- Zheng et al. (2010) Zheng, Z. Y., Wang, J. X., Finkelstein, S. L., et al. 2010, ApJ, 718, 52
- Zheng et al. (2017) Zheng, Z.-Y., Wang, J., Rhoads, J., et al. 2017, ApJ, 842, L22