[O ii] nebular emission from Mg ii absorbers: Star formation associated with the absorbing gas
Abstract
We present nebular emission associated with 198 strong Mg ii absorbers at 0.35 1.1 in the fibre spectra of quasars from the Sloan Digital Sky Survey. Measured [O ii] luminosities (L) are typical of sub-L⋆ galaxies with derived star formation rate (uncorrected for fibre losses and dust reddening) in the range of 0.5-20 . Typically less than of the Mg ii systems with rest equivalent width, Å, show L L. The detection rate is found to increase with increasing and . No significant correlation is found between and L even when we restrict the samples to narrow -ranges. A strong correlation is seen between L and . While this is expected from the luminosity evolution of galaxies, we show finite fibre size plays a very crucial role in this correlation. The measured nebular line ratios (like [O iii]/[O ii] and [O iii]/H) and their evolution are consistent with those of galaxies detected in deep surveys. Based on the median stacked spectra, we infer the average metallicity (log Z 8.3), ionization parameter (log 7.5) and stellar mass (log (M/M⊙)9.3). The Mg ii systems with nebular emission typically have Å, Mg ii doublet ratio close to 1 and W(Fe ii2600)/ as often seen in damped Ly and 21-cm absorbers at these redshifts. This is the biggest reported sample of [O ii] emission from Mg ii absorbers at low impact parameters ideally suited for probing various feedback processes at play in galaxies.
keywords:
galaxies: evolution – galaxies: star formation - galaxies: ISM - quasars: absorption lines – cosmology:observations1 Introduction
Absorption line systems traced by Mg ii2796,2803 doublet in the quasar spectra provide a direct tracer of cool, , gas within gaseous haloes and circumgalactic medium (CGM) surrounding galaxies over a wide range of H i column densities, log [(H i) ] (Bergeron, 1986; Churchill et al., 2000; Rao & Turnshek, 2000; Rigby et al., 2002), out to projected distances of 200 kpc (e.g., Kacprzak et al., 2008; Chen et al., 2010a; Chen et al., 2010b; Bordoloi et al., 2011; Nielsen et al., 2013b). The paradigm developed thus far is that the Mg ii absorbers are linked with either of the galactic-scale outflows originating from their host galaxies (Bouché et al., 2006; Tremonti et al., 2007; Weiner et al., 2009; Martin & Bouché, 2009; Noterdaeme et al., 2010; Chelouche & Bowen, 2010; Rubin et al., 2010; Lundgren et al., 2012; Bordoloi et al., 2014), dynamical mergers or filamentary accretion on to galaxies (Steidel et al., 2002; Chen et al., 2010a; Kacprzak et al., 2010; Kacprzak et al., 2011, 2012; Martin et al., 2012; Rubin et al., 2012) and high velocity clouds [HVCs] (Richter, 2012; Herenz et al., 2013). Thus Mg ii absorbers may be tracing different feedback processes that control the evolution of their host galaxies.
In efforts to determine physical properties of galaxies associated with Mg ii absorbers (hereinafter Mg ii galaxies), the rest-frame equivalent width () of Mg ii absorption is found to be anticorrelated with impact parameter (), at 7.9 level (Bergeron & Boissé, 1991; Lanzetta & Bowen, 1990; Steidel, 1995; Churchill et al., 2000; Kacprzak et al., 2008; Chen et al., 2010a; Rao et al., 2011; Nielsen et al., 2013b; Kacprzak et al., 2013). This has led to the suggestions that the Mg ii absorption could originate from the extended halos of normal galaxies with unit covering factor for the absorbing gas (see e.g., Petitjean & Bergeron, 1990; Srianand & Khare, 1994). Recent studies suggest that the scatter in the versus relationship could be further reduced if luminosity dependent radial extent of the gas is also taken into account (Chen et al., 2010a; Nielsen et al., 2013b). On the contrary, search for Mg ii absorption from galaxies close to the QSO line-of-sight suggested that the gas covering factor is less than unity (Tripp et al., 2005; Barton & Cooke, 2009). The Mg ii gas distribution may be patchy around galaxies with the gas covering factor decreasing with the increasing impact parameter (Chen et al., 2010a; Nielsen et al., 2013b). While luminous galaxies are frequently identified at the redshift of the Mg ii absorption, question remains that what fraction of these systems are produced by undetected low luminosity galaxies at much smaller impact parameters (see figure 10 of Noterdaeme et al., 2010).
The fibre fed spectroscopic observations, e.g., 3 and 2 arcsec diameter fibres employed in Sloan Digital Sky Survey Data Release 7 (SDSSDR7; Abazajian et al. 2009) and SDSSDR12 (BOSS, Alam et al., 2015), register photons from all the objects that happen to fall within the fibre along our line-of-sight. This in principle allows detection of nebular emission associated with the absorbing gas (Wild et al., 2007; Noterdaeme et al., 2010; Borthakur et al., 2010; York et al., 2012; Straka et al., 2015). Noterdaeme et al. (2010) have performed an absorption-blind search, i.e. without a prior information on absorption, of nebular emission features (e.g., [O ii], [O iii] and H ) and detected 46 [O iii] emitting galaxies at on top of the quasar spectra (hereinafter refer to as GOTOQs), out of which 17 are Mg ii absorbers at . The [O iii] luminosities of these systems are found to be less than that of an L⋆ galaxy with a median luminosity of 0.2 L and a typical star formation rate (SFR) in the range of 0.2-20 . Straka et al. (2015) have subsequently increased the number of known GOTOQs to 103 at a median of 0.15.
A strong correlation is found between the [O ii] luminosity surface density () and in the stacked spectra (Noterdaeme et al., 2010; Ménard et al., 2011). This relationship is also found to be evolving with redshift in the sense that a given seems to be associated with larger at high- compared to that at low-. Ménard et al. (2011) have suggested that the Mg ii absorbers can in principle provide a new probe of the redshift evolution of the star formation rate density in a luminosity unbiased manner (however, see López & Chen, 2012). Increasing the number of direct detections over a large redshift range will allow us to address this more efficiently. With an aim to probe the nature of Mg ii absorbers we have searched for the nebular emission from Mg ii absorption systems by utilizing the unprecedented number of these systems found in the SDSS survey (Zhu & Ménard, 2013). These direct detections will not only provide the largest sample to study Mg iigalaxy correlation at low impact parameters over a large redshift range but also help us understand the origin of L versus correlation seen in the stacked spectra and its redshift dependence so that the utility of Mg ii absorbers as a new tracer of star formation in the Universe can be examined.
This article is organized as follows. Section 2 describes our sample selection criteria and procedure for detecting the nebular emission lines. In Section 3, using the repeat observations of QSOs in SDSS-DR7 and SDSS-DR12 we examine the effect of fibre size on the nebular emission line detections. In Section 4, we present the absorption line properties of systems detected in nebular emission, the detection probability of nebular emission in Mg ii systems, and discuss the dependence of [O ii] line luminosity on and . In this section details of observed nebular line ratio and their redshift evolution are also discussed. We also compare the properties derived based on nebular emission with those based on absorption lines. The summary of our study is presented in Section 5. Throughout, we have assumed the flat Universe with 70 km s-1 , and .
| Catalog | z | Na | [O ii] + [O iii]b | [O ii]c | [O iii]d |
|---|---|---|---|---|---|
| SDSS-DR7 | 11523 | 29 | 33 | 6 | |
| SDSS-DR12 | 37038 | 76 | 47 | 7 |
a Total number of Mg ii absorbers within the desired range.
b [O ii] is detected at and [O iii] is detected at
c [O ii] is detected at and upper limits on [O iii].
d upper limits on [O ii] and [O iii] is detected at
2 Sample
In this work, we use the compilation of Mg ii systems from the expanded-version of JHU-SDSS Metal Absorption Line Catalog111http://www.pha.jhu.edu/gz323/Site/ (Zhu & Ménard, 2013), generated from the SDSSDR7 and SDSSDR12. In order to detect the nebular emission line features from the Mg ii absorbers, first we have ensured that the most prominent [O ii] and [O iii] emission lines are covered within the observed wavelength range of SDSS-DR7 (3800 Å9200 Å) and SDSS-DR12 (3650 Å10,400 Å) spectra. This criterion limits the redshift range over which [O ii] emission can be searched to and for SDSS-DR7 and SDSS-DR12 spectra respectively. This resulted in our primary sample of 11,000 and 37,000 Mg ii absorbers with Mg ii equivalent width () Å in SDSS-DR7 and DR12 catalog respectively, where we have searched for the nebular emission lines.
2.1 Search for nebular emission
For the redshift range of interest for the present study, the [O ii]3727,3729 emission doublet is the strongest and most suitable nebular line that can be detected over a wide range in a region free from the most crowded telluric lines (e.g., O i, O i, and OH lines). Also [O ii] is regarded as a good indicator of the ongoing star formation rate (SFR). For each Mg ii absorber, we search for the [O ii]3727,3729 nebular emission lines at the expected location for in the continuum subtracted spectrum. At first, we model the local continuum that includes the continuum light from both the quasar and the galaxy by a low-order (typically a third order) polynomial fit. The significance of the detection of an emission line feature is determined based on the signal-to-noise ratio [] (see, Hewett et al., 1985; Bolton et al., 2004) defined as:
| (1) |
here, is the line flux in th pixel, is the flux error and is a Gaussian kernel, normalized such that , and its position and width given by the fitted line parameters. Any feature at the expected location of the [O ii] line with is considered as a positive detection in this work.
|
|
|
|
|
|
|
|
|
|
|
|
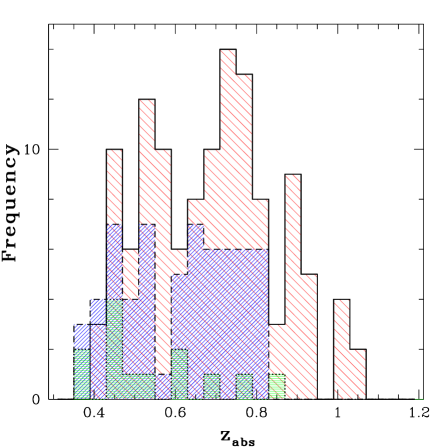
However, identifications solely based on single emission line (i.e., blended [O ii]3727,3729 lines) alone may lead to a high probability of false positives if the expected wavelength range is affected by (1) poor sky subtraction in the locations of strong sky lines and/or (2) a bad continuum fit around the broad and narrow emission lines of the background quasar. Therefore, to avoid such cases we have masked the regions around strong sky lines as well as narrow and broad emission lines from QSOs. In addition, any feature with a full width at half maximum (FWHM) less than the SDSS spectral resolution ( km s-1) are manually checked and then removed if found to be spurious. We detect [O ii] emission from 185 Mg ii systems in the redshift range at level. Among them, 62 are detected in SDSS-DR7 (with a fibre diameter of 3 arcsec) and remaining 123 are detected in SDSS-DR12 (with a fibre diameter of 2 arcsec) spectra. From these [O ii] detected systems, we also searched for the other emission features such as H4862 and [O iii]4959,5007. Among 62 systems detected in SDSS-DR7, we found 29 systems showing [O iii]5007 and 13 systems showing H detected at . In addition, among 123 systems detected in SDSS-DR12, we found 76 systems showing [O iii]5007 and 46 systems showing H detected at . The distributions of Mg ii systems with the nebular [O ii] emission detected in SDSS-DR7 and SDSS-DR12 are shown in Fig. 1 .
In the general population of galaxies a small fraction (i.e 8 per cent) show the [O iii] emission being stronger than [O ii]. The nebular line selection based purely on [O ii] may miss such systems. In order to account for such systems we searched for [O iii] emission from Mg ii absorbers that do not show strong [O ii] emission (i.e at more than 4 level). We found 13 Mg ii systems where [O iii]4959,5007 emission is clearly detected at level while [O ii]3727,3729 emission is not detected at the significant level demanded above (i.e., ). Thus in total we have detected nebular emission lines from 198 Mg ii absorption systems.
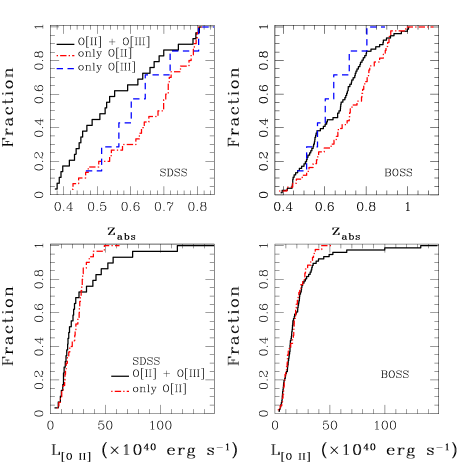
In Fig. 2 (top panel), we compare the redshift distribution of the Mg ii systems with clear detection of both [O ii] and [O iii] emission versus the systems with only [O ii] detection. This figure (top panels) also shows the distribution of 13 [O iii] detected systems with weak [O ii]. It is clear from the figure that systems with only [O ii] detection are preferentially at high redshift. A two-sided Kolmogorov-Smirnov test (test) shows that the two redshift distributions (i.e., with both [O ii], [O iii] detections and only [O ii] detections) are different with a null probabilities of being drawn from same parent distribution 0.03 and 0.04 for the systems detected in SDSS-DR7 and SDSS-DR12, respectively. We find that the [O ii] luminosity (total luminosity of two [O ii] lines) for these two subsets are similar (see bottom panels of Fig. 2) with null probability of 0.42, 0.62 for the SDSS-DR7 and SDSS-DR12, respectively. The redshift distribution of [O iii] detected systems are also different, preferentially at low-. These differences could either mean (i) some observational bias against detecting [O iii] emission from high- galaxies, for example the poor sky residuals or (ii) a redshift evolution in the [O iii]/[O ii] ratio. We come back to this is Section 4.6. The details of our sample are summarized in Table 2. The final list of systems with nebular emission is available in the online table. In all cases where we do not have nebular line (i.e., one of [O iii], H or [O ii]) detections we have estimate the upper limit by assuming the FWHM of the line that is detected.
| No | QSO | plate | mjd | fibre | zqso | zabs | L | L | LHβ | |
|---|---|---|---|---|---|---|---|---|---|---|
| () | (Å) | |||||||||
| 1 | BOSS-J | 6113 | 56219 | 602 | 2.6470 | 0.6804 | 21.69 2.21 | 14.78 2.78 | 10.96 2.11 | 2.920.17 |
| 2 | BOSS-J | 6198 | 56211 | 086 | 2.6090 | 0.7142 | 22.03 2.76 | 16.76 2.66 | 2.770.61 | |
| 3 | SDSS-J | 0701 | 52179 | 087 | 1.7210 | 0.7253 | 26.10 7.53 | 2.10 0.51 | ||
| 4 | SDSS-J | 0408 | 51821 | 237 | 0.9806 | 0.6448 | 17.16 4.86 | 1.26 0.40 | ||
| 5 | SDSS-J | 0459 | 51924 | 309 | 0.7543 | 0.6986 | 28.81 4.00 | 45.09 8.49 | 2.34 0.27 | |
| 6 | SDSS-J | 1920 | 53314 | 217 | 0.9321 | 0.6651 | 21.86 4.20 | 2.07 0.26 | ||
| 7 | SDSS-J | 0439 | 51877 | 554 | 0.8907 | 0.6702 | 20.42 3.92 | 0.92 0.09 | ||
| 8 | SDSS-J | 1270 | 52991 | 266 | 1.0903 | 0.6370 | 35.03 8.22 | 0.95 0.12 | ||
| 9 | SDSS-J | 1299 | 52972 | 333 | 0.6635 | 0.3767 | 5.56 1.74 | 2.82 0.88 | 1.75 0.15 | |
| 10 | SDSS-J | 0449 | 51900 | 145 | 1.1859 | 0.7886 | 42.37 9.69 | 1.77 0.08 | ||
a The full table is available online.
b upper limit.
Note that, our compilation of 198 Mg ii systems, seen in emission, is the largest sample of Mg ii galaxies known till date. Based on previous attempts to study the galaxies associated with Mg ii absorbers only 182 spectroscopically identified intermediate redshift () galaxies at impact parameters of kpc are known (see the compilation of Nielsen et al. (2013a, and reference therein). In particular, the Mg ii systems with nebular emission in our compilation probe very low impact parameters (i.e. kpc). In the literature only 6 galaxies associated with Mg ii absorbers are known at such impact parameters. In addition, nebular emission from 17 Mg ii systems are identified by Noterdaeme et al. (2010) in the SDSS fibre spectra. Eight of these systems are part of our sample.
2.2 Emission line parameters
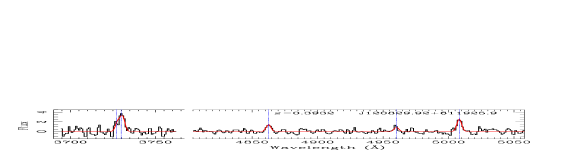
We determine the emission line parameters by fitting the [O ii]3727,3729, H4862 and [O iii]4959,5007, emission lines with Gaussian profiles. We fit all detected lines simultaneously by using a single emission redshift within a velocity offset of km s-1 with respect to the absorption redshift as typically seen in GOTOQs (see, Noterdaeme et al., 2010). In the low resolution SDSS spectrum the two [O ii]3727,3729 lines are unresolved. We model the observed [O ii] emission with a double Gaussian profile with a tied linewidth but freely varying the line ratio in a range of 3.4-1.5222The [O II] intensity ratio in the range 3.4-1.5 is predicted in photoionization models for the electron density in the range for the kinetic temperature (Osterbrock & Ferland, 2006).. This allows for probing the typical range in the electron density of the gas under photoionization equilibrium. The H and [O iii]4959,5007 emission lines are modelled with a single Gaussian each. The integrated line intensities of [O ii]3727,3729, [O iii]4959,5007 and H are then measured from the fitted Gaussian parameters.
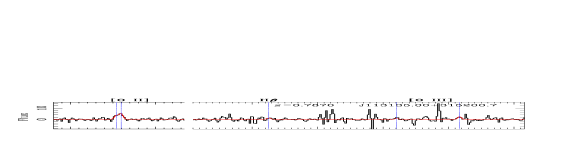
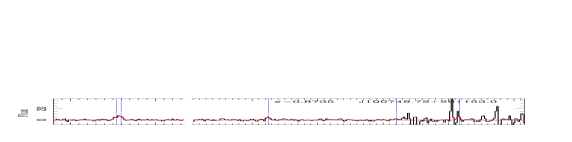
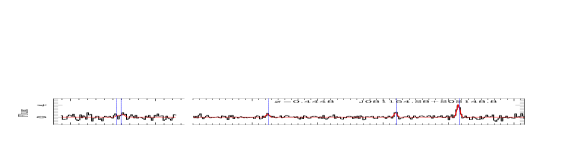
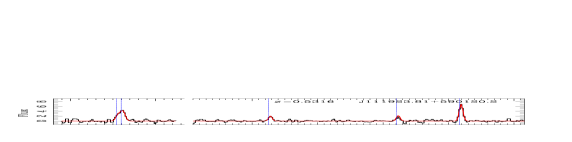
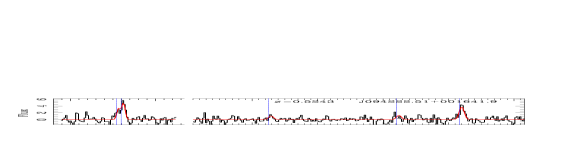
In Fig. 3, we present few examples of the nebular emission line spectra of Mg ii systems in our sample along with the results of our best fit Gaussian profiles. The lower three panels show examples of clear detections of [O ii], H and [O iii] emission lines. In upper two panels we show examples where [O ii] is clearly detected whereas the [O iii] region is affected by the night sky emission. In addition, third panel from the top shows an example of GOTOQ system where [O iii] emission is clearly seen without a clear detection of the [O ii] line.
3 fibre size effect
Our sample of Mg ii systems that show nebular emission lines spans a substantial redshift interval, ranging from 0.4 to 1.1. In this range, the fibre with an aperture of 3 arcsec, used in SDSS-DR7 spectra, corresponds to a projected radius (i.e., an upper limit on the impact parameter) of . Similarly, the 2 arcsec fibre used in SDSS-DR12 corresponds to a radius of . Before performing different statistical analysis it is important for us to understand various possible biases introduced by the finite size of fibres used. For this we used the repeated spectroscopic observations of quasars in SDSS-DR7 and SDSS-DR12. Including the GOTOQs listed in Straka et al. (2015) we have found 39 cases with repeat observations using fibre of two different sizes.
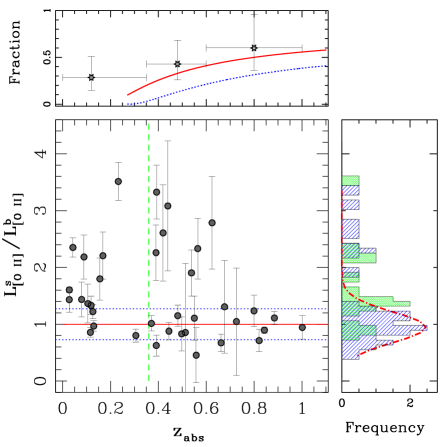
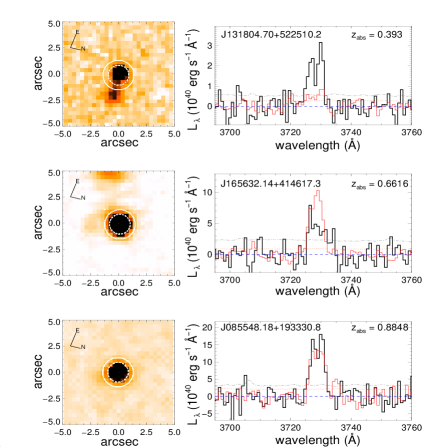
In Fig. 4, we compare the ratio of [O ii] luminosities measured between SDSS-DR7 (i.e., L) and SDSS-DR12 (i.e., L) fibre spectra as a function of the absorber redshift. For this comparison, we consider only systems where the nebular emission line is clearly detected at least in one epoch spectrum. As expected the measured luminosities in the SDSS-DR7 spectra are higher than those of SDSS-DR12 spectra in several cases. Contrary to our expectation 18% of Mg ii systems at show slightly larger luminosity in the SDSS-DR12 spectrum albeit within level. This is possible when there are issues related to centering of the quasars in the fibre during spectroscopic observations or effect of varied seeing between two epochs. In addition, there could also be issues related to flux scales, where SDSS-DR12 spectra tend to show excess flux in the blue. We consider the scatter in [O ii] luminosity ratio as the level at which we can not quantify the flux difference over the redshift range of our interest (i.e., ), shown as dotted lines in Fig 4. It is interesting to note that the fluxes in the SDSS-DR12 and SDSS-DR7 agree within the 1 uncertainty in most of the cases. It is clear from Fig. 4 that the fibre size effect is severe at low-. Considering the uncertainty, the fraction of systems with similar fluxes in SDSS-DR7 and DR12 is found to be 8%, 42% and 50% for the three redshift range of , and (see top panel of Fig. 4). In Fig. 5, we show three examples demonstrating the fibre size effect where the [O ii] luminosity seen in SDSS-DR7 (thick solid line) spectrum is found to be larger (top panel), smaller (middle panel) and similar (bottom panel) to those measured in the SDSS-DR12 (thin solid line) spectrum.
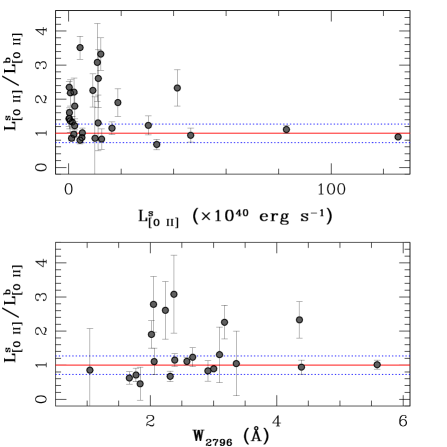
Next, in Fig. 6 we plot the [O ii] luminosity ratio (i.e., L/L) against the L measured in SDSS-DR7 spectra, i.e., L, and . It is clear from the top panel of Fig. 6 that a large scatter in L/L is preferentially present for systems with low L. It is quite possible that the line emitting region is partially covered by the fibre which leads to the lower L. This figure also demonstrates that the observed [O ii] luminosity in the SDSS-DR12 spectra could be underestimated by up to a factor of 3 due to fibre size effects.
Recently, Paulino-Afonso et al. (2017) have found the effective radius () of H selected galaxies (relevant for the present study) shows a mild decrease over increasing . They measured a median size of kpc at . If we assume this size for the nebular line emitting regions studied here then at all [O ii] luminosity from the galaxies within will be observed only when kpc and kpc in the case of SDSS-DR7 and SDSS-DR12, respectively. Therefore, if we assume of our detections to be uniformly distributed within the fibre then only in and cases we expect fibre loss to be negligible in the case of SDSS-DR7 and SDSS-DR12 spectra respectively at . However, at the median kpc. In this case we will detect full [O ii] nebular emission in cases for SDSS-DR7 and cases for SDSS-DR12. The probability of Mg ii galaxy in our sample not suffering the fibre loss, measured as ((, as a function of for SDSS-DR7 (solid curve) and SDSS-DR12 (dotted curve), are shown in the top panel of Fig. 4. Here, is the projected radius of the fibre at the redshift of the Mg ii systems. We consider this as an upper limit as a detection can occur even when the impact parameter is slightly larger than the fibre (i.e. when ). It is clear from the above discussions that our measurements of nebular line luminosities are affected by fibre size effects and this effect has a clear redshift dependence.
4 RESULTS
In what follows we study the emission line properties of Mg ii absorbers and compare these with the properties derived using absorption lines.
4.1 Absorption line properties:
In order to see the fibre size effect on the absorption line properties, we first compare , Mg ii doublet ratio () and (defined as ) of the Mg ii absorbers with [O ii] detections in SDSS-DR7 and DR12 data set. Naively we would have expected the average to be slightly lower in the case of SDSS-DR7 as it also could have sightlines with slightly larger impact parameters due to larger fibre size. A two-sided Kolmogorov-Smirnov test finds no difference between the two subsets based on , and parameters with a null probability of being drawn from same parent distribution of , respectively. The lack of any significant difference can be attributed to the flattening of vs and possible scatter in this relationship. We come back to this in Section 4.8.
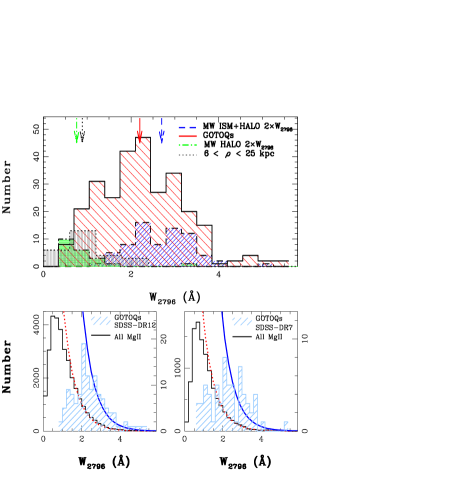
Next, we compare the distribution of and of the Mg ii systems with and without detection of the nebular emission lines. At first, we found that all but 8 Mg ii systems detected in emission (both in DR7 and DR12) have Å, with mean of 2.3 Å and 2.4 Å for the SDSS-DR7 and SDSS-DR12, respectively. In Fig. 7 (lower panel), we show the distribution of from the Mg ii systems with detected nebular emission line with the overall Mg ii absorbers in our primary sample. It is clear from the figure that Mg ii systems with nebular emission are predominantly distributed towards higher .
Using deep imaging of 7 Mg ii systems with [O ii] nebular emission at with kpc Kacprzak et al. (2013) have argued that these systems are consistent with distribution of the Milky Way (MW) interstellar medium (ISM) and ISM+Halo. Following their approach, in the top panel of Fig. 7, we compare the distribution of systems with nebular emission in our sample with those measured from different components of MW. For this, we use 71 Mg ii absorption lines produced by MW (ISM+halo gas) and 21 systems as halo gas identified along the sightlines of 83 quasars, observed in Hubble Space Telescope Quasar Absorption Line Key Project (Bahcall et al., 1993), by Savage et al. (2000). The distribution for the Mg ii systems with [O ii] emission, MW(ISM+halo) and MW(halo gas) is shown in the upper panel of Fig. 7. In view of the fact that MW sightlines pass halfway through the disk/halo we have applied a correction factor of two in the for MW systems (Kacprzak et al., 2013). This figure clearly indicates that for a large fraction of Mg ii systems with [O ii] emission the Mg ii absorption tend to be strong and their distribution is closer to what has been seen for MW (ISM+halo). A simple two parameter test confirms this.
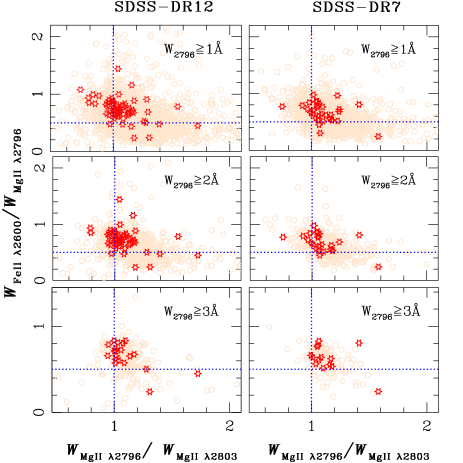
Using a photoionization modelling Srianand (1996) has shown that the Mg ii absorbers with trace systems with high (H i), preferentially the Damped Ly absorbers (DLAs) (see also, Rao et al., 2006; Gupta et al., 2012; Dutta et al., 2017). Furthermore, Rao et al. (2006) have shown that the fraction of Mg ii systems that are DLAs increases with the . In order to find if the Mg ii absorbers that show nebular line emission occupy any preferred location in the parameter space defined by the equivalent width ratios of metal absorption, we plot the versus in Fig. 8, for systems with and without nebular emission detection over various bins (i.e., and 3 Å). It is clear from the figure that among the strong Mg ii absorbers the systems showing nebular emission are preferentially having a small , close to unity, and the parameter greater than 0.5, plotted as dotted horizontal line. These differences were also confirmed when we do the statistics.
Interestingly, Rao et al. (2006) have shown that the success rate of identifying DLAs can be enhanced if one puts additional constraints based on other metal lines, e.g., and (Mg i) Å. In recent efforts to detect cold gas in strong Mg ii systems, by using H i 21-cm absorption, it has been found that the detection rate of H i 21-cm absorption is about four times higher in systems with strong Fe ii at (see, Gupta et al., 2012; Dutta et al., 2017). For the average (i.e. Å) seen in our sample, the probability of Mg ii system being DLA is found to be % Rao et al. (2017, see their figure 2). In addition, the (H i) versus relation by Ménard & Chelouche (2009) show that the GOTOQs belongs to the sub-DLA systems with log (H i) of 20.1, albeit having a large scatter in (H i) up to about 3 orders of magnitude. Therefore, a good fraction of our systems will be DLAs.
4.2 Detection probability of nebular emission lines in strong Mg ii systems
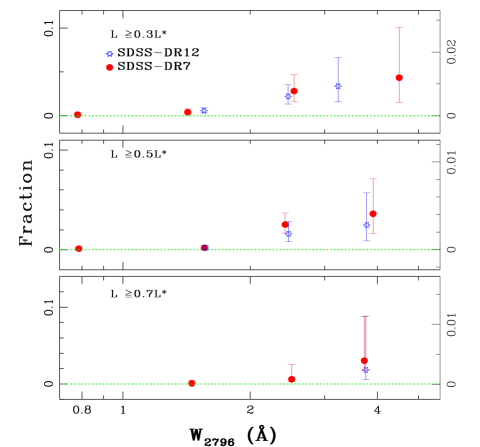
The detection of the nebular emission from the Mg ii systems not only depends on the emission line flux but also on (i) the flux of the background quasar, (ii) the dust attenuation of emission-lines in the host galaxy and (iii) the bias due to fibre size effects, as discussed above. Here, we compute the fraction of [O ii] nebular emission line detections as a function of in the SDSS fibre spectra centered around distant quasar which are detected above the luminosity threshold of 0.3, 0.5 and 0.7 L. For this, we restrict ourselves to a common redshift range of in SDSS-DR7 and DR12 and consider the log L () = 41.6 at the average redshift of (Comparat et al., 2016). First, we find the number of sightlines suitable for detecting the [O ii] line with a given luminosity threshold at level by integrating the error spectra across the expected location of [O ii] doublet, typically comprises of 12 pixels. Further, the fraction of systems is computed as a ratio between the number of Mg ii systems with [O ii] emission above a given luminosity threshold to the total number of Mg ii systems for which such a line is detectable.
In Fig. 9 we show the detection probability of [O ii] emission line as a function of for the luminosity threshold of 0.3 (top panel), 0.5 (middle panel) and 0.7 times (bottom panel) L. It is apparent from the figure that the detection probability of nebular emission lines increases with the strength of the . The fraction of Mg ii systems detected in emission for various luminosity thresholds (in column 1) are listed in the column 2 and 3 of Table 3. It is also clear from the table that the fractional detection of [O ii] in Mg ii systems is higher for the low luminosity threshold. Last column in Table 3, gives the expected detection rate in the case of SDSS-DR12 if one scales the detection rate in SDSS-DR7 by the ratio of projected fibre areas. This is much higher than the actual rate we find for SDSS-DR12. The difference can be reduced if we consider the nebular line emitting regions to be extended and the fibre size does affects the observed luminosity as we discussed in Section 3.
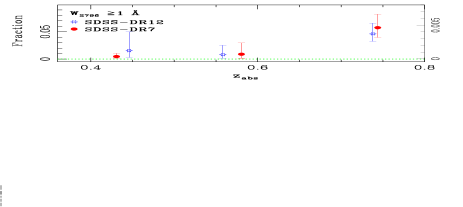
Furthermore, in Fig. 10 we show the detection probability of nebular emission from strong ( Å) Mg ii systems as a function of redshift for a luminosity threshold of 0.3 L. A rise in the detection probability of nebular emission as a function of redshift is clearly seen. This is expected from the increasing projected area of fibre with which leads to high probability for the line emitting regions to come inside the fibre. Interestingly, in an effort to model the effect of finite fibre size López & Chen (2012) have shown that the fraction of systems for which the absorbing galaxy will give rise to [O ii] emission in QSO spectra increases as a function of and will depend on the fibre size. They showed that the detection fraction increases from 50% for Å to 90% for Å when no limiting flux condition is applied. This is what one expects based on the known versus anti-correlation. While what we observe is consistent with the trend presented by López & Chen (2012) the actual detection fraction we find is much less than their model prediction because of the high luminosity threshold (i.e., 0.3L) imposed in our study. Here, we also find, for a given luminosity threshold, the [O ii] detection rate in Mg ii systems is higher in the SDSS-DR7 spectra than in the SDSS-DR12 spectra (see Fig. 9).
| Criteria | SDSS-DR7 | SDSS-DR12 | expected fraction |
|---|---|---|---|
| L | |||
| L | |||
| L |
Here, we use L⋆ .
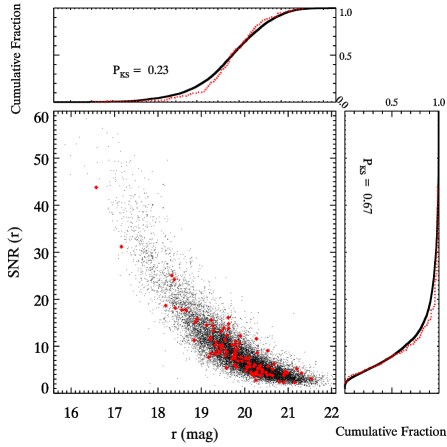
In Fig. 11, we compare the median measured over all pixels in the -band to the QSO -band magnitude for all the QSO spectra from SDSS-DR12 searched here for the nebular emission and hosting a Mg ii system with Å. A does not show any statistical difference between the -band magnitude distributions of the two populations with . In addition, no difference is seen between the of the two population with . Thus it appears that that the quasar brightness does not impact the detectability of [O ii] nebular emission for systems with Å (see also, Noterdaeme et al., 2010).
4.3 The [O ii]3727,3729 luminosity:
Results presented in the last two sections suggest, (1) our measured [O ii] nebular line luminosity is an underestimation of true luminosity, (2) this bias depends on redshift, and (3) the probability of [O ii] detection in Mg ii systems increases with and . Keeping these in mind in what follows we study different properties of our Mg ii systems with [O ii] nebular emission.
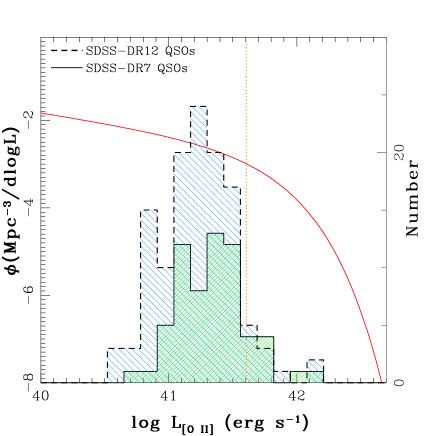
In Fig. 12 we compare the distribution of measured [O ii] luminosity of Mg ii absorbers detected in SDSS-DR7 and SDSS-DR12 spectra with the [O ii] luminosity functions of galaxies at from Comparat et al. (2016). Note that, our measured luminosities could very well be lower limits as we do not apply any correction for the dust reddening and the emission line fluxes are affected by fibre losses. Our measured [O ii] nebular line luminosities are in the range of L and L in case of SDSS-DR7 and SDSS-DR12 respectively. Therefore, the total luminosity of these Mg ii absorbers are typically higher than L.
Based on the [O ii] luminosity we derive the SFR using prescription given by Kennicutt (1998) :
| (2) |
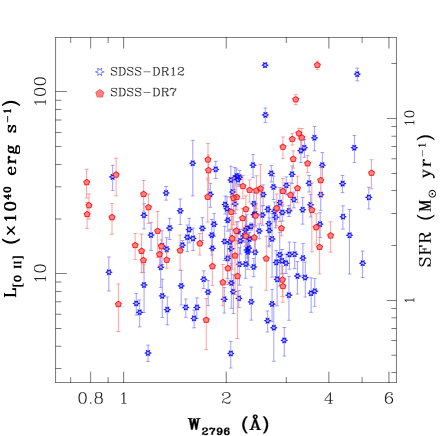
In Fig. 13 we plot L versus and show the SFR for individual absorbers in the left side ordinate. Bouché et al. (2007) found 67% of galaxies associated to the Mg ii absorbers with Å have SFR in the range at based on the H emission having impact parameter in the range kpc. We note that about % Mg ii systems in our sample have Å and SFR . This percentage should be considered as a lower limit as our flux measurements are affected by fibre size effects discussed above.
4.4 L versus correlation ?
In this section, using our direct detections we investigate the origin of the strong correlation seen between and associated [O ii] luminosity seen in the stacking analysis of Mg ii absorbers (Noterdaeme et al., 2010; Ménard et al., 2011). It is important to note that the same fibre size bias affects both these measurements. In Fig 13, first we compare the L as a function of from our direct detections. It is clearly visible that for a given the L has a wide spread. We have performed the Spearman rank correlation test between L and and found the correlation coefficient for the Mg ii absorbers in SDSS-DR7 fibre spectrum to be with probability of null correlation (a correlation significant at ). We find similar results for our SDSS-DR12 sample also. Therefore, only a moderately significant correlation is present between L and when we consider individual detections. In addition, lack of correlation is confirmed using survival analysis when we include all the Mg ii absorbers from our sample with [O ii] non-detections as upper limits.
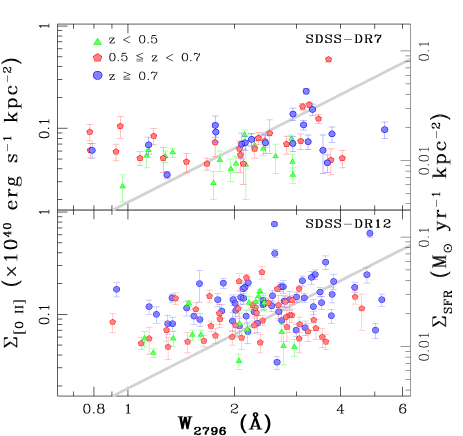

Note in Noterdaeme et al. (2010) and Ménard et al. (2011) a correlation is found between luminosity per unit area () and . It was argued that the fibre effects can be taken care of by normalizing the observed line luminosity by the projected area of the fibre. To compare with this finding, in Fig. 14 we show the dependence of surface brightness of [O ii] emission (denoted by ) as a function of . For plots in the left panel we assume the surface area to be that of the fibre and for the plot in the right panel we assume area to be the average effective area of the galaxies at the corresponding absorber redshift. In this figure we also show the relationship found by Ménard et al. (2011). The surface star formation rate (sfr) derived from are also indicated in the right ordinates of both the panels. It is clear that our direct detections do not follow the trend seen in the stacked spectra. A simple correlation analysis suggests that the correlation could at best be at the level of . A similar dependence is seen when we compare the with , obtained by considering the area of the galaxies at the corresponding absorber redshift. As discussed in Section 3, the observed luminosity can be affected by the fibre size effects that are also redshift dependent.
To see if the above found mild correlation is driven by or not, we divide the sample into three redshift bins of and , and 0.7. It is clear from the figure that for a given , systems at high redshift show the higher . However, no clear trend is evident in the individual redshift bins between and in both SDSS-DR7 and SDSS-DR12 samples.
In summary, we conclude that among direct detections there is no statistically significant correlation between and L when we restrict ourselves to small redshift intervals. This conclusion is valid for the calculated under both the assumptions mentioned above. From the discussion presented in Section 4.2 we find that the fraction of Mg ii absorber showing such nebular emission increases with increasing . Therefore, more systems with weaker or no nebular emission have contributed to the stacking at low compare to those at higher . This could explain the strong correlation found between L and in the stacked spectra.
4.5 L versus
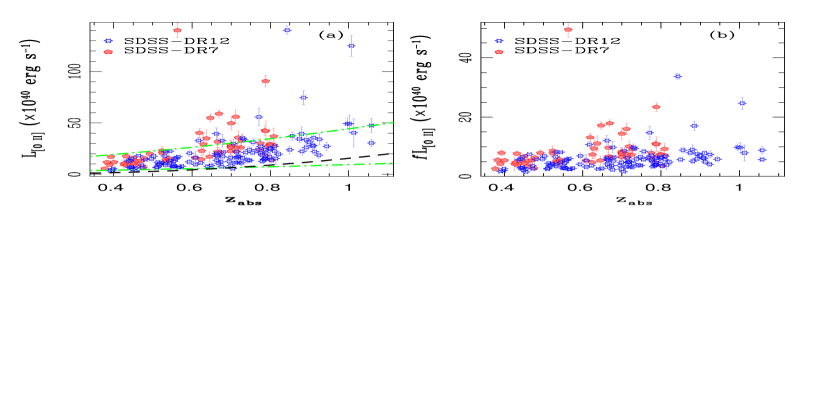
We now explore the redshift dependence of L associated with our Mg ii absorbers. In panel (a) of Fig. 15 we see a clear increasing trend of L with . The Spearman rank correlations test finds a strong correlation, with and between L and with a null probability of (significant at 5.7) and (significant at 8.1 ), respectively. This could be a real redshift evolution of the [O ii] luminosity; or some observational artifact due to (i) luminosity bias for a given flux threshold as a function of (as discussed in Section 3); (ii) the constant fibre size corresponding to more projected area at high . We explore these one by one.
In Panel (a) of Fig. 15, the dashed line shows the expected luminosity for the observed flux of , corresponding to the minimum luminosity seen in our sample at . This line provides a nice lower envelope to the observed luminosity at . In the same panel the dot-dashed lines show the expected luminosity of 0.15 and 0.7L as a function of using the redshift evolution of field galaxies luminosity function of Comparat et al. (2016, see their Table 7). While this luminosity range encompasses the observe luminosity at (barring one system), at high there are much more galaxies brighter than the 0.7L galaxies. As discussed in Section 3, lower the redshift higher will be reduction in the measured luminosity compared to the actual luminosity due to fibre effects. Thus, the dominant factor for this L- relationship explored in the plots could be the redshift dependence of the fiber losses. In addition, the lack of low luminosity detections at high- is probably biased due to the observing strategy in SDSS-DR12 where to maximize the flux in the blue part an offset was applied to the position of the quasar target fibres to compensate for atmospheric refraction (see also Pâris et al., 2012).
We can account for the relative increase in characteristic luminosity of galaxies as a function of by scaling down the observed L by a factor L()/L() (Comparat et al., 2016). The scaled luminosity is shown in the panel (b) of Fig. 15. The Spearman rank correlation test finds a correlation with and between L and with a null probability of (significant at 3.6) and (significant at 5.3), respectively. This indicates that the above correlation is not dominated mainly by the redshift evolution of luminosity. This once again confirms that the fibre size effect is a dominant effect.
In summary, as shown by the field galaxies, [O ii] luminosity of our Mg ii absorbers are higher at higher . The correlation remains even after we account for redshift evolution of L. Therefore, we conclude that the strong correlation seen between L and seen in our sample (as well as stacked spectra in the literature) is influenced substantially by the redshift dependent fibre losses.
4.6 [O iii]/[O ii] and [O iii]/H nebular line ratio :
The [O iii]/[O ii] and [O iii]/H ratios are sensitive to the hardness of the ionizing radiation field, and serves as a ionization parameter diagnostic of a galaxy (Baldwin et al., 1981; Kewley et al., 2001). A rise in ratios of nebular emission lines, in particular [O iii]/[O ii] and [O iii]/H, of star-forming galaxies is seen over the redshift range (see Nakajima & Ouchi, 2014; Steidel et al., 2014; Kewley et al., 2015; Khostovan et al., 2016). This implies that typical galaxies at high redshifts have higher ionization parameter, lower metallicity, harder stellar ionizing radiation field and higher electron densities compare to those of local galaxies. The direct detection of nebular emission lines from Mg ii absorbers allows us to explore their physical conditions. We assume that the nebular line ratios do not depend on the fibre size used in the SDSS-DR7 and SDSS-DR12 spectra. Therefore, while studying the emission line ratios we have combined the SDSS-DR7 and SDSS-DR12 sample of Mg ii absorbers with nebular emission.
| redshift() | systems | log ([O iii]/[O ii]) | log ([O iii]/H) | log () | log () |
|---|---|---|---|---|---|
| 79 | |||||
| 34 | |||||
| 42 |
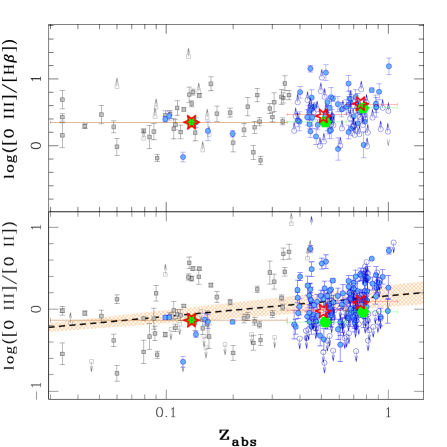
First, we explore the dependence of [O iii]/[O ii] and [O iii]/H nebular line ratios with redshift (see Fig. 16). While computing the line ratios for cases where the [O iii] or H line is not detected we use the upper limits. In addition, we have excluded systems for which both the lines are not detected. In Fig. 16 the limits are shown as (arrows) and the detections () are shown with circles. For a subset of galaxies with firm detections we detect a significant correlation between the [O iii]/[O ii] line ratio with , with a Kendall’s rank correlation coefficient () of 0.3 with null probability which is significant at level assuming Gaussian statistics. A similar correlation is seen for our entire sample with =0.2 and null probability where we include the upper limits as censored data points and perform survival analysis using the ‘cenken’ function in the ‘nada’ package of r . This suggests that the of redshift evolution of nebular line ratio in [O ii] detected Mg ii systems follows the trend shown by the field galaxies. However, we do not find any correlation between [O iii]/H line ratio and with and for the entire sample as well for the clear detections.
Next, we compute the average line ratio using the composite spectrum obtained for the systems with [O ii] detections in SDSS-DR12. To generate the composite spectrum, an individual spectrum is shifted to the rest-frame of the Mg ii absorber while conserving the flux and rebinning on to a same logarithmic scale of a pixel to wavelength used in the SDSS (Bolton et al., 2012). Each spectrum is subtracted with the best-fit principle component analysis (PCA) continuum model of Bolton et al. (2012) and the residual spectra is combined together using a median statistics (see also, Joshi et al., 2017). Note that, for most of the Mg ii systems detected in emission, with redshift range of , the [O iii] and H lines fall in the region affected by poorly subtracted sky emission lines. Therefore, to avoid any contamination from sky residuals we have generated two sets of composite spectra by considering the entire sample with upper limits and another with excluding the systems with upper limits for [O iii]. We divide our sample into two redshift bins of and , consists of about 49 and 74 galaxies per bin in the composite spectra including upper limits. The number of galaxies over the above -bins reduces to 34 and 42 respectively if we consider the systems with only clear detections.
The nebular emission line ratio for [O iii]/[O ii] and [O iii]/H in a stacked spectrum of the systems with clear detections, over various redshift bins are listed in column 3 and 4 of Table 4. In the stacked spectra of our entire sample the log ([O iii]/[O ii]) is found to be evolving from to , by 0.07 dex over the redshift range of . In addition, a clear increasing trend of [O iii]/[O ii] with is apparent in the stacked spectra where all the emission lines are clearly detected (see Fig. 16, lower left panel). We find a change of 0.06 dex in [O iii]/[O ii] which increases from to between the median redshift of 0.52 and 0.76. Using the star-forming galaxies from High- Emission Line Survey (HiZELS), Khostovan et al. (2016) have shown that the [O iii]/[O ii] evolves out to 5 and is best described by a power law of the form, [O iii]/[O ii] (see their eq. 6). It also shows a similar change of 0.07 dex in [O iii]/[O ii] line ratio for the above redshifts. In addition, we measure the [O iii]/[O ii] and [O iii]/H ratio in a composite spectrum of low- (i.e., ) galaxies, detected in the nebular emission lines in fibre spectra of a background quasars without a prior knowledge of the absorption (see e.g., Straka et al., 2015). It is clear from Fig. 16 (left lower panel) that [O iii]/[O ii] rises by 0.21 dex between . Similarly, the [O iii]/H is also found to be evolving from to by 0.27 dex between (see Table 4). The above trends indicate that the nebular emissions seen in Mg ii systems in our sample follow the trends shown by the general population of normal star-forming galaxies.
In a stacking analysis of galaxies between from the SHELS galaxy redshift survey, Kewley et al. (2015) have studied the [O iii]/[O ii] and [O iii]/H line ratio as a function of stellar mass bins, derived from the broad-band photometry. They showed that the optical line ratio is also a strong function of stellar mass, where the galaxies with lower stellar masses show higher line ratio (see also, Henry et al., 2013; Ly et al., 2014; Hayashi et al., 2015; Ly et al., 2015). The [O iii]/[O ii] and [O iii]/H in our Mg ii systems are found to be similar as seen in the field galaxies with stellar masses in the range (Kewley et al., 2015, see their figure 2 and 3).
We measure the gas phase metallicity (Z) and ionization parameter (q) of the ionized nebula using the izi (Inferring metallicity and ionization parameters) code described in Blanc et al. (2015) and assuming the photoionization model results of Levesque et al. (2010). The Z and q for the three bins are listed in column 5 and 6 of Table 4. A typical metallicity of Mg ii systems over a redshift range of is found to be sub-solar with log Z = 8.3.
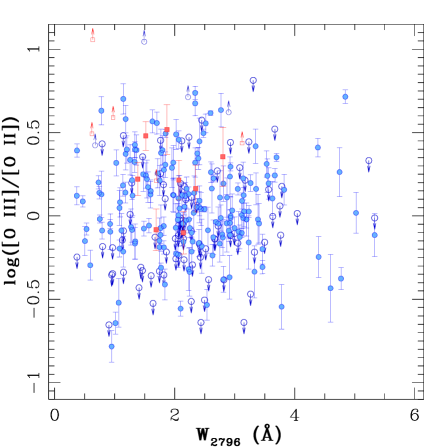
In Fig. 16 (right panel), we plot the [O iii]/[O ii] as a function of . We find that the [O iii]/[O ii] does not depend on the , with Kendall’s rank correlation coefficient () of 0.02 and null probability in a survival analysis while including the upper limits as censored data points. In addition, no correlation is seen for systems with clear detection with and .
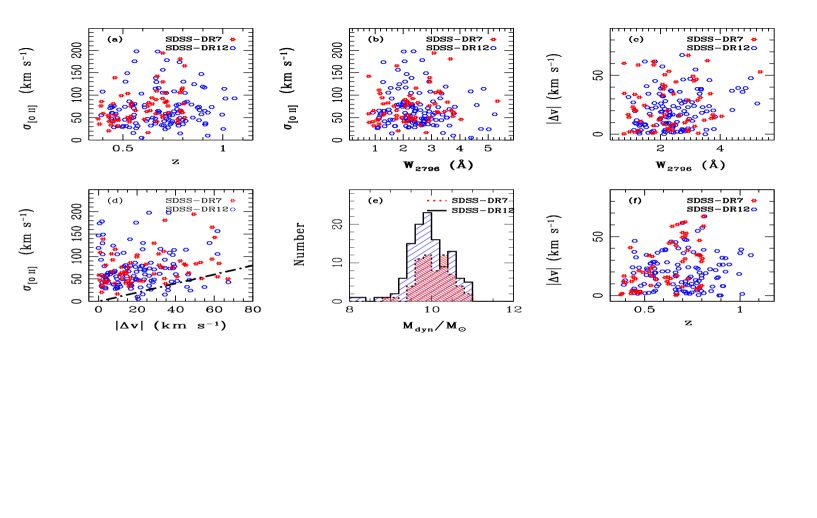
4.7 Velocity width of emission and mass of Mg ii absorbers
In this section, we study the kinematic properties of Mg ii systems in our sample. The velocity widths (deconvolved for the instrumental broadening) of [O ii]3727,3729 doublet (i.e., ) is found in the range of km s-1 to km s-1 in SDSS-DR7 and km s-1 to km s-1 in the SDSS-DR12 spectra with an average of 75 km s-1. This is similar to a typical velocity dispersion found in the SDSS galaxies (Oh et al., 2011). The does not indicate any differences between the in SDSS-DR7 and DR12 with . We also measure the velocity shift () between the absorption and emission redshift for each system. These values are found to be typically km s-1. Now we compare the and () with the other parameters of the systems.
In panel (a) of Fig. 17 we look for the dependence of as a function of redshift of the Mg ii absorbers. For the systems detected in SDSS-DR7 fibre spectra a Spearman rank correlation test finds a correlation with (SDSS-DR7) = 0.41 and null probability (significant at ). However, no such correlation is seen between and for the systems detected in SDSS-DR12 with (SDSS-DR12) = 0.09 and . For comparison when we use field galaxies from MPA-JHU SDSS-DR7 catalog we find no correlation between and at .
In panel (b) of Fig. 17 we compare with . We do not find any correlation between and of Mg ii absorber with a correlation coefficient of (SDSS-DR7) = and (SDSS-DR12) = 0.22 at a significance level of . If can be treated as a proxy to the underlying galaxy mass than the above result suggests that there is no one to one correspondence between and mass of the host galaxy.
We also compare the relative velocity shift () between absorption and emission line as a function of in panel (c) of Fig. 17. The Spearman rank correlation test finds no correlation at between and in the SDSS-DR7 and DR12. The maximum is found to be 70 km s-1. Even though there is no correlation present it is interesting to note that systems with Å have larger . Further, in panel (f) of Fig. 17 we show the dependence of on redshift. For the Mg ii systems detected in SDSS-DR7 spectra the shows a correlation with with (SDSS-DR7) = 0.47 and (significant at ). However, no such correlation is seen for the Mg ii systems detected in SDSS-DR12 spectra with (SDSS-DR12) = 0.05 and .
In panel (d) of Fig. 17, we compare the with the absolute relative velocity shift () between absorption and emission line. Note that, it is quite possible that the absorption and emission may come from two different regions of the galaxy. We do not find any correlation between and . It is clear from the figure that all but 14 systems are well within a regime where gas is bound to the host galaxy, i.e, , shown as dot-dashed line in panel (d) of Fig. 17. We note that among the 14 systems where , 8 systems belongs to the ultrastrong Mg ii absorbers, i.e., with 3 Å. In addition, 2 systems are having 3.0 Å and 4 systems with Å. As these systems are predominantly ultrastrong Mg ii absorbers, they may be produced in the outflows from the galaxies (Nestor et al., 2011; Gauthier, 2013). The fraction of ultrastrong Mg ii absorbers with is found to be (i.e., 8 out of 43 systems). However, these galaxies do not show signatures of high SFR. In order to draw a firm conclusion on winds we need high resolution spectra that will resolve the velocity profiles of absorption line (Kacprzak et al., 2013; Ho et al., 2017).
Next, by using the width of [O ii] line we measure the dynamical mass () of the Mg ii absorbers using,
| (3) |
Here, C is a geometric correction factor that can vary depending on the assumed shape and orientation of the galaxies, is the effective half-light radius, and G is the gravitational constant. We have used similar to Maseda et al. (2013). The is computed from the scaling relation of versus for the star forming galaxies by Paulino-Afonso et al. (2017, see above Section 4.5) at the redshift of Mg ii absorber. The distribution of for the Mg ii systems detected in the SDSS-DR7 (dotted histogram) and SDSS-DR12 (solid histogram) are shown in panel (e) of Fig. 17. The Mg ii systems in our sample probe a range of dynamical mass with log (M⊙) = and with a median of and in the SDSS-DR7 and SDSS-DR12, respectively. Note that, the above dynamical masses represent a lower limit on the mass as the measured could suffers from finite fibre loss.
In summary, we find that the Mg ii systems with [O ii] emission in our sample share similar properties like normal galaxies with typical line width of km s-1 and dynamical mass of, log (M⊙) . In addition, most of the absorbers seem to be bound to the host galaxy.
4.8 versus impact parameter:
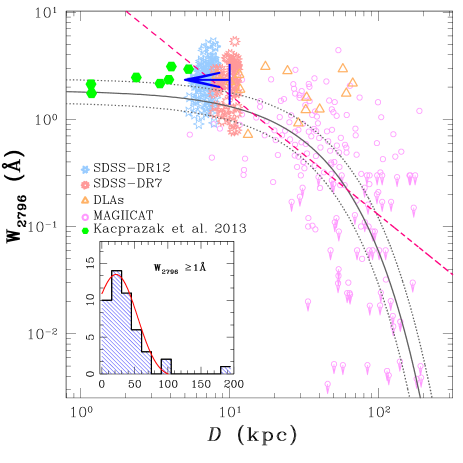
It has been firmly established that the rest-frame equivalent width of Mg ii absorption is anti-correlated with the impact parameter, (Bergeron & Boissé, 1991; Steidel, 1995; Chen et al., 2010a; Rao et al., 2011; Nielsen et al., 2013b, a), albeit with a large scatter. Recently, using a sample of 182 galaxies having impact parameters of , Nielsen et al. (2013a, b) have shown a anti-correlation between and which is well represented by a log-linear relation of = . However, a considerable scatter is seen in the data which may be related to the galaxy luminosity, where more luminous galaxies have larger at a fixed (see, Nielsen et al., 2013b; Churchill et al., 2013). Furthermore, using 7 spectroscopically confirmed low redshift () galaxies Kacprzak et al. (2013) have shown that anti-correlation between and is maintained even at low impact parameter of .
Here, we explore the versus correlation at low impact parameters over a large redshift range of . Note that, for the Mg ii systems at , the fibre diameter of 3 and 2 arcsec ensures a close star-forming galaxy within an impact parameter of and , respectively. In Fig 18 we show the distribution of and for our sample in the - plane. The circle and upper limits are for the absorbers and non-absorbers from the spectroscopically identified galaxies hosting Mg ii absorbers compiled in the MAGiiCAT (Nielsen et al., 2013a, b). We also show a best-fit power law from Chen et al. (2010a), as a dashed curve. At a fixed impact parameter of the above log-linear relation by Nielsen et al. (2013a) predicts a of 1.6 Å and 1.32 Å. Whereas, at these impact parameters the power-law fit from Chen et al. (2010a) predicts a of Å and Å, respectively. The median probed in our sample is found to be 2.23 and 2.32 Å for SDSS-DR7 and SDSS-DR12 data set, respectively. It is clear from Fig. 18 that majority of the points lie above the log-linear relation of versus .
Next, we estimate the average of Mg ii systems expected in our case by assuming the above two functional forms for - relation and associating an impact parameter dependent detection probability of Mg ii systems as:
| (4) |
Here, is - relation, is the maximum impact parameter, taken as a projected fibre radius of 10 kpc at a median redshift of 0.65 for the 3 arcsec SDSS-DR7 fibre. is impact parameter dependent detection probability of Mg ii absorber which is defined as , assuming a spherical halo. Using eq. 4 and the best fit log-linear and power-law relations for - we find an average up to 10 kpc to be Å and Å, respectively. However, if we consider the impact parameter corresponding to a 2 arcsec fibre used in SDSS-DR12 at median redshift, i.e., of 7 kpc, the for above two models are found to be Å and Å. The median value found for our sample, while consistent with these average values within , is closer to the power-law prediction.
Furthermore, using the distribution of spectroscopically confirmed strong, Å, Mg ii absorbers from MAGiiCAT (i.e. 40 systems) along with the seven systems from Kacprzak et al. (2013) we computed the detection probability of strong Mg ii absorbers within impact parameter of (a typical projected size of SDSS fibre). The distribution of the is shown in the inset of Fig. 18. We have modelled the distribution with a skewed Gaussian (see the solid curve in Fig. 18) and compute the probability of strong absorbers being less than 8 kpc to be . The detection probability further increases to 25% if we consider the systems with Å. Recall that, about 95% of strong Mg ii systems in our sample do not have [O ii] nebular emission detected in SDSS fibres above the detection threshold. Therefore, the above larger probability of strong Mg ii absorber being at smaller () than the % detection rate of nebular emission lines from Mg ii absorbers (see, Fig.9) either related to large intrinsic spread in at a given or a large spread in L at a given .
5 Conclusions
Using the Mg ii absorbers found in SDSS-DR7 and SDSS-DR12 spectra we have complied a sample of Mg ii systems with detectable nebular emission lines over a redshift range of . By studying the absorption and emission line properties of this unique set of Mg ii systems we derive the following results :
(1) The Mg ii absorbers in our sample are found to be mostly sub-L⋆ with luminosities ranging from L and L, with a median of 0.54 and 0.43 L in the SDSS-DR7 and SDSS-DR12, respectively. A typical SFR of the Mg ii systems uncorrected for dust reddening and fibre losses are found to be in the range of . We show that our data suffers from finite fibre size effects and all the above quoted values should be considered as lower limits.
(2) The nebular emission is preferentially detected in the strong Mg ii systems, i.e, 96% of systems are having Å, with a mean of 2.3 Å. The detection rate of nebular emission from Mg ii absorbers with Å and L 0.3L⋆ is found to be very small at 3% and 1% in the SDSS-DR7 and DR12 spectra, respectively. We find the detection probability to depend on the , where larger systems show higher detection rate. Furthermore, the detection rate increases with the size of the fibre aperture (see Figure 9). For a given , the detection rate of nebular emission increases with increasing .
(3) In contrast to the strong correlation seen between and obtained from the stacked spectra, our Mg ii systems with nebular emission do not show any statistically significant correlation between and even when we restrict ourselves to narrow ranges. We conclude that the correlation observed in the stacked spectra are dominated by the increase in nebular line detection probability with . In addition, we find that is strongly correlated with redshift. This is also dominated by the fibre size effect where at higher redshifts the projected size of the fibres will cover a larger fraction of galaxy area than for galaxies at low redshifts.
(4) We have found that the physical conditions in galaxies in our sample evolve with redshift. A rise of dex in the nebular emission line ratio of [O iii]/[O ii] and [O iii]/H is seen over a redshift range of . This is similar to what is seen in normal galaxies at this redshift range. From the well known stellar mass dependence on the line ratio we suggest that the Mg ii absorbers likely belongs to the population of low stellar mass galaxies with a typical stellar masses in the range .
(5) The typical velocity widths () of the [O ii] nebular emission in Mg ii absorbers are found in the range of km s-1, with an average km s-1. The does not show any correlation with and . We measure the maximum relative velocity shift () between emission and absorption to be km s-1. By comparing the and we show that most systems are well within the regime where gas is bound to the host galaxy. In addition, the Mg ii absorbers probe the galaxies with range of dynamical mass, i.e., log () = 7.5-10.8.
(6) We show that Mg ii systems follow the well known relationships between and impact parameter even at small impact parameters. A comparison of their distribution with that of the Milky Way shows that the GOTOQs are most likely produced in the ISM+halo of their host galaxy. Hence, these systems are ideally suited for probing various feedback processes at play in galaxies. In addition, by comparing the doublet ratio () and parameter of strong Mg ii absorbers with and without emission line detection we find that most of the GOTOQs have large values and . Therefore, good fraction of these systems could be DLAs.
Acknowledgments
We thank the anonymous referee for constructive comments and suggestions. RS, PN, and PPJ acknowledge the support from Indo-French Centre for the Promotion of Advance Research (IFCPAR) under project number 55042.
Funding for the Sloan Digital Sky Survey IV has been provided by the Alfred P. Sloan Foundation, the U.S. Department of Energy Office of Science, and the Participating Institutions. SDSS-IV acknowledges support and resources from the Center for High-Performance Computing at the University of Utah. The SDSS web site is www.sdss.org.
SDSS-IV is managed by the Astrophysical Research Consortium for the Participating Institutions of the SDSS Collaboration including the Brazilian Participation Group, the Carnegie Institution for Science, Carnegie Mellon University, the Chilean Participation Group, the French Participation Group, Harvard-Smithsonian Center for Astrophysics, Instituto de Astrofísica de Canarias, The Johns Hopkins University, Kavli Institute for the Physics and Mathematics of the Universe (IPMU) / University of Tokyo, Lawrence Berkeley National Laboratory, Leibniz Institut für Astrophysik Potsdam (AIP), Max-Planck-Institut für Astronomie (MPIA Heidelberg), Max-Planck-Institut für Astrophysik (MPA Garching), Max-Planck-Institut für Extraterrestrische Physik (MPE), National Astronomical Observatories of China, New Mexico State University, New York University, University of Notre Dame, Observatário Nacional / MCTI, The Ohio State University, Pennsylvania State University, Shanghai Astronomical Observatory, United Kingdom Participation Group, Universidad Nacional Autónoma de México, University of Arizona, University of Colorado Boulder, University of Oxford, University of Portsmouth, University of Utah, University of Virginia, University of Washington, University of Wisconsin, Vanderbilt University, and Yale University.
References
- Abazajian et al. (2009) Abazajian K. N., et al., 2009, ApJS, 182, 543
- Alam et al. (2015) Alam S., et al., 2015, ApJS, 219, 12
- Bahcall et al. (1993) Bahcall J. N., et al., 1993, ApJS, 87, 1
- Baldwin et al. (1981) Baldwin J. A., Phillips M. M., Terlevich R., 1981, PASP, 93, 5
- Barton & Cooke (2009) Barton E. J., Cooke J., 2009, AJ, 138, 1817
- Bergeron (1986) Bergeron J., 1986, A&A, 155, L8
- Bergeron & Boissé (1991) Bergeron J., Boissé P., 1991, A&A, 243, 344
- Blanc et al. (2015) Blanc G. A., Kewley L., Vogt F. P. A., Dopita M. A., 2015, ApJ, 798, 99
- Bolton et al. (2004) Bolton J., Meiksin A., White M., 2004, MNRAS, 348, L43
- Bolton et al. (2012) Bolton A. S., et al., 2012, AJ, 144, 144
- Bordoloi et al. (2011) Bordoloi R., et al., 2011, ApJ, 743, 10
- Bordoloi et al. (2014) Bordoloi R., et al., 2014, ApJ, 794, 130
- Borthakur et al. (2010) Borthakur S., Tripp T. M., Yun M. S., Momjian E., Meiring J. D., Bowen D. V., York D. G., 2010, ApJ, 713, 131
- Bouché et al. (2006) Bouché N., Murphy M. T., Péroux C., Csabai I., Wild V., 2006, MNRAS, 371, 495
- Bouché et al. (2007) Bouché N., Murphy M. T., Péroux C., Davies R., Eisenhauer F., Förster Schreiber N. M., Tacconi L., 2007, ApJ, 669, L5
- Chelouche & Bowen (2010) Chelouche D., Bowen D. V., 2010, ApJ, 722, 1821
- Chen et al. (2010a) Chen H.-W., Helsby J. E., Gauthier J.-R., Shectman S. A., Thompson I. B., Tinker J. L., 2010a, ApJ, 714, 1521
- Chen et al. (2010b) Chen H.-W., Wild V., Tinker J. L., Gauthier J.-R., Helsby J. E., Shectman S. A., Thompson I. B., 2010b, ApJ, 724, L176
- Churchill et al. (2000) Churchill C. W., Mellon R. R., Charlton J. C., Jannuzi B. T., Kirhakos S., Steidel C. C., Schneider D. P., 2000, ApJS, 130, 91
- Churchill et al. (2013) Churchill C. W., Trujillo-Gomez S., Nielsen N. M., Kacprzak G. G., 2013, ApJ, 779, 87
- Comparat et al. (2016) Comparat J., et al., 2016, MNRAS, 461, 1076
- Dutta et al. (2017) Dutta R., Srianand R., Gupta N., Joshi R., Petitjean P., Noterdaeme P., Ge J., Krogager J.-K., 2017, MNRAS, 465, 4249
- Gauthier (2013) Gauthier J.-R., 2013, MNRAS, 432, 1444
- Gupta et al. (2012) Gupta N., Srianand R., Petitjean P., Bergeron J., Noterdaeme P., Muzahid S., 2012, A&A, 544, A21
- Hayashi et al. (2015) Hayashi M., et al., 2015, PASJ, 67, 80
- Henry et al. (2013) Henry A., Martin C. L., Finlator K., Dressler A., 2013, ApJ, 769, 148
- Herenz et al. (2013) Herenz P., Richter P., Charlton J. C., Masiero J. R., 2013, A&A, 550, A87
- Hewett et al. (1985) Hewett P. C., Irwin M. J., Bunclark P., Bridgeland M. T., Kibblewhite E. J., He X. T., Smith M. G., 1985, MNRAS, 213, 971
- Ho et al. (2017) Ho S. H., Martin C. L., Kacprzak G. G., Churchill C. W., 2017, ApJ, 835, 267
- Joshi et al. (2017) Joshi R., Srianand R., Noterdaeme P., Petitjean P., 2017, MNRAS, 465, 701
- Kacprzak et al. (2008) Kacprzak G. G., Churchill C. W., Steidel C. C., Murphy M. T., 2008, AJ, 135, 922
- Kacprzak et al. (2010) Kacprzak G. G., Churchill C. W., Ceverino D., Steidel C. C., Klypin A., Murphy M. T., 2010, ApJ, 711, 533
- Kacprzak et al. (2011) Kacprzak G. G., Churchill C. W., Evans J. L., Murphy M. T., Steidel C. C., 2011, MNRAS, 416, 3118
- Kacprzak et al. (2012) Kacprzak G. G., Churchill C. W., Steidel C. C., Spitler L. R., Holtzman J. A., 2012, MNRAS, 427, 3029
- Kacprzak et al. (2013) Kacprzak G. G., Cooke J., Churchill C. W., Ryan-Weber E. V., Nielsen N. M., 2013, ApJ, 777, L11
- Kennicutt (1998) Kennicutt Jr. R. C., 1998, ApJ, 498, 541
- Kewley et al. (2001) Kewley L. J., Dopita M. A., Sutherland R. S., Heisler C. A., Trevena J., 2001, ApJ, 556, 121
- Kewley et al. (2015) Kewley L. J., Zahid H. J., Geller M. J., Dopita M. A., Hwang H. S., Fabricant D., 2015, ApJ, 812, L20
- Khostovan et al. (2016) Khostovan A. A., Sobral D., Mobasher B., Smail I., Darvish B., Nayyeri H., Hemmati S., Stott J. P., 2016, MNRAS, 463, 2363
- Lanzetta & Bowen (1990) Lanzetta K. M., Bowen D., 1990, ApJ, 357, 321
- Levesque et al. (2010) Levesque E. M., Kewley L. J., Larson K. L., 2010, AJ, 139, 712
- López & Chen (2012) López G., Chen H.-W., 2012, MNRAS, 419, 3553
- Lundgren et al. (2012) Lundgren B. F., et al., 2012, ApJ, 760, 49
- Ly et al. (2014) Ly C., Malkan M. A., Nagao T., Kashikawa N., Shimasaku K., Hayashi M., 2014, ApJ, 780, 122
- Ly et al. (2015) Ly C., Rigby J. R., Cooper M., Yan R., 2015, ApJ, 805, 45
- Martin & Bouché (2009) Martin C. L., Bouché N., 2009, ApJ, 703, 1394
- Martin et al. (2012) Martin C. L., Shapley A. E., Coil A. L., Kornei K. A., Bundy K., Weiner B. J., Noeske K. G., Schiminovich D., 2012, ApJ, 760, 127
- Maseda et al. (2013) Maseda M. V., et al., 2013, ApJ, 778, L22
- Ménard & Chelouche (2009) Ménard B., Chelouche D., 2009, MNRAS, 393, 808
- Ménard et al. (2011) Ménard B., Wild V., Nestor D., Quider A., Zibetti S., Rao S., Turnshek D., 2011, MNRAS, 417, 801
- Nakajima & Ouchi (2014) Nakajima K., Ouchi M., 2014, MNRAS, 442, 900
- Nestor et al. (2011) Nestor D. B., Johnson B. D., Wild V., Ménard B., Turnshek D. A., Rao S., Pettini M., 2011, MNRAS, 412, 1559
- Nielsen et al. (2013a) Nielsen N. M., Churchill C. W., Kacprzak G. G., Murphy M. T., 2013a, ApJ, 776, 114
- Nielsen et al. (2013b) Nielsen N. M., Churchill C. W., Kacprzak G. G., 2013b, ApJ, 776, 115
- Noterdaeme et al. (2010) Noterdaeme P., Srianand R., Mohan V., 2010, MNRAS, 403, 906
- Oh et al. (2011) Oh K., Sarzi M., Schawinski K., Yi S. K., 2011, ApJS, 195, 13
- Osterbrock & Ferland (2006) Osterbrock D. E., Ferland G. J., 2006, Astrophysics of gaseous nebulae and active galactic nuclei
- Pâris et al. (2012) Pâris I., et al., 2012, A&A, 548, A66
- Paulino-Afonso et al. (2017) Paulino-Afonso A., Sobral D., Buitrago F., Afonso J., 2017, MNRAS, 465, 2717
- Petitjean & Bergeron (1990) Petitjean P., Bergeron J., 1990, A&A, 231, 309
- Rao & Turnshek (2000) Rao S. M., Turnshek D. A., 2000, ApJS, 130, 1
- Rao et al. (2006) Rao S. M., Turnshek D. A., Nestor D. B., 2006, ApJ, 636, 610
- Rao et al. (2011) Rao S. M., Belfort-Mihalyi M., Turnshek D. A., Monier E. M., Nestor D. B., Quider A., 2011, MNRAS, 416, 1215
- Rao et al. (2017) Rao S. M., Turnshek D. A., Sardane G. M., Monier E. M., 2017, preprint, (arXiv:1704.01634)
- Richter (2012) Richter P., 2012, ApJ, 750, 165
- Rigby et al. (2002) Rigby J. R., Charlton J. C., Churchill C. W., 2002, ApJ, 565, 743
- Rubin et al. (2010) Rubin K. H. R., Prochaska J. X., Koo D. C., Phillips A. C., Weiner B. J., 2010, ApJ, 712, 574
- Rubin et al. (2012) Rubin K. H. R., Prochaska J. X., Koo D. C., Phillips A. C., 2012, ApJ, 747, L26
- Savage et al. (2000) Savage B. D., et al., 2000, ApJS, 129, 563
- Srianand (1996) Srianand R., 1996, ApJ, 462, 643
- Srianand & Khare (1994) Srianand R., Khare P., 1994, ApJ, 428, 82
- Steidel (1995) Steidel C. C., 1995, in Meylan G., ed., QSO Absorption Lines. p. 139 (arXiv:astro-ph/9509098)
- Steidel et al. (2002) Steidel C. C., Kollmeier J. A., Shapley A. E., Churchill C. W., Dickinson M., Pettini M., 2002, ApJ, 570, 526
- Steidel et al. (2014) Steidel C. C., et al., 2014, ApJ, 795, 165
- Straka et al. (2015) Straka L. A., et al., 2015, MNRAS, 447, 3856
- Tremonti et al. (2007) Tremonti C. A., Moustakas J., Diamond-Stanic A. M., 2007, ApJ, 663, L77
- Tripp et al. (2005) Tripp T. M., Jenkins E. B., Bowen D. V., Prochaska J. X., Aracil B., Ganguly R., 2005, ApJ, 619, 714
- Weiner et al. (2009) Weiner B. J., et al., 2009, ApJ, 692, 187
- Wild et al. (2007) Wild V., Hewett P. C., Pettini M., 2007, MNRAS, 374, 292
- York et al. (2012) York D. G., et al., 2012, MNRAS, 423, 3692
- Zhu & Ménard (2013) Zhu G., Ménard B., 2013, ApJ, 770, 130