Cooling timescale of dust tori in dying active galactic nuclei
Abstract
We estimate the dust torus cooling timescale once the active galactic nucleus (AGN) is quenched. In a clumpy torus system, once the incoming photons are suppressed, the cooling timescale of one clump from K to several 10 K is less than 10 years, indicating that the dust torus cooling time is mainly governed by the light crossing time of the torus from the central engine. After considering the light crossing time of the torus, the AGN torus emission at 12 m becomes over two orders of magnitude fainter within years after the quenching. We also propose that those “dying” AGN could be found using the AGN indicators with different physical scale such as 12 m band luminosity tracing AGN torus ( pc) and the optical [OIII] emission line narrow line regions ( pc).
1 INTRODUCTION
Dust is the cornerstone of the unified view of active galactic nuclei (AGN). The unified model of AGN (e.g., Antonucci & Miller, 1985) proposes that all AGN are essentially the same; all types of AGN have accretion disks, broad/narrow emission line regions, and those central engines are surrounded by optically and geometrically thick dust “tori” (Krolik & Begelman, 1986).
Since the torus absorbs optical and ultraviolet photons from the accretion disk easily, the torus is heated and finally re-emits in mid-infrared band. X-ray emission also arises as inverse Compton scattering where the source photons could originate from the accretion disk. The strong luminosity correlations of AGN between hard X-ray and mid-infrared emission observationally support that mid-infrared band is a good indicator of AGN torus emission (e.g., Gandhi et al., 2009; Levenson et al., 2009; Asmus et al., 2011, 2015; Ichikawa et al., 2012, 2017; Mateos et al., 2015; García-Bernete et al., 2016).
Recent observations, however, reported interesting populations of AGN. They show the AGN signatures in the larger physical scale with pc scale (e.g., narrow line regions; NLRs and/or radio jets; Bennert et al., 2002; Scheuer, 1995), but lack the AGN signatures in the smaller physical scales with pc (e.g., lack of X-ray emission, the emission from dust tori, and the radio cores). This population is thought to be in the transient stage where they were active in the past, but now the central engine seems quiescent. They are called fading AGN or dying AGN (e.g., Schawinski et al., 2010; Schweizer et al., 2013; Ichikawa et al., 2016; Schirmer et al., 2016; Menezes et al., 2016; Keel et al., 2017).
The large-scale AGN signature is also a good tool to constrain the AGN quenching time. IC 2479 is one of the first fading AGN discovered through the galaxy zoo project (Lintott et al., 2008). Lintott et al. (2009) first mentioned that high ionization lines including [OIII]5007 are bright in the [OIII] blob, while the [OIII] emission power around the AGN core is orders of magnitude weaker, suggesting that AGN is fading. Schawinski et al. (2010) confirmed this hypothesis through the X-ray observations with XMM-Newton and Suzaku. Considering the distance from the central engine to the [OIII] blobs and input power, they estimated that the central engine of IC 2479 faded over two orders of magnitude within yrs. Ichikawa et al. (2016) used a jet lobe size for estimating the upper limit of the quenching time of the dying AGN. Assuming a jet angle to the line of sight of and a typical expansion, the kinematic age of the radio jets is estimated to be yr. Therefore, the current understanding is that AGN reduce their luminosity over two orders of magnitude within yr, or even faster.
On the other hand, the size of the AGN dust torus is well suited to our human timescale. Recent mid-infrared high spatial resolution ( arcsec) observations have constrained the torus size of pc (e.g., Packham et al., 2005; Mason et al., 2006; Radomski et al., 2008; Ramos Almeida et al., 2009; Alonso-Herrero et al., 2011; Ichikawa et al., 2015). Further, current mid-infrared interferometry observations have revealed that a nearby AGN torus has a size of several pc (e.g., Jaffe et al., 2004; Raban et al., 2009; Hönig et al., 2012, 2013; Burtscher et al., 2013; Tristram et al., 2014; López-Gonzaga et al., 2016). Detecting the decline of the torus emission compared to large-scale feature such as NLR affords us to find a fresh quenching AGN within yrs. To achieve this goal, it is crucial to estimate the torus cooling time quantitatively once the photon flux from the central engine becomes negligible. In this paper, for the first step, we report an estimation of the cooling time of AGN torus once the central engine is shut off in a simple assumption.
2 Model
Since the AGN torus is thought to be composed of a number of individual clumps, the cooling timescale of the dust torus is characterized by that of individual clumps unless the radiative interactions between clumps are neglected. As we discuss in Section 3.1, the radiative interaction is expected to be less important in the cooling timescale. In this Section, first, we describe the cooling timescale of an individual clump and show that the clump cools down with year once the clump heating photons are lost. Second, we calculate the spectral energy distribution (SED) of the AGN torus and estimate the attenuation of the flux in the mid-infrared wavelength as time goes by.
2.1 Physical Properties of the Torus Clump
We describe physical properties of the clump in the torus. The idea of the torus clump is first proposed by Krolik & Begelman (1988), and then the model is sophisticated by many authors (e.g., Beckert & Duschl, 2004; Hönig & Beckert, 2007; Namekata et al., 2014). The basic idea of the torus clump here is mainly compiled in Vollmer et al. (2004).
The clump should be gravitationally bounded, and therefore the mass of the clump is thought to be larger than the Jeans mass ,
| (1) |
where is the gravitational constant, is the speed of sound, and is the gas density of clump. In addition, the clump radius should be smaller than the tidal radius ,
| (2) |
where is a distance from the black hole to the clump and is the black hole mass in the central engine. Using , Equation (1) can be reduced to
| (3) |
Substituting Equation (3) into Equation (2), we obtain
It follows from Equations (3) and (2.1) that the mass of marginally stable clump is
The average hydrogen number density of one clump is cm-3, where is the hydrogen mass. In this study, we assume the homogeneous spherical clump for simplicity.
2.2 Cooling Timescale of Individual Clump
Suppose the size distribution of dust grains obeys the power-law size distribution (Mathis et al., 1977; Draine & Lee, 1984),
| (8) |
where is the distribution function of grain size, is a grain radius, is a normalization factor and is the number density of H nuclei, and subscript denotes the silicate or the graphite. Denote by the internal energy of a dust clump, then it can be described as follows:
| (9) |
where is the heat capacity per unit volume, is the temperature of a clump, is the gas mass of dust clump, and is a dust-to-gas mass ratio. For the sake of simplicity, we assumed an individual clump has a uniform temperature. It is noting that dust temperature at outer and inner regions within a clump may differ. However, this temperature difference does not significantly alter internal energy and cooling-curve of a clump. Hence, in this paper, we adopt single temperature approximation for an individual clump.
For the model of heat capacities, we adopt Draine & Li (2001)111There is a typographical error of Equation (10) of Draine & Li (2001) as pointed out in Li & Draine (2002). , then
| (10) | |||||
| (11) |
where
| (12) |
and is a number density of carbon and atoms for graphite and silicate, respectively. Assuming g cm-3 and g cm-3 reduce to cm-3 and cm-3, respectively.
Next, we investigate how individual clump cools as time goes by. If dust clump is optically thick, internal energy of the clump will be released through its photosphere, and then the cooling rate will be proportional to the surface area of the clump. Hence, we expect the cooling rate of optically thick clump approximately to be , where is the temperature of clump and is a Stefan-Boltzmann constant. On the other hand, if dust clump is optically thin, cooling rate should be the same as that of single dust grains. Based on above consideration, we adopt the energy equation of individual clump for arbitrary optical depth as follows,
| (13) |
where is the radius of a clump, is the energy exchange between gas and dust, and denotes the physical quantity to be averaged over the Planck function with temperature . is the emission efficiency of a clump, where is the optical depth for absorption of a clump defined by
| (14) |
where is a mass of dust grain, and is the absorption opacity of dust grain. From Equations (14) and (8), we obtain
| (15) |
where is the hydrogen mass, is the dust-to-gas mass ratio, and
| (16) |
The dust-to-gas mass ratio can be described as, for ,
| (17) |
The energy exchange between gas and dust can be written as
Using Equation (8), we find
| (19) | |||||
where is the accommodation coefficient, is the thermal velocity of gas, and is the gas temperature. We have averaged over the grain size distribution. In this paper, we assume (e.g., Tielens, 2005). Since we have assumed uniform temperature and density structure in the clump, is constant within the cloud. Therefore, we obtain
| (20) | |||||
| (21) |
The abundance ratio of silicates and graphites is set as (Draine & Lee, 1984). This corresponds to 53% of silicate grain, and the other 47% for graphite in volume. The upper and lower cut-off to the size distribution is assumed to be m and m, and the slope adopted is (Mathis et al., 1977). Since the dust-to-gas ratio in AGN is still under debate (e.g., Maiolino et al., 2001), we use the galactic ISM value of (e.g., Tielens, 2005) throughout this paper. The dust grain is assumed to be spherical; thus, optical properties can be calculated by using the Mie theory (e.g., Bohren & Huffman, 1983). For the dielectric function of silicates and graphites, we adopt Draine & Lee (1984); Laor & Draine (1993); Weingartner & Draine (2001); Draine (2003) and Draine & Lee (1984); Aniano et al. (2012), respectively. Since graphite is a highly anisotropic material, optical properties depend on the direction of incident fields with respect to the basal plane of graphite. We assume randomly oriented graphite grains, and hence, we can use so-called “ approximation” (e.g., Draine, 1988); , where is the incident electric field and is a normal vector to the basal plane of graphite. To estimate the free-electrons contribution to dielectric function for graphite with , we adopt the two-components free-electrons model introduced by Aniano et al. (2012). For free-electrons models of , we still adopt the model of Draine & Lee (1984).
Since the gas-dust collision term depends on the gas temperature, the energy equation of gas should also be solved. Denote by the internal energy of the gas in the clump, then the energy equation for gas can be written as
| (22) |
where and represent the energy exchange between gas and dust and by line cooling, respectively. Note that has a positive sign when the gas temperature is higher than the dust temperature. We have ignored the compression heating since free-fall timescale of the clump is longer than the cooling timescale of clump, e.g., yr for the clump of pc and . The radiative cooling rate of through the transition from level to level of some species is written by (e.g., Tielens & Hollenbach, 1985)
| (23) |
where is a population density at level , is the espace probability, is the source function, and is the background radiation field. As a background radiation, we assume the ambient thermal radiation from dust grains, and then
| (24) |
where is calculated using Equation (14). Since we have assumed a homogeneous spherical clump, the escape probability averaged over line profile and over the cloud volume can be approximately given by (Draine, 2011)
| (25) |
where is an optical depth at line center given by
| (26) |
here we assumed that gas motion is assumed to be Maxwellian one dimensional distribution with the velocity dispersion of .
Gas is assumed to be ideal, and hence, the equation of state becomes . As a result, we find
| (27) |
where is a specific heat ratio and we adopt . In this paper, we assume the local thermal equilibrium (LTE) to obtain the level populations. As molecular species, we adopt H2, CO, and H2O because these molecules are abundant in the AGN dust tori. Note that H2O becomes abundant at relatively hot inner region of dust tori, because H2O molecules form via a neutral-neutral reaction whose energy barrier is K, and the reaction is effective at K (Harada et al., 2010). We adopt the molecular fractional abundances with respect to is , , and at 3 pc from the black hole (Harada et al., 2010). We adopt the data of line parameters in the Leiden Atomic and Molecular Database LAMDA222http://home.strw.leidenuniv.nl/~moldata/ (Schöier et al., 2005) and H2 line parameters in Wagenblast & Hartquist (1988); Nomura & Millar (2005). We use a part of the RATRAN code 333http://home.strw.leidenuniv.nl/~michiel/ratran/ (Hogerheijde & van der Tak, 2000) in order to read the molecular data for calculating the line cooling.
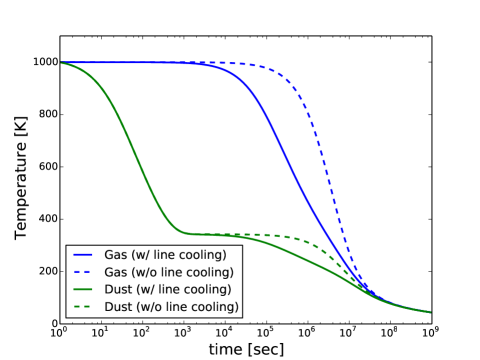
In Figure 1, we plot the change of dust and gas temperature of the individual clump. Figure 1 shows that the clump cools down to tens of Kelvin within years. Dust temperature drops quickly until s after the heating photon supply ends, and then it reaches a plateau phase where the radiative cooling and collisional heating of gas particles are balancing. Therefore, dust grains cannot cool down to tens of Kelvin unless the clump gas cools down. The gas temperature starts to decrease at s due to molecular line cooling that is mainly dominated by H2O. Even in the absence of line cooling, gas clump will be cooled due to dust radiation via gas-dust collisions. As a result, dust temperature drops to tens of Kelvin within years. It is worth noting that equilibrium dust temperature at the plateau phase depends on the gas density. This indicates that clumps at the outer region cool down faster than the inner clumps since they have lower gas density. This result indicates that the cooling timescale of dust tori is slightly shorter than the light-crossing time with an order of 10 yr of the dust torus size. Therefore, we conclude that the dust cooling timescale in the torus is mainly governed by the light-crossing time.
2.3 SED of Dust Tori
To reproduce the torus SED, we assume smooth distribution of the dust density for simplicity. The SED of AGN torus is obtained by using two-layers model (Chiang & Goldreich, 1997; Chiang et al., 2001). In this model, the optically thick disk is divided into two regions, the surface layer where the dust grains are directly irradiated by the AGN, and interior layer where the dust grains are indirectly heated by the AGN, in other words, they are heated by the thermal emission of directly irradiated dust grain at surface layer. The resultant SED can be obtained by superposing the flux from the surface layer (Equation 32) and interior layer (Equation 33).
We assume the torus is axisymmetric, and the surface density of dust grains obeys the simple power law function, g cm-2. The inner and outer radii were observationally constrained and the AGN luminosity dependence was reported with pc (Barvainis, 1987; Kishimoto et al., 2011; Koshida et al., 2014), and pc (Kishimoto et al., 2011; García-Burillo et al., 2016; Imanishi et al., 2016), respectively. The opening angle of the torus is assumed to be 45 degrees, and then the grazing angle is . The opacity of a mixture of silicate and graphite grains is obtained by averaging the absorption efficiency of them weighted for the volume fraction of 53% and 47% for silicate and graphite, respectively.
The temperature of directly irradiated dust grains by the AGN is
| (28) |
where is a distance from the AGN, and erg s-1 is the AGN luminosity. is an absorption efficiency with respect to the incoming AGN photons, defined by
| (29) |
, and is the total flux. Using , normalized spectrum of the AGN is assumed to be Nenkova et al. (2008a),
| (30) |
where m, m, m, and . The estimated dust temperature at the inner radius is approximately K which is consistent with the sublimation temperature of the interior of a dust clump. The temperature of interior grain is given by (Chiang et al., 2001),
| (31) |
where is a size distribution averaged grain opacity. is evaluated at the temperature of most luminous grains in the surface. We assume that the temperature of all grains at midplane is thermally equilibrated.

Once the radial distributions of grain temperature at the surface and interior layer are obtained, the emission spectrum of AGN torus can be calculated as below. The emission spectrum of the interior layer, , is
| (32) |
where is the luminosity distance. The emission spectrum of the surface layer, , is
| (33) |
where and is the source function and optical depth given by (e.g., Chiang et al., 2001),
| (34) | |||||
| (35) |
The dashed gray line in the Figure 2 shows the SED for the equilibrium temperature structure of the dust torus.
3 Discussion
3.1 Time Dependence of SED
The clump is optically thick in the shorter wavelength, and optically thin in the longer wavelength than mid-infrared emission domain. The dust clump at midplane is heated by the near-infrared emission of dust clump at the surface layer and reradiates its energy in mid- to far-infrared wavelength. In far-infrared wavelength, since a clump is optically thin, most of photons emitted from the midplane escape without experiencing significant absorption. At the surface optically thin layer, clumps are sparsely distributed, and hence, the radiative interaction between clumps at the surface layer does not frequently occur. Based on above considerations, we assume that the cooling timescale of the torus is mainly governed by that of each clump.
We calculate the time evolution of the torus SED after the central AGN is quenched. We assume that the temperature of dust tori given by Equations (28) and (31) will be cooled according the characteristic cooling-curve of individual clump defined by Equations (20), (21), and (27). In addition, to take into account the light crossing time, the surface and midplane temperature at radius starts to decrease at and after the AGN is quenched, respectively. The factor in the latter is inserted so that the light crossing time of vertical direction is taken into account as well as the radial direction. Since cooling timescale depends on the clump density, or the black hole mass, we derive the black hole mass by setting that the initial AGN luminosity is 5 % of the Eddington luminosity (e.g., Kelly et al., 2010).
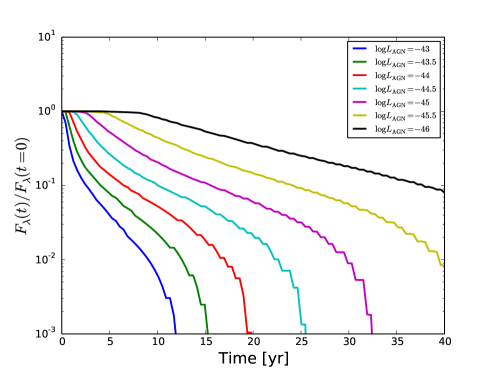
Figure 2 shows the time dependence of the AGN torus SED with face-on view after the quenching of the central engine with the initial AGN luminosity of erg s-1. Once the high-energy photons stop being emitted, individual clumps cool down rapidly, and the light crossing time of the torus, yr, governs the cooling timescale. In Figure 3, we plot the change of mid-infrared 12 m emission flux as a function of time since the central engine is quenched. The torus in higher luminosity AGN shows a longer cooling time because of the larger torus outer radius as shown in Section 2.3.
3.2 Searching for Dying AGN Candidates
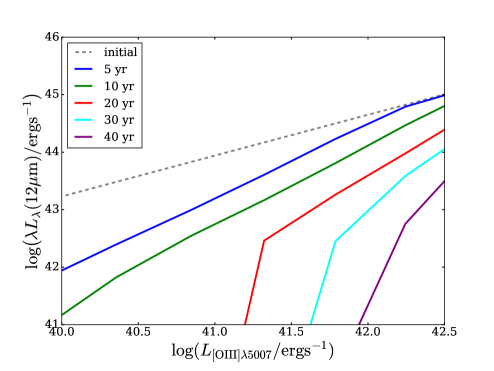
To search for dying AGN candidates discussed above, a longer and more stable timescale AGN indicator than the torus thermal emission is necessary to compare with the torus mid-infrared luminosity. NLR is a promising tool because their size is generally pc, and [OIII] emission line is one of the good NLR indicators hosting a strong luminosity correlation with AGN indicators (Ueda et al., 2015). A promising method is to cross-match optically selected type-2 AGN obtained by the Sloan Digital Sky Survey (SDSS; York et al., 2000) with Allwise catalogs (Wright et al., 2010). SDSS type-2 AGN have prominent [OIII] emission and Allwise will give us MIR 12 or 22 m emission. Based on the luminosity relations of AGN between [OIII] and 12 m luminosity (Toba et al., 2014), is equivalent to , which is as luminous as QSO as shown with the gray dashed line in Figure 4. Using the time evolution function of 12 m luminosity in Figure 3, we calculate the time evolution of the luminosity relation of [OIII] and 12 m luminosity in Figure 4. The AGN locating at the bottom right area in Figure 4 would be a prominent candidate of those dying AGN. This study could be achievable for type-2 AGN with the redshift range of , where the optical line diagnostics of AGN can be applied (e.g., Kewley et al., 2006). Further studies using the method above will be discussed in a forthcoming paper.
The ongoing Subaru HSC (Miyazaki et al., 2012) SSP deep survey (Aihara et al., 2017a, b) covering 28 deg2 will also be a promising region for finding dying AGN using [OIII] emitters at and obtained with a narrow band filter NB816, NB921, respectively. Again, if there are sources with extremely low ratio of , this could be a prominent candidate of high- dying AGN which cannot be covered with the method of SDSS survey above. In this case, optical or near-infrared spectral follow-up is crucial to disentangle the [OIII] emitters into starburst galaxies and AGN (e.g., Kewley et al., 2006).
4 Conclusions
The cooling time of the torus is mainly governed by the light crossing time of the torus from the central engine. The dust torus cools down by roughly 1 orders of magnitude within 10 yr once the propagation of the photon from the central engine stops, and the dust torus emission completely disappears with yr for most of the AGN luminosity range as shown in Figure 3. Those weak dust-torus emissions or “dying” AGN could be found with the combination of the optical spectral or narrow band survey detecting the NLR indicator [OIII]5007 by cross-matching with Allwise 12 or 22 m band.
References
- Aihara et al. (2017a) Aihara, H., Armstrong, R., Bickerton, S., et al. 2017, arXiv:1702.08449
- Aihara et al. (2017b) Aihara, H., Arimoto, N., Armstrong, R., et al. 2017, arXiv:1704.05858
- Alonso-Herrero et al. (2011) Alonso-Herrero, A., Ramos Almeida, C., Mason, R., et al. 2011, ApJ, 736, 82
- Aniano et al. (2012) Aniano, G., Draine, B. T., Calzetti, D., et al. 2012, ApJ, 756, 138
- Antonucci & Miller (1985) Antonucci, R. R. J., & Miller, J. S. 1985, ApJ, 297, 621
- Asmus et al. (2011) Asmus, D., Gandhi, P., Smette, A., Hönig, S. F., & Duschl, W. J. 2011, A&A, 536, A36
- Asmus et al. (2015) Asmus, D., Gandhi, P., Hönig, S. F., Smette, A., & Duschl, W. J. 2015, MNRAS, 454, 766
- Barvainis (1987) Barvainis, R. 1987, ApJ, 320, 537
- Bennert et al. (2002) Bennert, N., Falcke, H., Schulz, H., Wilson, A. S., & Wills, B. J. 2002, ApJ, 574, L105
- Beckert & Duschl (2004) Beckert, T., & Duschl, W. J. 2004, A&A, 426, 445
- Bohren & Huffman (1983) Bohren, C. F., & Huffman, D. R. 1983, New York: Wiley, 1983,
- Burtscher et al. (2013) Burtscher, L., Meisenheimer, K., Tristram, K. R. W., et al. 2013, A&A, 558, A149
- Chiang & Goldreich (1997) Chiang, E. I., & Goldreich, P. 1997, ApJ, 490, 368
- Chiang et al. (2001) Chiang, E. I., Joung, M. K., Creech-Eakman, M. J., et al. 2001, ApJ, 547, 1077
- Draine & Lee (1984) Draine, B. T., & Lee, H. M. 1984, ApJ, 285, 89
- Draine (1988) Draine, B. T. 1988, ApJ, 333, 848
- Draine & Li (2001) Draine, B. T., & Li, A. 2001, ApJ, 551, 807
- Draine (2003) Draine, B. T. 2003, ApJ, 598, 1026
- Draine (2011) Draine, B. T. 2011, Physics of the Interstellar and Intergalactic Medium by Bruce T. Draine. Princeton University Press, 2011. ISBN: 978-0-691-12214-4
- Gandhi et al. (2009) Gandhi, P., Horst, H., Smette, A., et al. 2009, A&A, 502, 457
- García-Bernete et al. (2016) García-Bernete, I., Ramos Almeida, C., Acosta-Pulido, J. A., et al. 2016, MNRAS, 463, 3531
- García-Burillo et al. (2016) García-Burillo, S., Combes, F., Ramos Almeida, C., et al. 2016, ApJ, 823, L12
- Harada et al. (2010) Harada, N., Herbst, E., & Wakelam, V. 2010, ApJ, 721, 1570
- Hogerheijde & van der Tak (2000) Hogerheijde, M. R., & van der Tak, F. F. S. 2000, A&A, 362, 697
- Hönig & Beckert (2007) Hönig, S. F., & Beckert, T. 2007, MNRAS, 380, 1172
- Hönig et al. (2012) Hönig, S. F., Kishimoto, M., Antonucci, R., et al. 2012, ApJ, 755, 149
- Hönig et al. (2013) Hönig, S. F., Kishimoto, M., Tristram, K. R. W., et al. 2013, ApJ, 771, 87
- Ichikawa et al. (2012) Ichikawa, K., Ueda, Y., Terashima, Y., et al. 2012, ApJ, 754, 45
- Ichikawa et al. (2015) Ichikawa, K., Packham, C., Ramos Almeida, C., et al. 2015, ApJ, 803, 57
- Ichikawa et al. (2016) Ichikawa, K., Ueda, J., Shidatsu, M., Kawamuro, T., & Matsuoka, K. 2016, PASJ, 68, 9
- Ichikawa et al. (2017) Ichikawa, K., Ricci, C., Ueda, Y., et al. 2017, ApJ, 835, 74
- Imanishi et al. (2016) Imanishi, M., Nakanishi, K., & Izumi, T. 2016, ApJ, 822, L10
- Jaffe et al. (2004) Jaffe, W., Meisenheimer, K., Röttgering, H. J. A., et al. 2004, Nature, 429, 47
- Keel et al. (2017) Keel, W. C., Lintott, C. J., Maksym, W. P., et al. 2017, ApJ, 835, 256
- Kelly et al. (2010) Kelly, B. C., Vestergaard, M., Fan, X., et al. 2010, ApJ, 719, 1315
- Kewley et al. (2006) Kewley, L. J., Groves, B., Kauffmann, G., & Heckman, T. 2006, MNRAS, 372, 961
- Kishimoto et al. (2011) Kishimoto, M., H’́onig, S. F., Antonucci, R., et al. 2011, A&A, 536, 78
- Koshida et al. (2014) Koshida, S., Minezaki, T., Yoshii, Y., et al. 2014, ApJ, 788, 159
- Krolik & Begelman (1986) Krolik, J. H., & Begelman, M. C. 1986, ApJ, 308, L55
- Krolik & Begelman (1988) Krolik, J. H., & Begelman, M. C. 1988, ApJ, 329, 702
- Laor & Draine (1993) Laor, A., & Draine, B. T. 1993, ApJ, 402, 441
- Levenson et al. (2009) Levenson, N. A., Radomski, J. T., Packham, C., et al. 2009, ApJ, 703, 390
- Li & Draine (2002) Li, A., & Draine, B. T. 2002, ApJ, 564, 803
- Lintott et al. (2008) Lintott, C. J., Schawinski, K., Slosar, A., et al. 2008, MNRAS, 389, 1179
- Lintott et al. (2009) Lintott, C. J., Schawinski, K., Keel, W., et al. 2009, MNRAS, 399, 129
- Lira et al. (2013) Lira, P., Videla, L., Wu, Y., et al. 2013, ApJ, 764, 159
- López-Gonzaga et al. (2016) López-Gonzaga, N., Burtscher, L., Tristram, K. R. W., Meisenheimer, K., & Schartmann, M. 2016, A&A, 591, A47
- Marconi et al. (2004) Marconi, A., Risaliti, G., Gilli, R., et al. 2004, MNRAS, 351, 169
- Markowitz et al. (2014) Markowitz, A. G., Krumpe, M., & Nikutta, R. 2014, MNRAS, 439, 1403
- Mason et al. (2006) Mason, R. E., Geballe, T. R., Packham, C., et al. 2006, ApJ, 640, 612
- Mateos et al. (2015) Mateos, S., Carrera, F. J., Alonso-Herrero, A., et al. 2015, MNRAS, 449, 1422
- Mathis et al. (1977) Mathis, J. S., Rumpl, W., & Nordsieck, K. H. 1977, ApJ, 217, 425
- Maiolino et al. (2001) Maiolino, R., Marconi, A., Salvati, M., et al. 2001, A&A, 365, 28
- Menezes et al. (2016) Menezes, R. B., Steiner, J. E., & da Silva, P. 2016, ApJ, 817, 150
- Miyazaki et al. (2012) Miyazaki, S., Komiyama, Y., Nakaya, H., et al. 2012, Proc. SPIE, 8446, 84460Z
- Mor et al. (2009) Mor, R., Netzer, H., & Elitzur, M. 2009, ApJ, 705, 298
- Namekata et al. (2014) Namekata, D., Umemura, M., & Hasegawa, K. 2014, MNRAS, 443, 2018
- Nenkova et al. (2008a) Nenkova, M., Sirocky, M. M., Ivezić, Ž., & Elitzur, M. 2008, ApJ, 685, 147
- Nenkova et al. (2008b) Nenkova, M., Sirocky, M. M., Nikutta, R., Ivezić, Ž., & Elitzur, M. 2008, ApJ, 685, 160
- Nomura & Millar (2005) Nomura, H., & Millar, T. J. 2005, A&A, 438, 923
- Packham et al. (2005) Packham, C., Radomski, J. T., Roche, P. F., et al. 2005, ApJ, 618, L17
- Raban et al. (2009) Raban, D., Jaffe, W., Röttgering, H., Meisenheimer, K., & Tristram, K. R. W. 2009, MNRAS, 394, 1325
- Radomski et al. (2008) Radomski, J. T., Packham, C., Levenson, N. A., et al. 2008, ApJ, 681, 141-150
- Ramos Almeida et al. (2009) Ramos Almeida, C., Levenson, N. A., Rodríguez Espinosa, J. M., et al. 2009, ApJ, 702, 1127
- Schawinski et al. (2010) Schawinski, K., Evans, D. A., Virani, S., et al. 2010, ApJ, 724, L30
- Scheuer (1995) Scheuer, P. A. G. 1995, MNRAS, 277, 331
- Schirmer et al. (2016) Schirmer, M., Malhotra, S., Levenson, N. A., et al. 2016, MNRAS, 463, 1554
- Schöier et al. (2005) Schöier, F. L., van der Tak, F. F. S., van Dishoeck, E. F., & Black, J. H. 2005, A&A, 432, 369
- Schweizer et al. (2013) Schweizer, F., Seitzer, P., Kelson, D. D., Villanueva, E. V., & Walth, G. L. 2013, ApJ, 773, 148
- Tielens & Hollenbach (1985) Tielens, A. G. G. M., & Hollenbach, D. 1985, ApJ, 291, 722
- Tielens (2005) Tielens, A. G. G. M. 2005, The Physics and Chemistry of the Interstellar Medium, by A. G. G. M. Tielens, pp. . ISBN 0521826349. Cambridge, UK: Cambridge University Press, 2005.,
- Toba et al. (2014) Toba, Y., Oyabu, S., Matsuhara, H., et al. 2014, ApJ, 788, 45
- Tristram et al. (2014) Tristram, K. R. W., Burtscher, L., Jaffe, W., et al. 2014, A&A, 563, A82
- Ueda et al. (2015) Ueda, Y., Hashimoto, Y., Ichikawa, K., et al. 2015, ApJ, 815, 1
- Vollmer et al. (2004) Vollmer, B., Beckert, T., & Duschl, W. J. 2004, A&A, 413, 949
- Wagenblast & Hartquist (1988) Wagenblast, R., & Hartquist, T. W. 1988, MNRAS, 230, 363
- Weingartner & Draine (2001) Weingartner, J. C., & Draine, B. T. 2001, ApJ, 548, 296
- Wright et al. (2010) Wright, E. L., Eisenhardt, P. R. M., Mainzer, A. K., et al. 2010, AJ, 140, 1868
- York et al. (2000) York, D. G., Adelman, J., Anderson, J. E., Jr., et al. 2000, AJ, 120, 1579