Photometric Study of the Old Open Cluster Ruprecht 6
1 Introduction
The Galactocentric radial metallicity gradient in the disk of the Milky Way (MW) has been studied for a long time (e.g., Twarog et al. 1997; Park & Lee 1999; Chen, Hou, & Wang 2003; Tadross 2003; Kim 2006; Carraro et al. 2007; Paunzen et al. 2010; Netopil et al. 2016; Cantat-Gaudin et al. 2016; Jacobson et al. 2016; Tissera et al. 2016), for which open clusters (OCs) have been under intense studies, alongside with Cepheids (Andrievsky et al. , 2004; Cescutti et al. , 2007), globular clusters (Yong et al. , 2008), red clump (RC) stars (Önal Taş et al. , 2016), planetary nebulae (Stanghellini, & Haywood , 2010), H ii regions (Rudolph et al. , 2006; Fernández-Martín et al. , 2017), field stars (Xiang et al. , 2015), etc. The disk metallicity gradient can give information on the disk formation processes, star formation processes, and chemical evolution of the spiral galaxies (Tissera et al. , 2016). One notable recent result is that of Anders et al. (2017), who have claimed the slopes of the Galactic radial metallicity gradient to be dex kpc-1 for the age range of Gyr and dex kpc-1 for Gyr, using 418 red giant stars observed by CoRoT-APOGEE with 13 kpc and kpc (where is the Galactocentric distance and is the vertical distance from the Galactic plane).
OCs, especially the old ones, are a good laboratory for verifying stellar evolution theories, and they are also good tracers of the star formation and evolutionary history of the Galactic disk. While Lyngå (1987) published data for over 1200 OCs, the observed number of OCs including candidates has increased to 2167 in the latest version (3.5; 2016 January 28) of Dias et al. (2002) (hereafter DAML02) catalog111http://www.wilton.unifei.edu.br/ocdb/. Among the 2167 objects in the DAML02 OC catalog, only 298 (13.8%) have metallicity estimates (Oliveira et al. , 2013; Krisciunas et al. , 2015), while 703 (32.4%) have radial velocity estimates, 2013 (92.9%) have age estimates, 2025 (93.4%) have reddening estimates, 2040 (94.1%) have distance estimates, and 2104 (97.1%) have proper motion estimates. Kharchenko et al. (2013) presented MW object catalog for 3006 objects including 2808 OCs, 147 globular clusters and 51 associations, almost complete up to 1.8 kpc from the Sun, where only 386 out of 3006 have metallicity values. Considering the estimated total number of MW OCs (; Piskunov et al. (2006); Tadross (2011)), more surveys and detailed photometric and spectroscopic studies on individual clusters are awaited.
Ruprecht 6 (Ruprecht , 1966) is an old OC, located in the constellation of Canis Major and at very large distance ( kpc; see Table 1 below) from the Galactic center. It is one of the small-size and poor OCs, which means it contains not so many number of member stars. This could be the reason why there have been few studies on the cluster. Hasegawa et al. (2008), which seems the only previous observational study on this cluster, have used 65-cm telescope, AP8 1024 px CCD, and filters at Gunma Astronomical Observatory (FoV = ) to study 36 old OCs, and included Ruprecht 6 in their study. They obtained some physical parameters for Ruprecht 6 from Padova isochrone fitting : age = 3.2 Gyr (), ([Fe/H] ), mag, and ( kpc), and these values are enlisted in the DAML02 catalog. Some basic physical parameters are summarized in Table 1. The last parameter in Table 1 presents the Trumpler class of Ruprecht 6 to be III 1 p, which means, respectively, (i) Ruprecht 6 is detached and shows no noticeable concentration, (ii) most stars in the cluster are of nearly the same apparent brightness, and (iii) it is poor containing less than 50 stars (Trumpler , 1930; Dias et al. , 2002). In this study, using the optical imaging data obtained by using the CTIO 1.0 m telescope, we present the photometric analysis and physical parameters of the OC Ruprecht 6.
Section 2 describes the observations and data reduction processes. Section 3 presents the results in this study: cluster center position, color-magnitude diagrams, reddening and distance estimations, and PARSEC isochrone fitting results. In Sections 4 and 5, we discuss the Galactocentric metallicity distribution and summarize our results, respectively.
| Parameter | Ruprecht 6 | Reference |
| Other name | C 0653-132 | SIMBAD |
| , | 06h 56m 06s, ∘ 15′ 00′′ | Hasegawa et al. (2008) |
| , | 225.∘28, | Hasegawa et al. (2008) |
| Reddening, | mag | This study |
| Reddening, | mag | This study |
| Distance modulus, | mag | This study |
| Distance, | kpc | This study |
| Galactocentric distance, | kpc | This study |
| Metallicity, [Fe/H] | dex | This study |
| Age, | Gyr () | This study |
| Trumpler type | III 1 p | Dias et al. (2002) |
2 Observations and Data Reduction
Observations have been done using the Small and Moderate Aperture Research Telescope System (SMARTS) 1.0 m telescope and Y4KCam CCD at the Cerro-Tololo Inter-American Observatory (CTIO, Chile) on 2010 December 13 (UT). The Y4KCam CCD made at the Ohio State University is composed of pixels (each 15 m, pixel-1) at the Cassegrain focus of the telescope, while it becomes pixels () after excluding the 40 pixel wide gaps on either horizontal and vertical center separating the CCD into four quadrants and reading out the pixel values 222http://www.astronomy.ohio-state.edu/Y4KCam/detector.
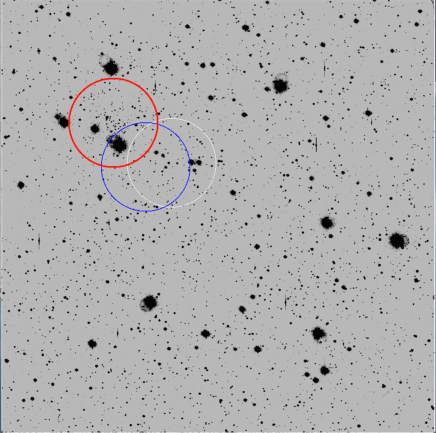
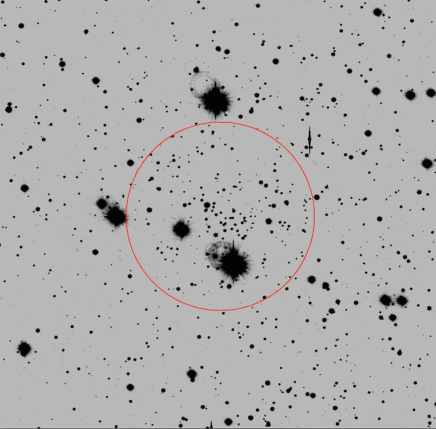
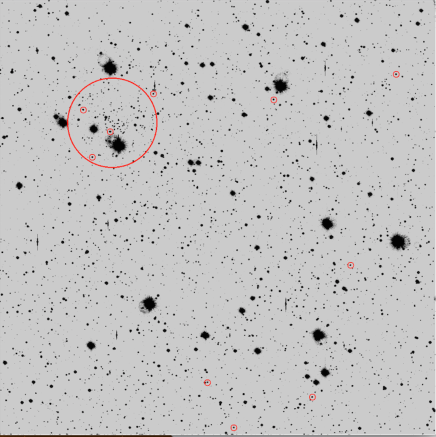
For the OC Ruprecht 6, we have obtained three 1200 sec, three 900 sec, and two 800 sec images for and filters, respectively, under median seeing conditions. The final images are average combined for each filter. Figure 1 displays the combined grey-scale image of three -band frames for the OC Ruprecht 6, where red circles show the region of Ruprecht 6 with radius of 2′.
The raw observation data have been processed with the IRAF333IRAF is distributed by the National Optical Astronomy Observatory, which is operated by the Association of Universities for Research in Astronomy (AURA) under a cooperative agreement with the National Science Foundation./CCDRED package with standard procedure. That is, the overscan correction, bias correction, and the twilight sky flattening have been made. Since interference patterns are seen in the -band images, we made -band supersky image using all the -band images obtained on the same night and performed second flattening. In addition, because of the large format of the detector and the slow speed of the shutter, the shutter shading correction is applied. The IRAF script (y4kshut.cl) given at the CTIO homepage is used for the correction.
Photometry was performed using the DAOPHOT II/ALLSTAR stand-alone package after separating the CCD quadrants to treat them as four separate CCD chips (Stetson , 1990). This is also because each chip has different gain and readout noise. Due to the large field of view, we adopt the quadratic variable point spread function. Aperture corrections were obtained with isolated, bright, and unsaturated stars in each CCD quadrant. Figure 2 shows the error distribution of the photometry results. The photometric errors typically attain 0.1 mag at mag, mag and mag (Kim et al., 2009), indicating ten times of object signal above the background.
Four Landolt (1992, 2007, 2009) standard star fields (PG0231+051, LB1735, LSS982, Rubin 149) were observed during the four nights of the observing run (2010 December , UT) to obtain the standardization equations for this run and to convert the instrumental magnitudes to the standard magnitudes. The transformation equations are
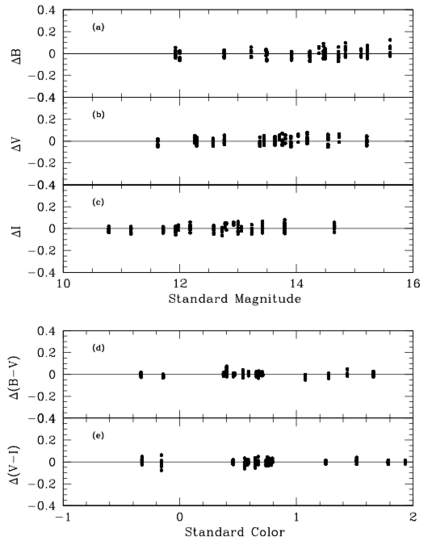
where small and capital letters represent instrumental and standard magnitudes, respectively, and is the airmass for each filter. We also have obtained the secondary extinction coefficient () as a free parameter. Including the secondary extinction coefficient, however, caused the errors of other parameters increase and the overall residual remained at the same value (0.037). So we decided not to adopt but follow the simple solution. Figure 3 (a), (b), and (c) show the standardization residuals for the magnitude differences, where the rms of the fits are , , . Figure 3 (d) and (e) show the standardization residuals for the color differences, where the rms of the fits are , and . Astrometry was done using the routines provided in astrometry.net (Lang et al. , 2010).
The total number of stars with photometry is 5570, while that for the region of Ruprecht 6 with radius is 296. Table 2 lists the photometry of 92 stars of Ruprecht 6 with mag.

| ID | R.A.(J2000) | Decl.(J2000) | sharpness | |||||||
|---|---|---|---|---|---|---|---|---|---|---|
| hh:mm:ss | dd:mm:ss | |||||||||
| 1 | 06:55:58.41 | 13:15:02.73 | 20.25 | 0.012 | 18.99 | 0.005 | 17.46 | 0.006 | 1.010 | 0.108 |
| 2 | 06:55:58.57 | 13:15:20.15 | 19.97 | 0.009 | 18.95 | 0.006 | 17.68 | 0.011 | 1.312 | 0.176 |
| 3 | 06:55:59.86 | 13:14:29.15 | 20.07 | 0.012 | 18.97 | 0.005 | 17.59 | 0.011 | 1.062 | 0.002 |
| 4 | 06:55:59.96 | 13:15:59.53 | 20.11 | 0.010 | 18.80 | 0.005 | 17.37 | 0.005 | 1.004 | 0.061 |
| 5 | 06:55:59.97 | 13:15:13.03 | 19.00 | 0.006 | 17.91 | 0.003 | 16.62 | 0.008 | 1.032 | 0.041 |
| 6 | 06:56:00.08 | 13:15:17.20 | 20.15 | 0.019 | 18.75 | 0.005 | 17.18 | 0.005 | 1.180 | 0.122 |
| 7 | 06:56:00.13 | 13:14:44.95 | 19.22 | 0.008 | 18.21 | 0.004 | 16.97 | 0.005 | 0.704 | 0.036 |
| 8 | 06:56:00.20 | 13:14:42.57 | 16.64 | 0.002 | 15.71 | 0.002 | 14.62 | 0.004 | 1.335 | 0.092 |
| 9 | 06:56:00.32 | 13:15:08.39 | 19.65 | 0.006 | 18.75 | 0.006 | 17.56 | 0.008 | 1.198 | 0.170 |
| 10 | 06:56:00.51 | 13:15:12.44 | 19.95 | 0.009 | 18.60 | 0.005 | 17.11 | 0.005 | 1.084 | 0.091 |
| 11 | 06:56:00.61 | 13:14:30.98 | 19.34 | 0.006 | 18.50 | 0.005 | 17.40 | 0.015 | 1.152 | 0.034 |
| 12 | 06:56:00.98 | 13:14:15.08 | 19.36 | 0.006 | 18.51 | 0.004 | 17.40 | 0.006 | 1.071 | 0.012 |
| 13 | 06:56:01.08 | 13:14:28.63 | 18.47 | 0.004 | 17.59 | 0.006 | 16.40 | 0.005 | 1.184 | 0.000 |
| 14 | 06:56:01.19 | 13:13:53.88 | 19.29 | 0.007 | 18.45 | 0.006 | 17.39 | 0.006 | 1.242 | 0.000 |
| 15 | 06:56:01.21 | 13:14:02.25 | 18.27 | 0.004 | 17.37 | 0.003 | 16.17 | 0.005 | 1.275 | 0.082 |
| 16 | 06:56:01.47 | 13:15:20.49 | 18.71 | 0.004 | 17.88 | 0.003 | 16.84 | 0.006 | 1.181 | 0.049 |
| 17 | 06:56:01.65 | 13:14:46.83 | 19.85 | 0.009 | 18.96 | 0.007 | 17.79 | 0.013 | 1.495 | 0.382 |
| 18 | 06:56:02.10 | 13:15:55.44 | 18.96 | 0.004 | 18.15 | 0.003 | 17.09 | 0.005 | 1.008 | 0.014 |
| 19 | 06:56:02.11 | 13:16:43.81 | 17.84 | 0.003 | 17.02 | 0.002 | 16.04 | 0.004 | 1.110 | 0.049 |
| 20 | 06:56:02.26 | 13:16:00.20 | 19.88 | 0.010 | 18.60 | 0.005 | 17.19 | 0.006 | 1.120 | 0.092 |
| 21 | 06:56:02.41 | 13:14:17.13 | 17.09 | 0.002 | 16.17 | 0.002 | 15.14 | 0.003 | 1.198 | 0.050 |
| 22 | 06:56:03.23 | 13:15:15.03 | 20.38 | 0.013 | 18.89 | 0.005 | 17.17 | 0.007 | 1.200 | 0.092 |
| 23 | 06:56:03.85 | 13:15:02.43 | 19.38 | 0.006 | 18.51 | 0.004 | 17.41 | 0.007 | 1.073 | 0.010 |
| 24 | 06:56:03.99 | 13:15:28.30 | 18.79 | 0.008 | 17.95 | 0.009 | 16.77 | 0.007 | 1.288 | 0.172 |
| 25 | 06:56:04.02 | 13:16:35.93 | 19.78 | 0.008 | 18.70 | 0.004 | 17.44 | 0.006 | 1.026 | 0.045 |
| 26 | 06:56:04.04 | 13:15:08.75 | 18.86 | 0.005 | 17.99 | 0.003 | 16.83 | 0.005 | 1.175 | 0.025 |
| 27 | 06:56:04.34 | 13:15:24.36 | 20.15 | 0.012 | 18.70 | 0.005 | 16.89 | 0.005 | 1.165 | 0.016 |
| 28 | 06:56:04.46 | 13:15:18.99 | 19.32 | 0.006 | 18.25 | 0.004 | 17.00 | 0.004 | 1.022 | 0.018 |
| 29 | 06:56:04.67 | 13:15:10.95 | 19.59 | 0.059 | 18.70 | 0.027 | 17.48 | 0.020 | 1.059 | 0.008 |
| 30 | 06:56:04.77 | 13:14:22.56 | 19.60 | 0.007 | 18.36 | 0.004 | 16.95 | 0.005 | 1.069 | 0.072 |
| 31 | 06:56:04.79 | 13:14:53.61 | 18.05 | 0.003 | 17.21 | 0.002 | 16.10 | 0.004 | 1.152 | 0.025 |
| 32 | 06:56:04.86 | 13:15:02.45 | 19.55 | 0.007 | 18.68 | 0.005 | 17.55 | 0.007 | 1.071 | 0.006 |
| 33 | 06:56:04.94 | 13:13:34.16 | 18.45 | 0.004 | 17.29 | 0.003 | 15.98 | 0.003 | 1.111 | 0.037 |
| 34 | 06:56:04.96 | 13:15:16.51 | 19.15 | 0.006 | 18.20 | 0.004 | 17.01 | 0.005 | 1.147 | 0.014 |
| 35 | 06:56:05.07 | 13:15:02.69 | 19.58 | 0.007 | 18.71 | 0.005 | 17.56 | 0.007 | 1.082 | 0.009 |
| 36 | 06:56:05.21 | 13:16:29.75 | 16.74 | 0.002 | 16.20 | 0.002 | 15.52 | 0.003 | 1.084 | 0.031 |
| 37 | 06:56:05.51 | 13:13:29.11 | 19.69 | 0.009 | 18.49 | 0.005 | 17.11 | 0.004 | 1.089 | 0.050 |
| 38 | 06:56:05.53 | 13:15:09.85 | 19.45 | 0.008 | 18.60 | 0.005 | 17.47 | 0.007 | 0.921 | 0.025 |
| 39 | 06:56:05.57 | 13:15:18.62 | 18.47 | 0.004 | 17.62 | 0.003 | 16.52 | 0.005 | 1.142 | 0.035 |
| 40 | 06:56:05.65 | 13:15:11.24 | 19.32 | 0.007 | 18.46 | 0.004 | 17.33 | 0.006 | 1.103 | 0.004 |
| 41 | 06:56:05.66 | 13:14:26.70 | 18.30 | 0.003 | 16.89 | 0.003 | 15.26 | 0.004 | 1.273 | 0.074 |
| 42 | 06:56:05.80 | 13:16:23.78 | 18.84 | 0.004 | 18.02 | 0.003 | 16.94 | 0.005 | 1.095 | 0.046 |
| 43 | 06:56:05.85 | 13:16:30.40 | 19.67 | 0.023 | 18.75 | 0.005 | 17.54 | 0.007 | 1.769 | 0.413 |
| 44 | 06:56:05.91 | 13:15:08.33 | 19.10 | 0.015 | 18.21 | 0.004 | 17.05 | 0.005 | 1.701 | 0.493 |
| 45 | 06:56:05.91 | 13:14:55.77 | 19.52 | 0.033 | 18.63 | 0.020 | 17.48 | 0.007 | 2.310 | 0.213 |
| 46 | 06:56:06.16 | 13:14:29.79 | 19.81 | 0.008 | 18.91 | 0.006 | 17.75 | 0.007 | 1.073 | 0.042 |
| 47 | 06:56:06.17 | 13:14:06.92 | 19.54 | 0.007 | 18.40 | 0.004 | 17.05 | 0.005 | 1.087 | 0.039 |
| 48 | 06:56:06.32 | 13:14:58.41 | 18.88 | 0.007 | 18.05 | 0.006 | 16.97 | 0.006 | 1.180 | 0.153 |
| 49 | 06:56:06.37 | 13:15:24.27 | 17.25 | 0.002 | 15.86 | 0.003 | 14.24 | 0.004 | 1.603 | 0.126 |
| 50 | 06:56:06.41 | 13:15:51.58 | 16.56 | 0.002 | 15.14 | 0.002 | 13.52 | 0.045 | 6.578 | 0.075 |
| 51 | 06:56:06.51 | 13:14:43.98 | 18.95 | 0.005 | 18.03 | 0.005 | 16.83 | 0.006 | 1.353 | 0.080 |
| 52 | 06:56:06.61 | 13:13:15.27 | 20.35 | 0.015 | 18.88 | 0.007 | 17.20 | 0.006 | 1.025 | 0.008 |
| 53 | 06:56:06.62 | 13:13:12.91 | 18.71 | 0.005 | 17.82 | 0.003 | 16.65 | 0.005 | 1.157 | 0.038 |
| 54 | 06:56:06.63 | 13:13:31.33 | 17.93 | 0.003 | 16.92 | 0.003 | 15.63 | 0.004 | 1.279 | 0.105 |
| 55 | 06:56:06.67 | 13:14:53.42 | 19.84 | 0.010 | 18.56 | 0.005 | 17.13 | 0.006 | 1.227 | 0.083 |
| 56 | 06:56:06.95 | 13:15:13.87 | 19.15 | 0.005 | 18.28 | 0.004 | 17.08 | 0.007 | 1.035 | 0.009 |
| 57 | 06:56:07.03 | 13:16:04.54 | 19.68 | 0.008 | 18.82 | 0.005 | 17.67 | 0.007 | 1.083 | 0.030 |
| 58 | 06:56:07.12 | 13:15:48.73 | 18.75 | 0.006 | 17.88 | 0.003 | 16.74 | 0.004 | 1.192 | 0.111 |
| 59 | 06:56:07.21 | 13:14:52.38 | 18.99 | 0.008 | 18.08 | 0.004 | 17.03 | 0.005 | 0.918 | 0.090 |
| 60 | 06:56:07.28 | 13:14:53.50 | 19.53 | 0.010 | 18.57 | 0.005 | 17.32 | 0.006 | 0.909 | 0.052 |
| 61 | 06:56:07.46 | 13:14:32.94 | 19.60 | 0.014 | 18.41 | 0.004 | 16.97 | 0.005 | 1.430 | 0.009 |
| 62 | 06:56:07.53 | 13:13:12.23 | 18.18 | 0.003 | 17.29 | 0.003 | 16.12 | 0.004 | 1.126 | 0.071 |
| 63 | 06:56:07.57 | 13:13:40.53 | 19.14 | 0.005 | 18.32 | 0.004 | 17.17 | 0.006 | 1.155 | 0.025 |
| 64 | 06:56:07.58 | 13:14:39.80 | 18.88 | 0.005 | 18.03 | 0.004 | 16.90 | 0.005 | 1.103 | 0.021 |
| 65 | 06:56:07.63 | 13:14:23.84 | 19.31 | 0.006 | 18.46 | 0.004 | 17.32 | 0.005 | 1.028 | 0.076 |
| ID | R.A.(J2000) | Decl.(J2000) | sharpness | |||||||
|---|---|---|---|---|---|---|---|---|---|---|
| hh:mm:ss | dd:mm:ss | |||||||||
| 66 | 06:56:07.93 | 13:13:37.70 | 19.65 | 0.007 | 18.76 | 0.005 | 17.60 | 0.006 | 1.025 | 0.065 |
| 67 | 06:56:08.14 | 13:16:27.92 | 19.95 | 0.010 | 18.60 | 0.005 | 16.97 | 0.005 | 1.029 | 0.058 |
| 68 | 06:56:08.23 | 13:14:37.70 | 19.91 | 0.010 | 18.75 | 0.005 | 17.39 | 0.006 | 1.089 | 0.004 |
| 69 | 06:56:08.44 | 13:16:27.10 | 18.09 | 0.003 | 17.21 | 0.003 | 16.03 | 0.004 | 1.099 | 0.030 |
| 70 | 06:56:08.65 | 13:14:44.54 | 18.85 | 0.005 | 17.97 | 0.003 | 16.84 | 0.004 | 1.001 | 0.021 |
| 71 | 06:56:09.07 | 13:14:46.01 | 17.22 | 0.002 | 16.37 | 0.003 | 15.30 | 0.003 | 1.372 | 0.033 |
| 72 | 06:56:09.56 | 13:13:57.52 | 19.16 | 0.005 | 18.51 | 0.005 | 17.65 | 0.008 | 1.169 | 0.114 |
| 73 | 06:56:09.62 | 13:15:22.41 | 19.26 | 0.047 | 18.36 | 0.021 | 17.19 | 0.012 | 4.276 | 2.010 |
| 74 | 06:56:09.64 | 13:16:32.90 | 17.36 | 0.002 | 16.07 | 0.002 | 14.55 | 0.003 | 1.227 | 0.073 |
| 75 | 06:56:09.71 | 13:15:42.04 | 19.68 | 0.008 | 18.81 | 0.005 | 17.68 | 0.006 | 1.058 | 0.098 |
| 76 | 06:56:09.72 | 13:14:09.50 | 19.82 | 0.008 | 18.76 | 0.005 | 17.44 | 0.006 | 1.042 | 0.066 |
| 77 | 06:56:10.02 | 13:13:49.08 | 18.05 | 0.003 | 17.10 | 0.003 | 15.93 | 0.003 | 1.137 | 0.077 |
| 78 | 06:56:10.05 | 13:13:42.90 | 19.45 | 0.006 | 18.58 | 0.004 | 17.45 | 0.005 | 1.004 | 0.012 |
| 79 | 06:56:10.24 | 13:15:41.29 | 19.31 | 0.007 | 18.43 | 0.004 | 17.31 | 0.007 | 1.135 | 0.014 |
| 80 | 06:56:10.24 | 13:14:28.93 | 19.42 | 0.008 | 18.55 | 0.006 | 17.38 | 0.007 | 1.100 | 0.082 |
| 81 | 06:56:10.50 | 13:13:56.56 | 20.10 | 0.010 | 18.63 | 0.005 | 16.88 | 0.004 | 1.047 | 0.175 |
| 82 | 06:56:10.76 | 13:15:55.35 | 20.06 | 0.010 | 18.73 | 0.005 | 17.26 | 0.006 | 1.127 | 0.034 |
| 83 | 06:56:11.08 | 13:15:46.69 | 19.38 | 0.006 | 18.52 | 0.004 | 17.45 | 0.005 | 0.985 | 0.024 |
| 84 | 06:56:11.30 | 13:14:25.49 | 17.47 | 0.003 | 16.08 | 0.002 | 14.44 | 0.003 | 1.214 | 0.058 |
| 85 | 06:56:11.40 | 13:13:52.18 | 17.95 | 0.003 | 17.08 | 0.002 | 15.96 | 0.004 | 1.198 | 0.011 |
| 86 | 06:56:11.41 | 13:15:40.76 | 19.71 | 0.007 | 18.82 | 0.005 | 17.68 | 0.008 | 1.092 | 0.053 |
| 87 | 06:56:11.44 | 13:14:24.73 | 19.82 | 0.012 | 18.90 | 0.009 | 17.66 | 0.012 | 0.598 | 0.023 |
| 88 | 06:56:11.96 | 13:14:12.16 | 17.24 | 0.002 | 16.35 | 0.002 | 15.20 | 0.003 | 1.199 | 0.021 |
| 89 | 06:56:12.02 | 13:13:41.90 | 19.22 | 0.006 | 18.36 | 0.004 | 17.21 | 0.005 | 1.047 | 0.025 |
| 90 | 06:56:12.16 | 13:14:52.31 | 16.12 | 0.002 | 15.40 | 0.002 | 14.54 | 0.003 | 1.330 | 0.083 |
| 91 | 06:56:12.16 | 13:14:14.52 | 19.92 | 0.010 | 18.80 | 0.005 | 17.44 | 0.006 | 0.954 | 0.010 |
| 92 | 06:56:12.26 | 13:15:10.06 | 18.89 | 0.005 | 17.72 | 0.003 | 16.38 | 0.004 | 1.174 | 0.086 |
3 Results
3.1 Cluster Center and Size
For the center coordinates of the OC Ruprecht 6, Hasegawa et al. (2008) presents = 06h 56m 06s, = ∘ 15′ 00′′, which we adopt in this study. While Dias et al. (2002) (Version 3.5, 2016 January 28) lists = 56m 00s, = and SIMBAD gives = 06h 55m 55.2s, = ∘ 16′ 48′′, both of these values result in poor identifications of the cluster center. The coordinates given by Hasegawa et al. (2008) point to the cluster center more accurately as seen in Figure 1.
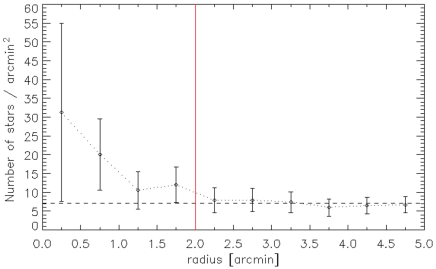
Using the bright stars ( mag) with the cluster center fixed as above, we plotted the radial number density profile with the bin size of in Figure 4. We determined the radius of Ruprecht 6 to be , in which radius most of the member stars are located.
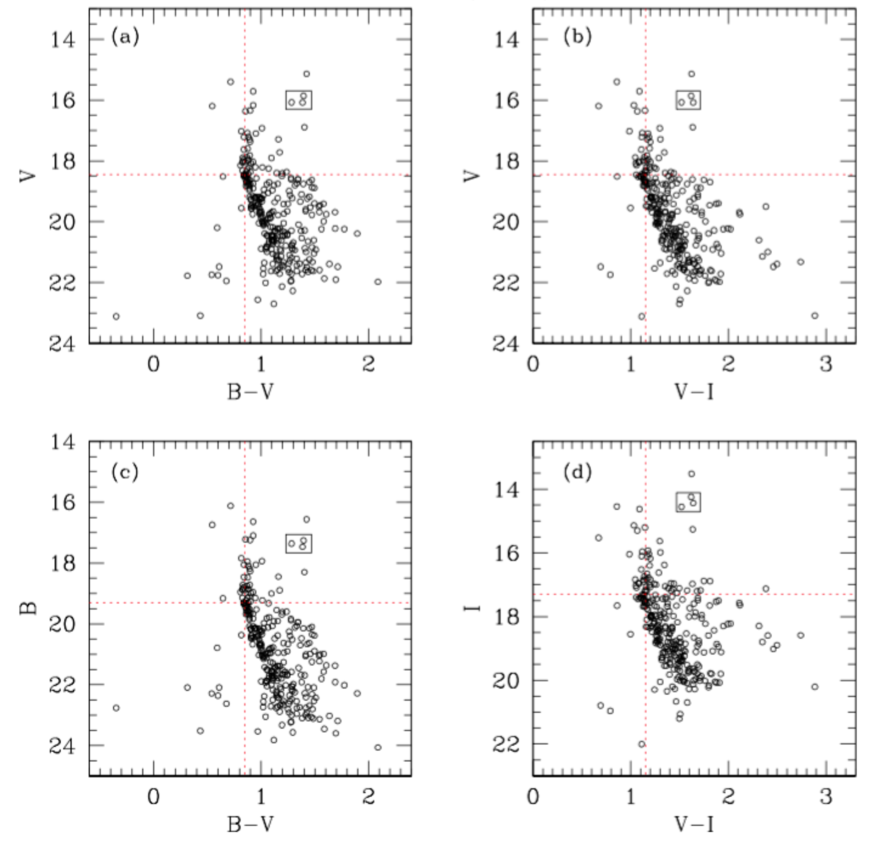
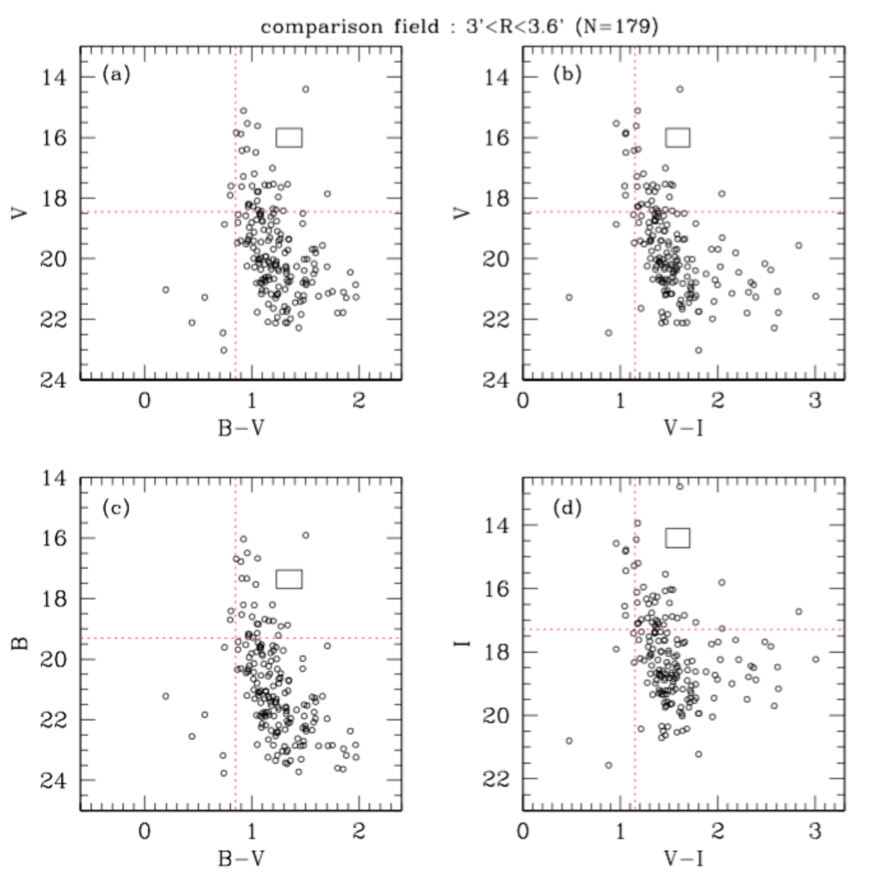
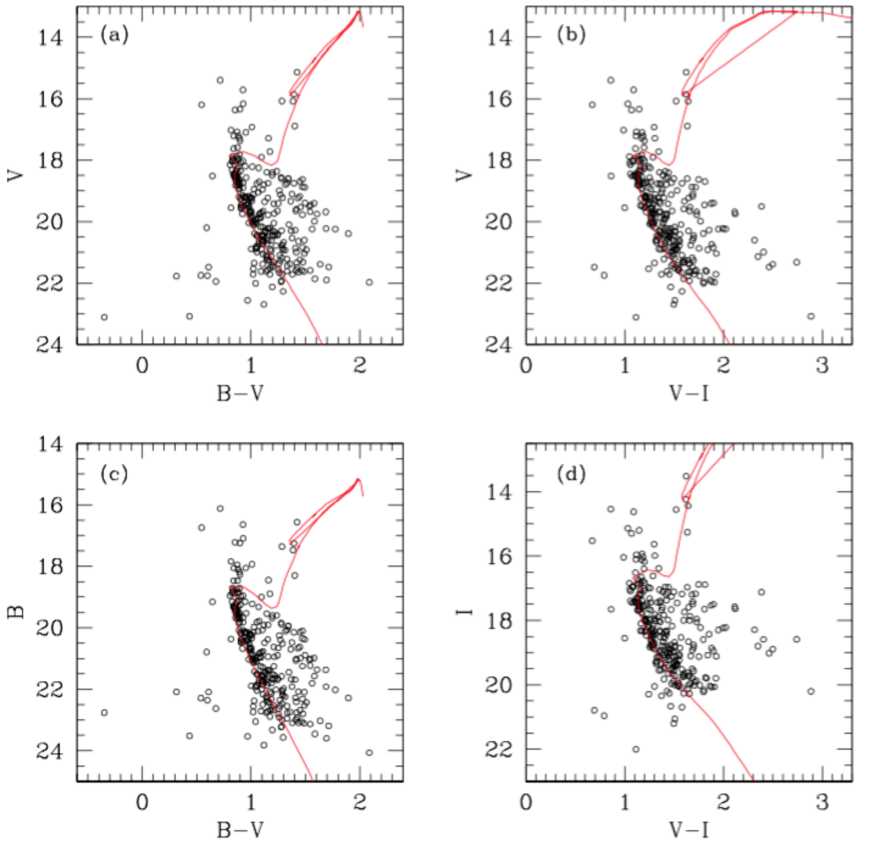
3.2 Color-Magnitude Diagrams
Figure 5 shows the (panel a), (panel b), (panel c), and (panel d) color-magnitude diagrams (CMDs) of the OC Ruprecht 6 for the radial range of obtained in this study, while Figure 6 shows the comparison region () with the same area. Some characteristic features that can be found for Ruprecht 6 in these CMDs are : (i) main-sequence stars are clearly seen and red dotted lines show the blue turn-off point at mag, mag, mag, mag, and mag (see Figure 2 of Kaluzny (1994) for the definition of the blue turn-off), (ii) some red giant stars evolved after the turn-off are found, and (iii) three RC stars are seen and denoted as boxes in Figure 5 with mean magnitudes and colors of mag, mag, mag, , mag mag.
To further check the membership probability of the three RC stars statistically, we extracted all stars with similar magnitudes and colors to the RC stars in the whole observed area of . Figure 7 shows the spatial distribution of the resultant 10 stars located in the RC box area of Figure 5 and Figure 6, including the three RC stars in Ruprecht 6. The stellar spatial density of the three stars in the cluster area is , while that of the seven stars outside of the cluster area is . The stellar density of the cluster area is times more higher than that of the background area, and thus we conclude that the three RC stars in Ruprecht 6 are members of the cluster with high probability.
3.3 Distance Estimation
RC giant stars are low-mass stars at the evolutionary stage of core-helium-burning, that define a sharpest feature (almost constant absolute magnitude) in the CMDs of stellar systems like nearby galaxies and star clusters (Paczyński & Stanek (1998); Kim & Sung (2003); Kim et al. (2005); Kyeong et al. (2011); Karaali et al. (2013); Girardi (2016); Davies et al. (2017), but, see also Wan et al. (2015)). In the near-infrared (NIR), especially in the -band, the RC is known to have small dependence on metallicity and age, showing mag and an intrinsic color of mag (Yaz Gökçe et al. , 2013; Özdönmez et al. , 2016). Recently, Girardi (2016) published a detailed review paper on the RC stars, and summarized the mean absolute magnitudes of these stars, which could possibly be used to estimate the distances and extinctions to stellar systems with the age of 1 to 10 Gyr though with some caveats such as population effects. Table 4 shows the mean -band absolute magnitudes of RC stars from Girardi (2016) and the mean values of the five data is mag.
Since it is known that the near-infrared -band magnitude of the RC stars is not sensitive to the age and metallicity of the star cluster than the optical -band magnitude (Sarajedini , 1999; Grocholski & Sarajedini , 2002; Kyeong et al. , 2011), we mainly used the mean (RC) magnitude of the RC stars in Ruprecht 6. Table 5 shows the magnitudes of the three RC stars in Ruprecht 6 extracted from the 2MASS (Two Micron All Sky Survey444available at http://www.ipac.caltech.edu/2mass/releases/allsky/, Skrutskie et al. (1997, 2006)) data archive. Using the mean (RC) magnitude of , the extinction value of (see Section 3.4), and the extinction ratio of (Dutra et al. , 2002), we obtain ().
| Reference | Comments | |
|---|---|---|
| Paczyński & Stanek (1998) | Includes reddening correction | |
| Stanek & Garnavich (1998) | Volume limited to 70 pc | |
| Girardi et al. (1998) | Lutz-Kelker bias corrected | |
| Groenewegen (2008) | First uses revised Hipparcos parallaxes | |
| Francis & Anderson (2014) | Peak of luminosity distribution |
Note.– †From Girardi (2016). Values generally from Hipparcos.
| IDs† | R.A.(J2000) | Decl.(J2000) | |||||||
|---|---|---|---|---|---|---|---|---|---|
| hh:mm:ss | dd:mm:ss | ||||||||
| 49 | 06:56:06.37 | 13:15:24.27 | 13.004 | 0.023 | 12.350 | 0.026 | 12.120 | 0.024 | 0.884 |
| 74 | 06:56:09.64 | 13:16:32.90 | 13.383 | 0.024 | 12.764 | 0.029 | 12.634 | 0.028 | 0.784 |
| 84 | 06:56:11.30 | 13:14:25.49 | 13.184 | 0.026 | 12.564 | 0.027 | 12.400 | 0.029 | 0.749 |
Note.– †IDs from Table 2.
3.4 Reddening Estimation
For the estimation of the interstellar reddening value toward the OC Ruprecht 6, we adopted the following four methods. First, we have used the mean NIR color of the RC stars () from Table 5 and the intrinsic color of RC stars ( mag) mentioned in Section 3.3, we obtain . Using the relation (Kim , 2006), we obtain .
Secondly, we have used the mean optical color of the RC stars in Ruprecht 6: (Section 3.2). Janes & Phelps (1994) gave the mean color and magnitude of the RC stars in old OCs as and , when the magnitude difference between the RC stars and the main sequence turn-off of the clusters, , is greater than one (Kim & Sung , 2003). Since for Ruprecht 6, we obtain .
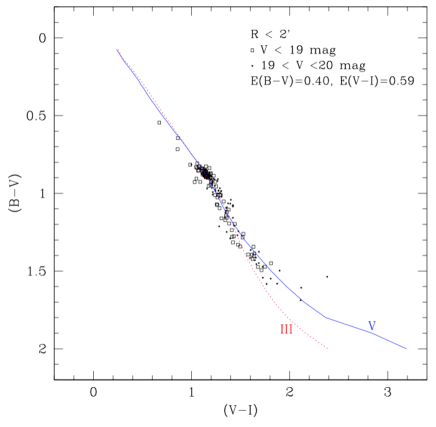
Thirdly, we have used the versus diagram of bright stars with mag and stars of mag in Ruprecht 6 at radius as shown in Figure 8. Solid and dotted lines show the intrinsic relations for the dwarf and giant stars, respectively, from Sung et al. (2013), which are shifted according to the reddenings of and . Although the reddening vector in the diagram is very similar to the distribution of main-sequence and giant stars, we can get a hint of the amount of the reddening values from this diagram. From the comparison of the observed colors of the bright stars of Ruprecht 6 and the intrinsic colors, we derive the reddening values of and .
Finally, PARSEC isochrone fittings are made as shown in Section 3.5, which gives the best match with and , which are in agreement with the values above within uncertainties.
Considering the results of these four methods, we assume that the true reddening values toward Ruprecht 6 are in the range of and , and in this study we adopt the values of and which afford the best isochrone matches (see Section 3.5). This is in very good agreement with the value () listed in the DAML02 catalog. The interstellar extinction laws given by Cardelli et al. (1989) are used to calculate the extinctions for other colors for the total-to-selective extinction ratio of : , , (Lee & Kim , 2000; Kim et al., 2012).
3.5 PARSEC Isochrone Fittings
In Figure 9, we have plotted the versus (a), versus (b), versus (c), and versus (d) CMDs for Ruprecht 6 together with the theoretical PAdova and TRieste Stellar Evolution Code (PARSEC) isochrones (Bertelli et al. , 1994; Girardi et al. , 2000, 2002; Bressan et al. , 2012). The best matched isochrones are for the parameters of log (age) (t Gyr) and [Fe/H] dex shifted according to , , , , and . The metallicity and age values obtained in this study are in excellent agreement with those of Hasegawa et al. (2008) ([Fe/H] and log (t) , t Gyr) and DAML02 ([Fe/H] and log (t) ).
With the limited data of photometry only, it is not an easy task to determine the reddening, distance, age, and metallicity simultaneously from the isochrone fitting due to the degeneracy of parameters. We, therefore, have used pre-determined values of distance (Section 3.3) and reddening (Section 3.4) for the isochrone fittings just to find optimum values of age and metallicity, after which slight fine-tunings are made. Good matches of the theoretical isochrones and the observed photometry data lend support for the distance and reddening values, and the newly obtained values of age and metallicity.
4 Discussion
4.1 Red Clump Stars
Among the 10 RC stars shown in Figure 7, one star is located just outside of the radius circle of Ruprecht 6, with its coordinates R.A. 56m 6.366s and Decl. . Since it is very likely that this star could also be a member of the cluster considering its close location to the cluster area, we can include it in our estimation of the cluster parameters. The optical and 2MASS NIR photometry results of the star are : mag, mag, mag, mag, mag, mag, and mag.
Inclusion of this star results in the mean magnitude to be mag and this gives the distance modulus to be ( kpc, still using the reddening values obtained in Section 3.4), which agrees within the error range but somewhat shorter than that in Section 3.3. The mean NIR color of the four RC stars including the above one is mag and this results in a little bit larger reddening values of and .
4.2 Galactocentric Metallicity Distribution
OCs have been used as one of the tools to probe the Galactocentric radial metallicity distribution in our own Galaxy (Kim & Sung , 2003; Wu et al. , 2009; Ryu & Lee , 2011). This radial variation of the metallicity in the disk of the Galaxy is a powerful tool for the understanding of the star formation and chemical evolution of the system (Fernández-Martín et al. , 2017). Kim et al. (2005) have compiled the slope ([Fe/H]) values of the Galactocentric radial metallicity gradient published up to then. Using the nine published slope values, they obtained the mean value of the slope [Fe/H]. In Table 6, we have compiled again the slopes and intercept values incorporating recently published results for OCs.
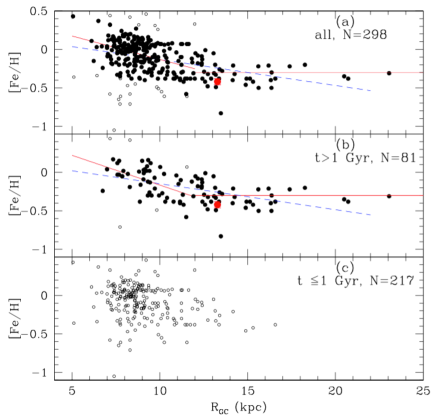
For the OCs in the DAML02 catalog, we have calculated the Galactocentric distances using the distance estimates, Galactic coordinates in the catalog and the equation : , where is the heliocentric distance to the cluster, and are the Galactic longitude and Galactic latitude, respectively, of the cluster, is the distance of the Sun from the Galactic center ( kpc is used in this study). Out of 2167 OCs listed in the DAML02 catalog, only 298 clusters have both of metallicity and distance estimates, which are shown in Figure 10 as a function of the Galactocentric distance, .
We have performed the least square fitting for all the 298 OCs with both metallicity and distance estimates, and obtained [Fe/H] with rms = 0.229 for all the radial range of the Galaxy (shown as blue dashed line in Figure 10 (a)). Assuming the outer ( kpc) clusters might follow constant ([Fe/H] dex) metallicity trend, we also made the least square fitting only for the inner ( kpc) OCs with 2 clipping, which returns [Fe/H] with rms = 0.155 (N = 231) (shown as red solid line in Figure 10 (a)).
Taking into account only the old OCs with age Gyr, we plotted the same plot in Figure 10 (b). The 81 objects in the whole radial range give the relation of [Fe/H] with rms = 0.201 (blue dashed line in Figure 10 (b)), and the 49 clusters at kpc left after the 2 clipping process returns [Fe/H] with rms = 0.152 (red solid line in Figure 10 (b)). This result is in very good agreement with those obtained recently by Ryu & Lee (2011) and Andreuzzi et al. (2011), while the number of OCs used in this study is smaller than those of the previous studies which resulted from introduction of the process of extracting only the old and good (by 2 clipping) clusters for the analysis.
Whether we adopt the single relation for the whole radial range or the dual relation broken at kpc, Ruprecht 6 seems to conform either of the radial metallicity trends at its location of kpc.
The metallicity estimates from photometric indices are less reliable than those from spectroscopic observations. colors for late-F to early-K-type stars, Washington and DDO photometric systems for G and K-type giants can give some reliable values. However, while the DAML02 catalog gives detailed references for proper motions and radial velocities, the sources for the metallicity estimates are not listed. Among the 81 objects in Figure 10 (b), there are 18 objects for which stars are used to determine the metallicity, 40 objects for which stars are used, and no information is given for the other 23 objects. Investigating the sources of the metallicity estimates again is beyond the scope of this paper, but compilation and classification of these estimates using the criteria of the methods to find abundances and number of stars used will be a good approach to obtain more reliable Galactocentric radial metallicity distribution of the OCs in the Milky Way.
| Reference | Radial Coverage | RMS | N | ||
|---|---|---|---|---|---|
| This study | All | 0.201 | 81 | ||
| This study | kpc | 0.152 | 49 | ||
| This study | kpc | – | 27 | ||
| Ryu & Lee (2011) | kpc | 0.029 | 186 | ||
| Ryu & Lee (2011) | kpc | 186 | |||
| Andreuzzi et al. (2011) | All | – | – | 177 | |
| Andreuzzi et al. (2011) | kpc | – | – | 177 | |
| Andreuzzi et al. (2011) | kpc | – | 177 | ||
| Kim (2006) | All | – | – | 53 | |
| Kim et al. (2005) | All | – | – | 51 | |
| Kim et al. (2005) | – | – | – | ||
| Friel et al. (2002) | All | – | – | 39 | |
| Piatti et al. (1995) | All | – | 0.13 | 63 |
Note.– Unit of the slope ([Fe/H]) is dex kpc-1.
Mean value of the nine literature values.
5 Summary
We derived the physical parameters of the small-size and poorly studied old OC Ruprecht 6 using the optical photometry data. The main results obtained in this study are :
The color-magnitude diagrams of Ruprecht 6 show clear MS stars. The MS turn-off point is at mag and mag.
Three RC stars are at mag, mag and mag. The mean -band magnitude of RC stars ( mag) and the known absolute magnitude of the RC stars ( mag), the distance modulus to Ruprecht 6 is obtained to be mag ( kpc).
From the and colors of the RC stars, comparison of the and colors of the bright stars in Ruprecht 6 with those of the intrinsic colors of dwarf and giant stars, and the PARSEC isochrone fittings, we derive the reddening values of mag and mag.
Using the PARSEC isochrone fittings onto the color-magnitude diagrams, we obtain the age and metallicity values to be : log (t) (t Gyr) and [Fe/H] dex.
For the old (age Gyr) OCs of DAML02 catalog, we obtain the Galactocentric radial metallicity relations of either (i) a single relation of [Fe/H] (rms = 0.201) or (ii) dual relation of [Fe/H] (rms = 0.152) at kpc and constant ([Fe/H] dex) value at kpc.
Acknowledgements.
We thank the anonymous referee and the Scientific Editor for the thorough review and helpful comments that helped to improve the manuscript. The participation of I. H. and S. K. in this project was made possible by UST Research Internship for Undergraduates grant in 2016 July. Based on observations at Cerro Tololo Inter-American Observatory, National Optical Astronomy Observatory (NOAO Prop. ID 2010B-0178, PI Sang Chul KIM), which is operated by the Association of Universities for Research in Astronomy (AURA) under a cooperative agreement with the National Science Foundation. This publication makes use of data products from the Two Micron All Sky Survey, which is a joint project of the University of Massachusetts and the Infrared Processing and Analysis Center/California Institute of Technology, funded by the National Aeronautics and Space Administration and the National Science Foundation.References
- Anders et al. (2017) Anders, F., Chiappini, C., Minchev, I., et al. 2017, Red giants observed by CoRoT and APOGEE: The evolution of the Milky Way’s radial metallicity gradient, A&A, 600, A70
- Andreuzzi et al. (2011) Andreuzzi, G., Bragaglia, A., Tosi, M., et al. 2011, Old open clusters and the Galactic metallicity gradient: Berkeley 20, Berkeley 66 and Tombaugh 2, MNRAS, 412, 1265
- Andrievsky et al. (2004) Andrievsky, S. M., Luck, R. E., Martin, P., et al. 2004, The Galactic abundance gradient from Cepheids. V. Transition zone between 10 and 11 kpc, A&A, 413, 159
- Bertelli et al. (1994) Bertelli, G., Bressan, A., Chiosi, C., et al. 1994, Theoretical isochrones from models with new radiative opacities, A&AS 106, 275
- Bressan et al. (2012) Bressan, A., Marigo, P., Girardi, L., 2012, PARSEC: stellar tracks and isochrones with the PAdova and TRieste Stellar Evolution Code, MNRAS, 427, 127
- Cantat-Gaudin et al. (2016) Cantat-Gaudin, T., Donati, P., Vallenari, A., et al. 2016, Abundances and kinematics for ten anticentre open clusters, A&A, 588, A120
- Cardelli et al. (1989) Cardelli, J. A., Clayton, G. C., & Mathis, J. S. 1989, The relationship between infrared, optical, and ultraviolet extinction, ApJ, 345, 245
- Carraro et al. (2007) Carraro, G., Geisler, D., Villanova, S., et al. 2007, Old open clusters in the outer Galactic disk, A&A, 476, 217
- Cescutti et al. (2007) Cescutti, G., Matteucci, F., François, P., et al. 2007, Abundance gradients in the Milky Way for elements, iron peak elements, barium, lanthanum, and europium, A&A, 462, 943
- Chen, Hou, & Wang (2003) Chen, L., Hou, J. L., & Wang, J. J. 2003, On the Galactic disk metallicity distribution from open clusters. I. New catalogs and abundance gradient, AJ, 125, 1397
- Davies et al. (2017) Davies, G. R., Lund, M. N., Miglio, A., et al. 2017, Using red clump stars to correct the Gaia DR1 parallaxes, A&A, 598, L4
- Dias et al. (2002) Dias, W. S., Alessi, B. S., Moitinho, A., & Lepine, J. R. D. 2002, New catalogue of optically visible open clusters and candidates, A&A, 389, 871
- Dutra et al. (2002) Dutra, C. M., Santiago, B. X., & Bica, E. 2002, Low-extinction windows in the inner Galactic bulge, A&A, 381, 219
- Fernández-Martín et al. (2017) Fernández-Martín, A., Pérez-Montero, E., Vílchez, J. M., et al. 2017, 2017, Chemical distribution of H ii regions towards the Galactic anticentre, A&A, 597, A84
- Francis & Anderson (2014) Francis, C., & Anderson, E. 2014, Two estimates of the distance to the Galactic centre, MNRAS, 441, 1105
- Friel et al. (2002) Friel, E. D., Janes, K. A., Tavarez, M., et al. 2002, Metallicities of old open clusters, AJ, 124, 2693
- Girardi (2016) Girardi, L. 2016, Red clump stars, ARA&A, 54, 95
- Girardi et al. (1998) Girardi, L., Groenewegen, M. A. T., Weiss, A., et al. 1998, Fine structure of the red giant clump from HIPPARCOS data, and distance determinations based on its mean magnitude, MNRAS, 301, 149
- Girardi et al. (2000) Girardi, L., Bressan, A., Bertelli, G., et al. 2000, Evolutionary tracks and isochrones for low- and intermediate-mass stars: From 0.15 to 7 , and from Z=0.0004 to 0.03, A&AS, 141, 371
- Girardi et al. (2002) Girardi, L., Bertelli, G., Bressan, A., et al. 2002, Theoretical isochrones in several photometric systems. I. Johnson-Cousins-Glass, HST/WFPC2, HST/NICMOS, Washington, and ESO Imaging Survey filter sets, A&A, 391, 195
- Grocholski & Sarajedini (2002) Grocholski, A. J., & Sarajedini, A. 2002, WIYN open cluster study. X. The -band magnitude of the red clump as a distance indicator, AJ, 123, 1603
- Groenewegen (2008) Groenewegen, M. A. T. 2008, The red clump absolute magnitude based on revised Hipparcos parallaxes, A&A, 488, 935
- Hasegawa et al. (2008) Hasegawa, T., Sakamoto, T., & Malasan, H. L. 2008, New Photometric Data of Old Open Clusters II. A Dataset for 36 Clusters, PASJ, 60, 1267
- Janes & Phelps (1994) Janes, K. A., & Phelps, R. L. 1994, The galactic system of old star clusters: The development of the galactic disk, AJ, 108, 1773
- Jacobson et al. (2016) Jacobson, H. R., Friel, E. D., Jílková, L., et al. 2016, The Gaia-ESO Survey: Probes of the inner disk abundance gradient, A&A, 591, A37
- Kaluzny (1994) Kaluzny, J. 1994, CCD photometry of distant open clusters. I. Berkeley 22, Berkeley 29 and Berkeley 54, A&AS, 108, 151
- Karaali et al. (2013) Karaali, S., Bilir, S., Yaz Gökçe, E. 2013, Absolute magnitude calibration for red clump stars, Ap&SS, 346, 89
- Kharchenko et al. (2013) Kharchenko, N. V., Piskunov, A. E., Schilbach, E., et al. 2013, Global survey of star clusters in the Milky Way. II. The catalogue of basic parameters, A&A, 558, A53
- Kim (2006) Kim, S. C. 2006, Near-infrared photometric study of the Galactic open clusters NGC 1641 and NGC 2394 based on 2MASS data, JKAS, 39, 115
- Kim & Sung (2003) Kim, S. C., & Sung, H. 2003, Physical parameters of the old open cluster Trumpler 5, JKAS, 36, 13
- Kim et al. (2005) Kim, S. C., Park, H. S., Sohn, S. T., et al. 2005, BOAO photometric survey of Galactic open clusters. III. Czernik 24 and Czernik 27, JKAS, 38, 429
- Kim et al. (2009) Kim, S. C., Kyeong, J., & Sung, E.-C. 2009, Near-Infrared Photometric Study of the Old Open Cluster Trumpler 5, JKAS, 42, 135
- Kim et al. (2012) Kim, S. C., Park, H. S., Kyeong, J., et al. 2012, Distance and reddening of the isolated dwarf irregular galaxy NGC 1156, PASJ, 64, 23
- Krisciunas et al. (2015) Krisciunas, K., Monteiro, H., Dias, W. 2015, CCD photometry of NGC 2482 and five previously unobserved open star clusters, PASP, 127, 31
- Kyeong et al. (2011) Kyeong, J., Moon, H.-K., Kim, S. C., et al. 2011, 2MASS near-IR color-magnitude diagram of the old open cluster King 11, JKAS, 44, 33
- Landolt (1992) Landolt, A. U. 1992, photometric standard stars in the magnitude range around the celestial equator, AJ, 104, 340
- Landolt (2007) Landolt, A. U., & Uomoto, A. K. 2007, Optical multicolor photometry of spectrophotometric standard stars, AJ, 133, 768
- Landolt (2009) Landolt, A. U. 2009, UBVRI Photometric Standard Stars Around the Celestial Equator: Updates and Additions, AJ, 137, 4186
- Lang et al. (2010) Lang, D., Hogg, D. W.; Mierle, K., Blanton, M., & Roweis, S., 2010, Astrometry.net: Blind astrometric calibration of arbitrary astronomical images, AJ, 139, 1782
- Lee & Kim (2000) Lee, M. G., & Kim, S. C. 2000, Stellar populations of the Sagittarius dwarf irregular galaxy, AJ, 119, 777
- Lyngå (1987) Lyngå, G. 1987, Catalogue of Open Cluster Data (Observatoire de Strassbourg, Centre de Données Stellaires)
- Netopil et al. (2016) Netopil, M., Paunzen, E., Heiter, U., et al. 2016, On the metallicity of open clusters. III. Homogenised sample, A&A, 585, A150
- Oliveira et al. (2013) Oliveira, A. F., Monteiro, H., Dias, W. S., et al. 2013, Fitting isochrones to open cluster photometric data. III. Estimating metallicities from UBV photometry, A&A, 557, A14
- Önal Taş et al. (2016) Önal Taş, Ö., Bilir, S., Seabroke, G. M., et al. 2016, Local stellar kinematics from RAVE data - VII. Metallicity gradients from red clump stars, PASA, 33, 44
- Özdönmez et al. (2016) Özdönmez, A., Güver, T., Cabrera-Lavers, A., et al. 2016, The distances of the Galactic novae, MNRAS, 461, 1177
- Paczyński & Stanek (1998) Paczyński, B., & Stanek, K. Z. 1998, Galactocentric distance with the optical gravitational lensing experiment and HIPPARCOS red clump stars, ApJ, 494, L219
- Park & Lee (1999) Park, H. S., & Lee, M. G. 1999, charge-coupled device photometry of two old open clusters NGC 1798 and 2192, MNRAS, 304, 883
- Paunzen et al. (2010) Paunzen, E., Heiter, U., Netopil, M., et al. 2010, On the metallicity of open clusters I. Photometry, A&A, 517, A32
- Piatti et al. (1995) Piatti, A. E., Claria, J. J., Abadi, M. G. 1995, Chemical evolution of the Galactic disk: Evidence for a gradient perpendicular to the Galactic plane, AJ, 110, 2813
- Piskunov et al. (2006) Piskunov, A. E., Kharchenko, N. V., Röser, S., et al. 2006, Revisiting the population of Galactic open clusters, A&A, 445, 545
- Rudolph et al. (2006) Rudolph, A., Fich, M., Bell, G. R., et al. 2006, Abundance gradients in the Galaxy, ApJS, 162, 346-374
- Ruprecht (1966) Ruprecht, J. 1966 Classification of open star clusters, Bull. Astron. Inst. Czech., 17, 33
- Ryu & Lee (2011) Ryu, J., & Lee, M. G. 2011, A photometric study of five open clusters in the SDSS, JKAS, 44, 177
- Sarajedini (1999) Sarajedini, A. 1999, WIYN open cluster study. III. The observed variation of the red clump luminosity and color with metallicity and age, AJ, 118, 2321
- Skrutskie et al. (1997) Skrutskie, M. F., Schneider, S. E., Stiening, R., et al. 1997, The Two Micron All Sky Survey (2MASS): Overview and Status, in The Impact of Large Scale Near-IR Sky Surveys, eds. F. Garzón, N. Epchtein, A. Omont, B. Burton and P. Persi, Kluwer (Netherlands), 25
- Skrutskie et al. (2006) Skrutskie, M. F., Cutri, R. M., Stiening, R., et al. 2006, The Two Micron All Sky Survey (2MASS), AJ, 131, 1163
- Stanek & Garnavich (1998) Stanek, K. Z., & Garnavich, P. M. 1998, Distance to M31 with the Hubble Space Telescope and HIPPARCOS red clump stars, ApJ, 503, L131
- Stanghellini, & Haywood (2010) Stanghellini, L., & Haywood, M. 2010, The Galactic structure and chemical evolution traced by the population of planetary nebulae, ApJ, 714, 1096
- Stetson (1990) Stetson, P. B.1990, On the growth-curve method for calibrating stellar photometry with CCDs, PASP, 102, 932
- Sung et al. (2013) Sung, H., Lim, B., Bessell, M. S., et al. 2013, Sejong Open Cluster Survey (SOS). 0. Target Selection and Data Analysis, JKAS, 46, 103
- Tadross (2003) Tadross, A. L. 2003, Metallicity distribution on the Galactic disk, NewA, 8, 737
- Tadross (2011) Tadross, A. L. 2011, A catalog of 120 NGC open star clusters, JKAS, 44, 1
- Tissera et al. (2016) Tissera, P. B., Machado, R. E. G., Sanchez-Blazquez, P., et al. 2016, The stellar metallicity gradients in galaxy discs in a cosmological scenario, A&A, 592, A93
- Trumpler (1930) Trumpler, R. J. 1930, Preliminary results on the distances, dimensions and space distribution of open star clusters, LicOB, 14, 154
- Twarog et al. (1997) Twarog, B. A., Ashman, K. M., Anthony-Twarog, B. J. 1997, Some Revised Observational Constraints on the Formation and Evolution of the Galactic Disk, AJ, 114, 2556
- Wan et al. (2015) Wan, J.-C., Liu, C., Deng, L.-C., et al. 2015, Red clump stars from the LAMOST data I: identification and distance, RAA, 15, 1166
- Wu et al. (2009) Wu, Z.-Y., Zhou, X., Ma, J., et al. 2009, The orbits of open clusters in the Galaxy, MNRAS, 399, 2146
- Xiang et al. (2015) Xiang, M.-S., Liu, X.-W., Yuan, H.-B., et al. 2015, The evolution of stellar metallicity gradients of the Milky Way disk from LSS-GAC main sequence turn-off stars: a two-phase disk formation history?, RAA, 15, 1209
- Yaz Gökçe et al. (2013) Yaz Gökçe, E., Bilir, S., Öztürkmen, N. D., et al. 2013, First identification and absolute magnitudes of the red clump stars in the Solar neighbourhood for WISE, NewA, 25, 19
- Yong et al. (2008) Yong, D., Karakas, A. I., Lambert, D. L., et al. 2008, Heavy element abundances in giant stars of the globular clusters M4 and M5, ApJ, 689, 1031