Free energy landscape of dissociative adsorption of methane on ideal and defected graphene from ab initio simulations
Abstract
We study the dissociative adsorption of methane at the surface of graphene. Free energy profiles, which include activation energies for different steps of the reaction, are computed from constrained ab initio molecular dynamics. At 300 , the reaction barriers are much lower than experimental bond dissociation energies of gaseous methane, strongly indicating that graphene surface acts as a catalyst of methane decomposition. On the other hand, the barriers are still much higher than on nickel surface. Methane dissociation therefore occurs at a higher rate on nickel than on graphene. This reaction is a prerequisite for graphene growth from precursor gas. Thus, the growth of the first monolayer should be a fast and efficient process while subsequent layers grow at diminished rate and in a more controllable manner. Defects may also influence reaction energetics. This is evident from our results, in which simple defects (Stone-Wales defect and nitrogen substitution) lead to different free energy landscapes at both dissociation and adsorption steps of the process.
I Introduction
The process of activated adsorption of methane on transition metals has been under thorough experimental and theoretical examination. Pioneering work in this field was reported by Winters in 1975 Winters (1975). Results obtained from kinetic studies of methane adsorption on atomically clean tungsten surface placed in ultrahigh vacuum chamber showed that the dissociative chemisorption reaction is favored:
A number of different transition metal surfaces was studied in a similar manner, including nickel (100), (110) and (111) faces Beebe et al. (1987); Ølgaard Nielsen et al. (1995); Egeberg et al. (2002). All these studies indicated a high temperature dependence of dissociation probabilities of CH4 on Ni. More intricate details of the reaction mechanism on Ni have been unraveled in molecular beam experiments Lee et al. (1986); Holmblad, Larsen, and Chorkendorff (1996); Holmblad, Wambach, and Chorkendorff (1995); Luntz (1995) and in state-resolved measurements Juurlink et al. (1999); Schmid et al. (2002) that attributed increased reactivity to excitations of specific modes in CH4 ( and ). Also the sticking probabilities obtained from first-principles calculations in the framework of density functional theory (DFT) calculations were in fairly good agreement with experimental data Kratzer, Hammer, and No/rskov (1996); Tiwari, Nave, and Jackson (2009). A detailed review of the advancements in the subfield of dissociative chemisorption dynamics on metals can be found in Ref. Luntz and Beck, 2017.
CH4 decomposition reactions on other metals were also studied with DFT in a few earlier papers, namely on copper Zhang et al. (2017), iridium Henkelman and Jónsson (2001), and copper alloys, Cu-Fe Tian et al. (2018) and Ni-Cu He et al. (2015).
DFT calculations of adsorption (in fact physisorption) of CH4 on graphene have also been carried out Zhao and Meng (2013); Hwang, Jeong, and Lee (2016); Anithaa, Shankar, and Vijayakumar (2017). The CH4 decomposition reactions on graphene were recently studied in the framework of classical molecular dynamics Lin, Yuan, and Zhao (2017). To this day, however, we are not aware of such studies in the framework of AIMD.
In recent years, catalytic dissociation of CH4 on metals has been utilized in graphene CVD growth process. In particular, nickel is a suitable substrate for growth of large, high-quality graphene layers Reina et al. (2009). It allows for fabrication of monolayer and few-layers-thick graphene. Controlled bilayer graphene growth on Cu-Ni alloys has also been demonstrated Wu et al. (2012). Theoretically, dissociation of methane on Ni(111) surface has been studied with ab initio molecular dynamics (AIMD) and activation energies for dissociation steps have been computed Arifin et al. (2015). These studies described just the initial step of the growth process that has to occur before the first layer can be formed.
In this study we use an ab initio framework to compute accurate and realistic free energy profiles for a series of subsequent steps which amount to dissociative chemi- and physisoprption of methane on monolayer graphene. The study profits from high performance computing capabilities. They are utilized to provide long simulation times and system size that allows to capture interesting surface phenomena. In particular, we study two types of chemical processes. We consider first the sequential dehydrogenation of methane and then the adsorption process of methane fragments CHn () to the graphene layer. We consider the above-mentioned processes in pristine and defected graphene and point out that the structural defects, such as the Stone-Wales defect or nitrogen substitutional impurity, influence the dynamics of methane’s fragments dehydrogenation and adsorption. In the context of growth processes, the considered chemical reactions are crucial for the growth of the second graphene layer in a chemical vapor deposition process with methane as precursor.
In previous studies, graphene geometry on Ni(111) substrate has been studied experimentally by low-energy electron diffraction and by modelling in the DFT framework. While the interlayer separation is around 2.0-2.1 , there is no evidence of to rehybridization Wintterlin and Bocquet (2009). The adsorption energy of a graphene monolayer on nickel is typical for physisorption Mittendorfer et al. (2011). For a similarly bound graphite system, it has been shown that neighboring carbon layers have weak influence on adsorption energy Liu and Wilcox (2011). It is therefore reasonable to assume that a model that contains only the outermost atomic layer is sufficient to capture adsorption phenomena that occur on nickel-suspended graphene with sufficient accuracy.
The determination of energy barriers for CH4 decomposition in subsequent dehydrogenation steps and comparison with the corresponding barriers for CH4 decomposition on Ni surface (taken from Ref. Arifin et al., 2015) will allow us to compare the rates at which C atoms are delivered for graphene growth at each surface. Faster CH4 decomposition on Ni should favor the graphene monolayer growth, and the faster decomposition on graphene should favor growth of islands. Since it is already known that monolayers of graphene are obtained in the CVD process on Ni surface, we expect that the energy barriers for the CH4 decomposition are lower for the nickel surface than for graphene. Nevertheless, confirmation of this fact on the basis of quantum-mechanical theory and determination of the catalytic features of graphene for important chemical reaction such as CH4 decomposition seems to be of interest for general field of chemical reactions of gas-phase molecules on solid surfaces.
The calculation scheme we employ in simulations is detailed in Section II, where the geometry of the calculated systems is also described. Further on in Section III, we demonstrate and discuss obtained free energy profiles of decomposition (Section III.1) and adsorption (Section III.2) of methane and related species on graphene. We also examine electron density distribution maps (Section III.3) of pristine graphene and graphene with admolecules, which provide us some hints how the surface reacts to adsorption of different species.
II Methods
II.1 Computational approach
Reaction free energies have been computed from AIMD simulations. To sample the reactions with high precision but long computation times, a scheme to accelerate sampling has been used. There are several ways to address the issue of slow sampling in AIMD, each with their strengths and drawbacks Chipot and Pohorille (2007); Trzesniak, Kunz, and van Gunsteren (2007). For the system in question, we have selected the constraint-based simulation that ensures uniform sampling of the relatively simple reaction coordinate (RC).
The graphene monolayer has been simulated with a 4x4 hexagonal supercell with unit cell parameters and . Cell parameter corresponds to most often reported experimental lattice constant of graphene (2.46 for the primitive unit cell). High value of ensures minimal interaction between neighboring periodic images. The resulting layer of vacuum is wider than typically found in literature for similar systems Mittendorfer et al. (2011); Tian et al. (2018); He et al. (2015). The system is comprised of 32 in-plane carbon atoms and a single adsorbate molecule (left side of reaction equations). The full system geometry is visible in Figure 1. The size of the supercell allows for relaxation of the system towards the most stable atomic configuration, therefore encapsulating the most important effects. As CHn molecules are chemisorbed to the surface, the hybridization of the in-plane carbon changes from to . With that change, the local geometry shifts from planar to buckled. This affects also the neighboring atoms that are pulled slightly above the graphene plane. The present choice of the supercell guarantees that this effect is accounted for properly. A smaller supercell would hinder this movement resulting in strained geometry of the simulated system.
AIMD simulations have been performed with holonomic constraints imposed on the RC. A constraint force is introduced at each time step to keep the RC fixed. At the end of each simulation, the time average of the force is computed. Relative free energies of the reactions are calculated as the potential of the mean force (PMF) by numerical integration. The theoretical basis for this scheme had been laid by Carter et al. Carter et al. (1989) and then it received a number of developments Mülders et al. (1996); den Otter and Briels (1998); Sprik and Ciccotti (1998); den Otter (2000); Darve and Pohorille (2001); Schlitter and Klähn (2003). This approach is rooted in the thermodynamic integration approach first conceived by Kirkwood in 1935 Kirkwood (1935). Integration is done from low to high RC values.
The constraint is introduced as an additional term in the extended Lagrangian of the system:
In the last term, defines the geometric constraints, is the number of constraints employed, and are the associated Lagrange multipliers. These can be interpreted as the force that is required to keep the geometric constraint fixed. They are recalculated at each time step using the SHAKE/RATTLE Ryckaert, Ciccotti, and Berendsen (1977); Andersen (1983) algorithm. In principle, an arbitrary number of constraints can be included in the Lagrangian, but for the purpose of the present study, we limit ourselves to just one constraint.
Over the course of the simulations, data on is gathered and the mean force (MF) is computed. To obtain the free energy profile, we calculate the potential of mean force (PMF) by integrating the MF:
Integration bounds r1 and r2 are chosen arbitrarily for each reaction. The upper bound r2 is in the range of 3.1-4.0 . Depending on the species, the free energy profiles show different asymptotic behavior at high RC values. In some cases, vanishes exactly at high RC, which produces a flat tail in the free energy profile. If the opposite is true, an ascending or descending tail appears. This suggests spurious interaction that would vanish given a high enough r2 value.
Positive values of the constraint force mean that the constraint holds the molecule together, when it would otherwise decompose. Negative values mean that the constraint pushes the atoms apart. The equilibrium value of the constraint corresponds to the free energy minimum, where the force vanishes and changes sign from positive to negative.
In our studies the calculations are performed as follows. First, the graphene backbone is equilibrated for 1.8 without adsorbate molecules. Then, the calculation is split into segments for each value of the reaction coordinate, and the following procedure is carried out for each segment:
-
•
Initial positions of the in-plane carbon atoms are taken from the equilibration run. The adsorbate molecule is then added close to the surface and the ground state is found using DFT.
-
•
The system is equilibrated for 1500 MD steps, and then the simulation is started with ground state electronic density found in step 1 and velocities from graphene backbone equilibration.
-
•
After equilibration, ground state calculation is performed once more.
-
•
The MD simulation is started from the new ground state and equilibrated positions and velocities. The production takes 15000 additional MD steps.
At the time step of 4 atomic units (0.096 ), the equilibration period is equal to 144 and the production run during which data is gathered takes 1.44 . Total simulation time is equal to 43.20 for each reaction step.
For molecular dynamics runs, we use the Car-Parrinello method Car and Parrinello (1985). All equilibrations are performed in the canonical ensemble using the Nosé-Hoover chain thermostat Nosé (1984); Hoover (1985). Ionic thermostat is set to target temperature of 300 .
Forces required to perform the MD simulations are Hellmann-Feynmann forces obtained via plane wave DFT Hohenberg and Kohn (1964); Kohn and Sham (1965) calculations carried out with the CPMD package IBM Corp. and MPI für Festkörperforschung Stuttgart (2013). Gradient-corrected Becke-Lee-Yang-Parr Becke (1988); Lee, Yang, and Parr (1988) approximation of the exchange-correlation functional is used along with Troullier-Martins-type norm-conserving pseudopotentials Troullier and Martins (1991) constructed by Boero for hydrogen and carbon Boero, Parrinello, and Terakura (1998). Kohn-Sham orbitals are expanded in the plane-wave basis set with the kinetic energy cutoff of 70 Ry, on par with previous studies of hydrocarbon systems Ambrosch-Draxl et al. (1995); Spanu et al. (2011). The DFT-D2 semi-empirical dispersion correction by Grimme Grimme (2006) is used to account for van der Waals interaction. Brillouin Zone sampling was limited to the point. See Supplemental Information for the results of convergence testing with respect to k-point grid density. Tests reveal fair convergence but as integration errors accumulate along the path the behavior at high RC values becomes volatile.
III Results and discussion
Before outlining our findings, let us briefly describe our system geometries. In our calculations we have included pristine graphene (PG) geometry and two defected geometries – Stone-Wales-defected graphene (SWG) and N-substituted graphene (NSG).
-
•
SWG is obtained from PG by a simple rearrangement of atoms which involves rotating one of the C-C bonds by 90 degrees Stone and Wales (1986). This introduces strain that is released by out-of-plane buckling around the defect Ma et al. (2009). In a previous study of adsorption energetics via static DFT calculations we have investigated adsorption profiles of and CH3 on different atomic sites of SWG Wlazło and Majewski (2016). Adsorption sites close to the SW defect were favored over more distant ones. In this work we attempt to see if earlier conclusions extend to more realistic scenarios simulated here.
-
•
NSG features a single substitution of a carbon atom in graphene with a nitrogen atom. N-doped graphene has been demonstrated to have exceptional catalytic properties towards various reduction reactions Shao et al. (2010). Here we aim to see if this effect translates to a simulation of reactions occurring in the vicinity of a single in-plane dopant atom.
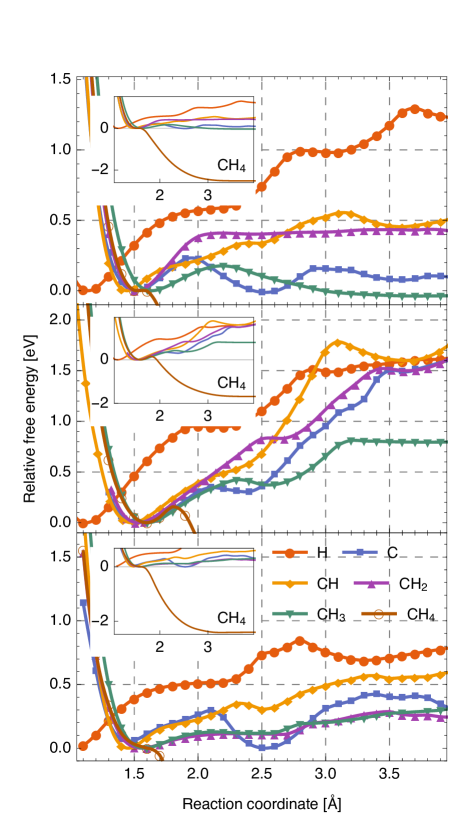
Obtained relative free energy profiles are depicted in Figures 2 and 4. In addition, Tables 1 and 2 list RC values and energy barriers for quick comparison. Each energy profile is shifted so that zero energy corresponds either to the global energy minimum (in case of decomposition reactions), or the chemisorption minimum (for adsorption reactions).
III.1 CHn decomposition
We start presentation of results with catalytic methane decomposition on graphene. The process, starting from the methane molecule (CH4) and ending with the C atom, can be broken down into four reaction steps:
| (1) | ||||
| (2) | ||||
| (3) | ||||
| (4) |
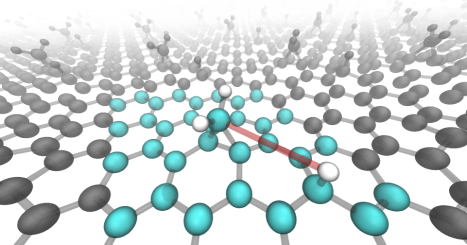
As the product of each step, we obtain a and H radicals chemisorbed at the surface (as seen e.g. in Figure 1 and Figure 3). Each simulation has been started with the CHn molecule close to the surface. For CH4, the starting position was chosen arbitrarily. For other molecules, the final configuration of the previous reaction step was taken as the initial position. The bond length between one of the hydrogen atoms and the carbon was selected as the RC. The rest of the C-H and C-C bonds in the system are allowed to fluctuate freely.
| Species | BDE () Berkowitz, Ellison, and Gutman (1994); Ruscic, Litorja, and Asher (1999) | Decomposition barrier on Ni(111) () Arifin et al. (2015) | Decomposition barrier () | Transition state RC () | Activation energy for reverse reaction () | Second minimum RC () | |
| NEB (0 ) | MD (1500 ) | ||||||
| 4.55 | 0.78 | 0.72 | 1.37 | 1.94 | 0.50 | 3.04 | |
| 0.84 | 1.67 | 0.68 | 3.26 | ||||
| 1.81 | 2.28 | 0.00 | – | ||||
| 4.79 | 0.81 | 0.47 | 2.03 | 2.52 | – | – | |
| 2.07 | 2.47 | – | – | ||||
| 2.03 | 2.36 | 0.05 | 2.81 | ||||
| 4.39 | 0.27 | 0.23 | 2.04 | 2.38 | 0.00 | – | |
| 1.33 | 1.97 | – | – | ||||
| 1.97 | 2.87 | – | – | ||||
| 3.51 | 1.23 | 0.42 | 1.68 | 2.17 | 0.07 | 2.63 | |
| 1.37 | 1.92 | 0.42 | 2.75 | ||||
| 2.03 | 2.51 | 0.00 | – | ||||
III.1.1 Pristine graphene

In the first AIMD simulation series, we have studied CH4 decomposition on PG. The reaction barriers for subsequent steps are listed in Table 1. They range from 1.37 for CH4 up to 2 for CH2 and CH3. Experimental bond-dissociation energies of the C-H bonds in gaseous species range between 3.51 and 4.79 Blanksby and Ellison (2003). This means that the graphene surface has a significant catalytic effect in hydrocarbon dissociation reactions.
The free energy profiles for subsequent steps of CH4 decomposition on graphene along the reaction coordinate (as seen for CH3 decomposition in Figure 1) are depicted in Figure 2(a). They all feature a deep minimum at the equilibrium C-H bond length of 1.1 . The initial slope of the free energy profile upon leaving the equilibrium is very similar for every step. The magnitude of the energy barriers, the presence and depth of a second free energy minimum depends on the reaction in question, as described below.
-
(1)
The first reaction is the removal of hydrogen atom from the complete methane molecule (CH4). The energy barrier for removal is the lowest among the four reactions (Eqs. (1)-(4)) and equal to 1.37 . The transition state is located at RC = 1.94 . The considerable depth of the second energy minimum shows that the reaction leads to a stable product. The reverse reaction for this step is the least probable.
-
(2)
The stability of the product of reaction (1) is also evident in the energy profile of the second decomposition step. Together with CH2 decomposition barrier, it is the highest among the four reaction stages and equal to 2.04 . The transition state is located at 2.52 . In the simulated RC range, the system does not reach a second free energy minimum.
-
(3)
The energy barrier for H removal from CH2 is similar to the case of CH3 with an even higher transition state at 2.38 . The product is highly unstable, as evident by the lack of second energy minimum. The product can easily undergo a reverse reaction. This likely makes CH2+2H the most stable decomposed state of methane on graphene.
-
(4)
The last removal of H has a slightly lower energy barrier of 1.68 . The transition state is only slightly higher than for CH4 at 2.18 . The second energy minimum is deeper than for CH2. Thus the reverse reaction should be less probable than for the previous step.
III.1.2 Stone-Wales-defected graphene
In the subsequent series of calculations, reactions (1)-(4) have been simulated for the case of graphene with the Stone-Wales defect (i.e., with the supercell containing the SW defect). Initially, the CH4 molecule has been placed directly over the defect site. The resulting free energy profiles depicted in Figure 2(b) are quite different in both shape and magnitude of energy barriers as compared to the case of dehydrogenation reactions (Eqs. (1)-(4)) at pristine graphene that have been discussed above.
The first stage reaction (Eq. (1)) has an even lower energy barrier compared to the same reaction occurring on pristine graphene at 0.84 . In fact, this barrier is the lowest among all studied reactions for all investigated configurations. The barrier is also lowered by a slightly lesser degree in case of reactions (3) and (4). They are comparable to reaction (1) on PG. Reaction (2) has a similar barrier as the corresponding reaction on PG.
III.1.3 N-defected graphene
Finally, reaction steps of methane decomposition (1)-(4) were simulated in a cell with a single in-plane carbon atom substituted with nitrogen. In this case, the free energy profiles (see Figure 2(c)) have a similar shape to one another. With the exception of CH2, the profiles flatten out at RC between 2.28 and 2.51 after a transition state is reached.
The energy barriers together with the characteristic value of the reaction coordinates for the dehydrogenation reactions described in this section are summarized in Table 1. For comparison, the literature values for the decomposition barriers of isolated gaseous species and the barriers for dehydrogenation of methane fragments on (111) surface of nickel are also given there. It is apparent that both nickel surface and graphene monolayer act as catalysts for the decomposition of methane, with nickel surface being the stronger catalyst. These findings shed light on the mechanisms of the growth process of the first graphene layer on nickel surface and then the growth of the subsequent second graphene layer in a CVD growth process involving the methane precursor.
III.2 Adsorption of CHn decomposition products
| Species | RC () of chemisorbed molecule | Desorption barrier () | RC () of transition state | Activation energy for chemisorption () |
|---|---|---|---|---|
| – | 0.00 | – | 2.51 | |
| 1.60 | 0.16 | 1.81 | 1.84 | |
| – | 0.00 | – | 2.41 | |
| 1.64 | 0.18 | 2.19 | 0.21 | |
| 1.60 | 0.42 | 2.31 | 0.05 | |
| 1.58 | 0.13 | 2.13 | 0.01 | |
| 1.57 | 0.41 | 2.18 | – | |
| 1.53 | 0.84 | 2.57 | 0.00 | |
| 1.56 | 0.11 | 2.31 | 0.00 | |
| 1.44 | 0.55 | 3.14 | 0.10 | |
| 1.48 | 1.79 | – | – | |
| 1.45 | 0.35 | 2.33 | 0.05 | |
| 1.51 | 0.23 | 1.95 | 0.24 | |
| 1.52 | 0.35 | 2.11 | 0.04 | |
| 1.45 | 0.24 | 2.10 | 0.30 | |
| 1.14 | 1.00 | 2.84 | 0.01 | |
| 1.12 | 0.96 | 2.00 | 0.02 | |
| 1.10 | 0.85 | 2.80 | 0.16 |
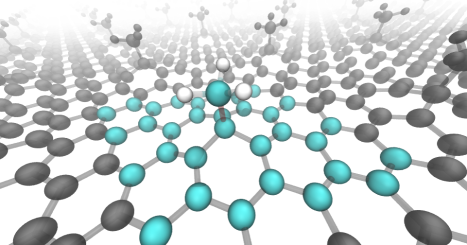
In the previous section we have described the energetics of the chemical reactions leading to sequential decomposition of methane molecules. Here we focus on adsorption processes of CH4 and fragments emerging from the previous dehydrogenation reactions, i.e., CH3, CH2, CH, C, and H, on pristine and defected graphene with Stone-Wales defects and substitutional nitrogen. To investigate the adsorption processes, we perform a series of simulations employing the computational scheme from Section II. In these simulations, we set the reaction coordinate as the distance between an in-plane C atom in graphene and the C or H atom in the adsorbed species (see Figure 3 illustrating the geometry of CH3 adsorbed at pristine graphene).
Depending on the species, we observe direct chemisorption (or lack thereof in case of CH4) either on the “top” or “bridge” site in graphene. Adsorption on “top” involves the creation of a single bond between a surface atom and the adsorbate. This is the case for species that have one unpaired electron, i.e. CH3, C and H. This configuration can be seen in Figure 3. Species adsorbed on the “bridge” site – CH2 and CH – have at least two unpaired electrons. Upon adsorption, two bonds are created and the species is adsorbed between in-plane carbon atoms as seen in Figure 1. Besides the two figures referenced in this section, atomic configurations for other reactions can be viewed in online supplemental materials (Figure S3 and S4).
Generally, the shape of free energy profiles is more complex compared to CHn decomposition steps. This is due to different interactions that determine bonding between the molecules and the surface. Moving from low to high RC values, the first and usually deepest minimum corresponds to chemisorption equilibrium. Here, covalent bonding is the strongest and dominates over other interactions. For higher values of RC, chemisorption becomes much weaker and non-covalent bonding via van der Waals forces leads to physisorption of some species.
III.2.1 Adsorption on ideal graphene
We start the discussion of the adsorption processes considering adsorption of CHn () and H to pristine graphene. The free energy profiles as the function of the reaction coordinate are depicted in Figure 4(a) and the energies of barriers and critical reaction coordinates are presented in Table 2. The listed barriers correspond to the free energy difference between the chemisorbed state and the transition state (desorption barrier) and between the physisorbed state and the transition state (activation energy for physisorption). The picture of adsorption processes that emerges from these calculations can be summarized as follows.
: The full methane molecule does not undergo stable chemisorption. Free energy declines monotonically with increasing RC. The lack of free electrons causes strong repulsion between the surface and the molecule. The energy barrier for CH4 approach to the surface is estimated at around 2.51 .
: The methyl radical (CH3) shows stable chemisorption. The barrier for desorption is calculated to be equal to 0.18 . There is another minimum on the other side of the transition state. It corresponds to a physisorbed state and its depth is similar to the chemisorption minimum – the barrier in the other direction is equal to 0.21 . This shows that for this radical there is no strong dominance of one type of bonding.
: The barrier for desorption from a stable chemisorbed state is equal to 0.41 . This is roughly twice the barrier for CH3 desorption. This is possibly due to the fact that CH2 forms two covalent bonds with the surface (see Figure 1). We examine this effect in more detail in Section III.3. In this case, there is no stable physisorption, indicated by a flat energy profile above the transition state.
CH: This radical with three unpaired electrons has a complicated adsorption free energy profile that cannot be interpreted as easily as in the case of CH4, CH3 and CH2. The chemisorption minimum lies lower than for CH3 and CH2. Then the free energy rises to a transition state located at RC equal to 3.14 . The barrier to reach the transition state from the chemisorption minimum is 0.55 . The slope of the profile is not constant and it flattens out at around 2.4 with the relative free energy equal to ca. 0.3 . A second shallow minimum appears at RC=3.6 . The height of the barrier for the reverse reaction is equal to 0.1 .
C: For atomic carbon the chemisorption minimum is closer to CH2 minimum. The first transition state is reached after climbing a barrier of 0.23 . This value is similar in magnitude to the CH3 transition state but its RC is slightly lower at 1.95 . C features two separated physisorption minima. One of them is similar in depth to the chemisorption minimum. The other, separated from the first by a barrier of 0.08 , is relatively broad and shallow.
H: The chemisorption minimum is located at lower RC than for CHn molecules due to the shorter equilibrium C-H bond length. The shape of the free energy profile is similar to CH: a maximum that can be associated with a transition state lies at ca. 2.8 . There is also a brief flattening at 2.12 and 0.58 . There is a physisorption minimum above the transition state. The barrier to reach it from the chemisorbed state is equal to ca. 1 . There is another transition state at the free energy maximum at RC=3.7 . The next minimum or plateau is not reached in the simulated RC range.
Further, we have investigated how the adsorption reactions can be modified by the presence of defects, and we turn first to the adsorption of CHn molecules and radicals in the neighborhood of SW defects in graphene.
III.2.2 Adsorption on Stone-Wales-defected graphene
In general, adsorption free energy profiles on SW-defected graphene (Figure 4(b)) are more steep than on ideal graphene. This supports a previous finding that this defect induces stronger binding of methane decomposition products Wlazło and Majewski (2016). Four of the profiles – for C, CH, CH2 and CH3 follow a similar shape after leaving the equilibrium state. They begin to diverge as different species reach their first transition state. However, they still follow each other closely. With the exception of CH3 and CH4, all species end up at similar relative free energy values at the end of the simulated RC ranges. For pristine graphene, the profiles look more divergent at high RC. However, the difference between the highest (H) and lowest (CH3) relative energy (excluding CH4) is similar for pristine and SW graphene.
Let us now look how the free energy curves for the adsorption process change on nitrogen substitutional impurity.
III.2.3 Adsorption on N-defected graphene
Free energy profiles of CHn adsorption close to the nitrogen atom (Figure 4(c)) are either mostly unchanged (for C) or flattened (for H, CH, CH2, CH3) compared to pristine graphene. For C the difference lies mostly in the depth of the second minimum at 2.53 . The barrier for desorption (in the direction of low to high RC) is higher than in case of chemisorption. CH3 and CH2 fragments are chemisorbed very weakly to the surface – their desorption is associated with the lowest desorption barriers among the studied surface geometries. These results suggest that the N substitution is associated with weaker covalent bonding at the defect, even though intuitively this region should be electron-rich and thus promote chemisorption. The profiles as a whole are significantly more convergent at high RC limit.
To shed light on the mechanisms of the adsorption process, we have also investigated the changes of the electronic densities around the adsorbed species.
III.3 Electron density near adsorption sites
In this section we examine how adsorption of different species influences electron density in the vicinity of adsorption sites. For pristine graphene, calculated density distribution forms an uniform hexagonal lattice that mirrors the atomic configuration of carbon atoms and the bonds between them (see Figure 5). The regions in the middle of carbon rings are depleted of electrons and separated by electron-rich bonds.
Upon chemisorption, some density is transferred from the surface to the adsorbed molecule. This creates an in-plane region of charge depletion. The effect is highly dependent on the type of admolecule. Two of the configurations, and , analyzed in Section III.2.1, are plotted in Figure 5. For CH3, the adsorption site is a single in-plane carbon atom that forms a covalent bond with the carbon atom in the CH3 radical. Density distribution is affected significantly only around the adsorption site.
In the case of CH2, the adsorption site is formed by two carbon atoms that create bonds via two unpaired electrons of the CH2 radical. A large area of low electron density is formed through merging of electron-depleted regions in the middle of four hexagonal rings, just the ones that include the adsorption site atoms. Density distribution in the neighboring rings is affected to a greater degree than for CH3. The change in electron density distribution is more pronounced than in the former case. This means that CH2 adsorption and desorption processes induce a more dramatic change in the electronic structure of the graphene substrate. A similar conclusion can be drawn from data presented in Table 2 and figures in Section III.2. In case of pristine graphene and SW-defected graphene, the magnitudes of the energy barriers for CH2 desorption are roughly two times higher than for CH3. This also indicates that the CH2 adsorption/desorption reactions are more complex. On the other hand, the same process on nitrogen-substituted graphene has a similar barrier for CH3 and CH2, which can be attributed to the fact that the N substitution itself influences the density distribution.
IV Conclusions
First principles molecular dynamics simulations with constraints have allowed us to determine the free energy landscape of dissociative adsorption of methane on graphene. We find that the presence of graphene, either pristine or with two types of defects, lowers the energy barrier for CH4 decomposition in subsequent dehydrogenation steps compared to experimentally determined values for gaseous species. This indicates catalytic properties of graphene for the reaction of methane decomposition. Generally, the presence of defect does not change qualitative picture of decomposition and adsorption processes. In particular, we observe considerably low energy barrier for dehydrogenation reaction at Stone-Wales defect, similar in barrier reported for such reaction in the case of nickel surface used as catalyst. However, the energy barriers for all four steps of the decompositions on Ni surface are much lower than in the case of graphene (pristine or defected), indicating that the decomposition process is faster on Ni than on graphene. This explains the observed in experiments uniform growth of monolayer graphene on Ni surface (Frank-van der Merve like growth mode) and not growth of multilayered graphene islands (in the Volmer-Weber mode).
Free energy curves for adsorption exhibit more features than the ones for dehydrogenation. Due to the fact that interactions along the reaction paths are weaker, magnitudes of energy barriers are much lower. In this regime, van der Waals interactions play a significant role in the energetics of binding. Because of low energy barriers, adsorption of CHn species (n=3,2,1,0) on graphene appears to be volatile compared to dehydrogenation. In the dissociative adsorption process as a whole, the decomposition of methane gas most likely is the rate-limiting step.
Supplemental Information
The online Supplemental Information for this paper provides justification of methodology with respect to Brillouin zone sampling and comparison of AIMD free energy profiles to profiles obtained from geometry optimization. Additional figures with atomic configurations of reaction products are also provided.
Acknowledgments
The research has been performed in the framework of the ShaleSeq project (Physicochemical effects of CO2 sequestration in the Pomeranian gas bearing shales) funded / co-funded from Norway Grants in the Polish-Norwegian Research Programme operated by the National Centre for Research and Development, grant no. POL-NOR/234198/100/2014. Calculations were performed at the ICM high performance computing center, University of Warsaw, grant no. G60-8.
References
- Winters (1975) H. F. Winters, The Journal of Chemical Physics 62, 2454 (1975).
- Beebe et al. (1987) T. P. Beebe, D. W. Goodman, B. D. Kay, and J. T. Yates, The Journal of Chemical Physics 87, 2305 (1987).
- Ølgaard Nielsen et al. (1995) B. Ølgaard Nielsen, A. C. Luntz, P. M. Holmblad, and I. Chorkendorff, Catalysis Letters 32, 15 (1995).
- Egeberg et al. (2002) R. Egeberg, S. Ullmann, I. Alstrup, C. Mullins, and I. Chorkendorff, Surface Science 497, 183 (2002).
- Lee et al. (1986) M. B. Lee, Q. Y. Yang, S. L. Tang, and S. T. Ceyer, The Journal of Chemical Physics 85, 1693 (1986), http://dx.doi.org/10.1063/1.451211 .
- Holmblad, Larsen, and Chorkendorff (1996) P. M. Holmblad, J. H. Larsen, and I. Chorkendorff, The Journal of Chemical Physics 104, 7289 (1996), http://dx.doi.org/10.1063/1.471395 .
- Holmblad, Wambach, and Chorkendorff (1995) P. M. Holmblad, J. Wambach, and I. Chorkendorff, The Journal of Chemical Physics 102, 8255 (1995), http://dx.doi.org/10.1063/1.468955 .
- Luntz (1995) A. C. Luntz, The Journal of Chemical Physics 102, 8264 (1995), http://dx.doi.org/10.1063/1.468956 .
- Juurlink et al. (1999) L. B. F. Juurlink, P. R. McCabe, R. R. Smith, C. L. DiCologero, and A. L. Utz, Phys. Rev. Lett. 83, 868 (1999).
- Schmid et al. (2002) M. P. Schmid, P. Maroni, R. D. Beck, and T. R. Rizzo, The Journal of Chemical Physics 117, 8603 (2002), http://dx.doi.org/10.1063/1.1519860 .
- Kratzer, Hammer, and No/rskov (1996) P. Kratzer, B. Hammer, and J. K. No/rskov, The Journal of Chemical Physics 105, 5595 (1996), http://dx.doi.org/10.1063/1.472399 .
- Tiwari, Nave, and Jackson (2009) A. K. Tiwari, S. Nave, and B. Jackson, Phys. Rev. Lett. 103, 253201 (2009).
- Luntz and Beck (2017) A. C. Luntz and R. D. Beck, Journal of Vacuum Science & Technology A: Vacuum, Surfaces, and Films 35, 05C201 (2017), http://dx.doi.org/10.1116/1.4980145 .
- Zhang et al. (2017) Z. Zhang, X. Xu, L. Qiu, S. Wang, T. Wu, F. Ding, H. Peng, and K. Liu, Advanced Science 4, 1700087 (2017), 1700087.
- Henkelman and Jónsson (2001) G. Henkelman and H. Jónsson, Phys. Rev. Lett. 86, 664 (2001).
- Tian et al. (2018) B. Tian, T. Liu, Y. Yang, K. Li, Z. Wu, and Y. Wang, Applied Surface Science 427, 953 (2018).
- He et al. (2015) F. He, K. Li, G. Xie, Y. Wang, M. Jiao, H. Tang, and Z. Wu, Applied Catalysis A: General 506, 1 (2015).
- Zhao and Meng (2013) W. Zhao and Q. Y. Meng, in Progress in Materials and Processes, Advanced Materials Research, Vol. 602 (Trans Tech Publications, 2013) pp. 870–873.
- Hwang, Jeong, and Lee (2016) D. G. Hwang, E. Jeong, and S. G. Lee, Carbon letters 20, 81 (2016).
- Anithaa, Shankar, and Vijayakumar (2017) V. S. Anithaa, R. Shankar, and S. Vijayakumar, Structural Chemistry 28, 1935 (2017).
- Lin, Yuan, and Zhao (2017) K. Lin, Q. Yuan, and Y.-P. Zhao, Computational Materials Science 133, 99 (2017).
- Reina et al. (2009) A. Reina, X. Jia, J. Ho, D. Nezich, H. Son, V. Bulovic, M. S. Dresselhaus, and J. Kong, Nano Letters 9, 30 (2009), pMID: 19046078, http://dx.doi.org/10.1021/nl801827v .
- Wu et al. (2012) Y. Wu, H. Chou, H. Ji, Q. Wu, S. Chen, W. Jiang, Y. Hao, J. Kang, Y. Ren, R. D. Piner, and R. S. Ruoff, ACS Nano 6, 7731 (2012), pMID: 22946844, http://dx.doi.org/10.1021/nn301689m .
- Arifin et al. (2015) R. Arifin, Y. Shibuta, K. Shimamura, and F. Shimojo, European Physical Journal B 88, 1 (2015).
- Wintterlin and Bocquet (2009) J. Wintterlin and M. L. Bocquet, Surface Science 603, 1841 (2009).
- Mittendorfer et al. (2011) F. Mittendorfer, A. Garhofer, J. Redinger, J. Klimeš, J. Harl, and G. Kresse, Physical Review B - Condensed Matter and Materials Physics 84, 201401 (2011).
- Liu and Wilcox (2011) Y. Liu and J. Wilcox, Environmental Science and Technology 45, 809 (2011).
- Chipot and Pohorille (2007) C. Chipot and A. Pohorille, eds., Free Energy Calculations (Springer-Verlag, 2007).
- Trzesniak, Kunz, and van Gunsteren (2007) D. Trzesniak, A.-P. E. Kunz, and W. F. van Gunsteren, CHEMPHYSCHEM 8, 162 (2007).
- Carter et al. (1989) E. Carter, G. Ciccotti, J. T. Hynes, and R. Kapral, Chemical Physics Letters 156, 472 (1989).
- Mülders et al. (1996) T. Mülders, P. Krüger, W. Swegat, and J. Schlitter, The Journal of Chemical Physics 104, 4869 (1996).
- den Otter and Briels (1998) W. K. den Otter and W. J. Briels, The Journal of Chemical Physics 109 (1998).
- Sprik and Ciccotti (1998) M. Sprik and G. Ciccotti, The Journal of Chemical Physics 109 (1998).
- den Otter (2000) W. K. den Otter, The Journal of Chemical Physics 112 (2000).
- Darve and Pohorille (2001) E. Darve and A. Pohorille, The Journal of Chemical Physics 115 (2001).
- Schlitter and Klähn (2003) J. Schlitter and M. Klähn, The Journal of Chemical Physics 118 (2003).
- Kirkwood (1935) J. G. Kirkwood, The Journal of Chemical Physics 3 (1935).
- Ryckaert, Ciccotti, and Berendsen (1977) J. P. Ryckaert, G. Ciccotti, and H. J. C. Berendsen, Journal of Computational Physics 23, 327 (1977).
- Andersen (1983) H. C. Andersen, Journal of Computational Physics 52, 24 (1983).
- Car and Parrinello (1985) R. Car and M. Parrinello, Phys. Rev. Lett. 55, 2471 (1985).
- Nosé (1984) S. Nosé, Molecular Physics 52, 255 (1984).
- Hoover (1985) W. G. Hoover, Phys. Rev. A 31, 1695 (1985).
- Hohenberg and Kohn (1964) P. Hohenberg and W. Kohn, Phys. Rev. 136, B864 (1964).
- Kohn and Sham (1965) W. Kohn and L. J. Sham, Phys. Rev. 140, A1133 (1965).
- IBM Corp. and MPI für Festkörperforschung Stuttgart (2013) IBM Corp. and MPI für Festkörperforschung Stuttgart, “CPMD,” http://www.cpmd.org/ (1997-2013).
- Becke (1988) A. D. Becke, Phys. Rev. A 38, 3098 (1988).
- Lee, Yang, and Parr (1988) C. Lee, W. Yang, and R. G. Parr, Phys. Rev. B 37, 785 (1988).
- Troullier and Martins (1991) N. Troullier and J. L. Martins, Phys. Rev. B 43, 1993 (1991).
- Boero, Parrinello, and Terakura (1998) M. Boero, M. Parrinello, and K. Terakura, Journal of the American Chemical Society 120, 2746 (1998), http://dx.doi.org/10.1021/ja972367i .
- Ambrosch-Draxl et al. (1995) C. Ambrosch-Draxl, J. A. Majewski, P. Vogl, and G. Leising, Physical Review B 51, 9668 (1995).
- Spanu et al. (2011) L. Spanu, D. Donadio, D. Hohl, E. Schwegler, and G. Galli, Proceedings of the National Academy of Sciences 108, 6843 (2011).
- Grimme (2006) S. Grimme, Journal of Computational Chemistry 27, 1787 (2006).
- Stone and Wales (1986) A. Stone and D. Wales, Chemical Physics Letters 128, 501 (1986), http://dx.doi.org/10.1016/0009-2614(86)80661-3 .
- Ma et al. (2009) J. Ma, D. Alfè, A. Michaelides, and E. Wang, Phys. Rev. B 80, 033407 (2009), http://dx.doi.org/10.1103/PhysRevB.80.033407 .
- Wlazło and Majewski (2016) M. Wlazło and J. A. Majewski, Acta Physica Polonica A 129, A142 (2016), http://dx.doi.org/10.12693/APhysPolA.129.A-142 .
- Shao et al. (2010) Y. Shao, S. Zhang, M. H. Engelhard, G. Li, G. Shao, Y. Wang, J. Liu, I. A. Aksay, and Y. Lin, J. Mater. Chem. 20, 7491 (2010).
- Berkowitz, Ellison, and Gutman (1994) J. Berkowitz, G. B. Ellison, and D. Gutman, Journal of Physical Chemistry 98, 2744 (1994).
- Ruscic, Litorja, and Asher (1999) B. Ruscic, M. Litorja, and R. L. Asher, The Journal of Physical Chemistry A 103, 8625 (1999), http://dx.doi.org/10.1021/jp992403v .
- Blanksby and Ellison (2003) S. Blanksby and G. Ellison, Accounts of Chemical Research 36, 255 (2003).