ALMA [N ii] 205 Imaging Spectroscopy of the Interacting Galaxy System
BRI 1202-0725 at Redshift 4.7⋆⋆\star⋆⋆\star
The National Radio Astronomy Observatory is a facility of the National Science Foundation operated under cooperative
agreement by Associated Universities, Inc.
Abstract
We present the results from Atacama Large Millimeter/submillimeter Array (ALMA) imaging in the [N ii] 205 fine-structure line (hereafter [N ii]) and the underlying continuum of BRI 1202-0725, an interacting galaxy system at 4.7, consisting of an optical QSO, a sub-millimeter galaxy (SMG) and two Lyman- emitters (LAEs), all within 25 kpc of the QSO. We detect the QSO and SMG in both [N ii] and continuum. At the 1″ (or 6.6 kpc) resolution, both QSO and SMG are resolved in [N ii], with the de-convolved major axes of 9 and 14 kpc, respectively. In contrast, their continuum emissions are much more compact and unresolved even at an enhanced resolution of 0.7″. The ratio of the [N ii] flux to the existing CO (76) flux is used to constrain the dust temperature () for a more accurate determination of the FIR luminosity . Our best estimated equals K for both galaxies (assuming an emissivity index ). The resulting ratios are statistically consistent with that of local luminous infrared galaxies, confirming that traces the star formation (SF) rate (SFR) in these galaxies. We estimate that the on-going SF of the QSO (SMG) has a SFR of 5.1 yr-1 ( 30%) assuming Chabrier initial mass function, takes place within a diameter (at half maximum) of 1.3 (1.5) kpc, and shall consume the existing 5 of molecular gas in 10 years.
Subject headings:
galaxies: active — galaxies: ISM — galaxies: star formation — infrared: galaxies — ISM: molecules — submillimeter: galaxies1. INTRODUCTION
Star formation (SF) rate (SFR) measures the fundamental physical process of transforming gas into stars and is one of the most important drivers of galaxy evolution. For high- galaxies, Lu et al. (2015; hereafter Lu15) explored a new dual-spectral line approach for estimating both SFR and the far-infrared (FIR) color (thus ), where refers to the rest-frame ratio. For local (ultra-)luminous infrared galaxies [(U)LIRGs], the luminosity of the CO (76) line emission, , can be used to infer the SFR of the galaxy with a 30% accuracy, irrespective of whether the galaxy hosts an active galactic nucleus (AGN) (Lu et al. 2014, 2017; Lu15). Furthermore, by measuring the flux of the [N ii] 205 line (1461.13 GHz; hereafter as [NII]), one can use the steep dependence of the [N ii] to CO (76) flux ratio on to estimate or , with an accuracy equivalent to 2 K in if the dust emissivity power law index is around 2 (Lu15). is empirically related to , the average SFR surface density (Liu et al. 2015; Lutz et al. 2016), another fundamental parameter of galaxy SF. This indirect estimate of is useful at high , where it is often challenging to spatially resolve a galaxy. This dual-line strategy also allows for estimating additional galaxy physical parameters, including the SF area ( SFR/), the molecular gas mass () from the continuum flux underlying the CO (76) line (Scoville et al. 2016), and the gas depletion time (/SFR). If the lines are sufficiently resolved spectrally and spatially, insights into the gas dynamics can also be gained.
In a Cycle-3 program with the Atacama Large Millimeter/submillimeter Array (ALMA), we conducted a spectral line snapshot survey of 8 ULIRGs and 4 LIRGs of to complete their detections in [N ii] and CO (76). All our targets have prior detections in the [C ii] 158 line (hereafter [C ii]). In this paper we present the results from our [N ii] observation of the interacting galaxy group BRI 1202-0725 at (Isaak et al. 1994). This un-lensed system consists of 2 ULIRGs: a QSO at and an optically obscured, sub-millimeter galaxy (SMG) at and 3.8″ (25 kpc) northwest of the QSO (Omont et al. 1996; Ohta et al. 1996; Hu et al. 1996; Yun et al. 2000; Carilli et al. 2002; Yun & Carilli 2002; Momjian et al. 2005; Iono et al. 2006; Salomé et al. 2012). In addition, two Lyman- emitting galaxies (LAEs) have been detected in this system, with the first one (LAE1) located between the QSO and SMG, at 2.3″ northwest of the QSO and the second one (LAE2) at 2.7″ southwest of the QSO (Hu et al. 1996; Fontana et al. 1996; Ohta et al. 2000; Ohyama et al. 2004).
The [C ii] emission was detected with ALMA on all the member galaxies, along with a possible extended gas ridge between the QSO and SMG (Wagg et al. 2012; Carilli et al. 2013). Both QSO and SMG were also detected in CO (76) and CO (54) (Omont et al. 1996; Salomé et al. 2012). Decarli et al. (2014) presented the [N ii] spectra of the system obtained with the IRAM interferometer and suggested possible [N ii] detections for the SMG and LAEs, but a non-detection for the QSO. However, the [N ii] line peak flux densities of both QSO and SMG (see Fig. 2 here) are either near or below the spectral noise in Decarli et al. This might explain the flux discrepancy between ours and theirs. Pavesi et al. (2016) analyzed an archival ALMA observation and derived the [N ii] fluxes of 0.74 (0.07), 1.5 (0.2) and 0.30 (0.06) Jy km s-1 for the QSO, SMG and LAE2, respectively, and a 3 flux density upper limit of mJy for LAE1.
The [N ii] line is a major cooling line for ionized gas in galaxies. This line has only been detected in a handful of galaxies at (e.g., Combes et al. 2012; Decarli et al. 2012; Nagao et al. 2012; Rawle et al. 2014; Béthermin et al 2016; Pavesi et al. 2016). Our ALMA [N ii] observation of BRI 1202-0725 detected both SMG and QSO at good S/N ratios. In §2 we describe our observations and results. In §3 we analyze the observed [N ii] and dust continuum emissions, and discuss the SF properties and [N ii]/CII flux ratios of the galaxies in BRI 1202-0725. We use a flat cosmology with , and km s-1 Mpc-1. At , the luminosity distance is 44,172 Mpc and 1″ corresponds to 6.6 kpc.
2. Observations and Results
BRI 1202-0725 was observed in ALMA Band 6 in the time division mode. Of the 4 spectral windows (SPWs), each of 1875 MHz wide, one was targeted at the redshifted [N ii] line (at 256.6 GHz) and the other 3, centered at 254.6, 240.6 and 238.6 GHz, respectively, were used for continuum measurements. Each SPW has 128 channels with an effective resolution of 31.25 MHz (36.5 km s-1). The observation consisted of 2 independent executions, each with a 20.3 min on-target integration. The first was executed on January 8, 2016 using 37 antennas covering baselines from 15.1 to 310.2 meters and the second on March 13, 2016 using 38 antennas and baselines ranging from 15.1 to 460.0 meters. The phase, bandpass and flux calibrations were based on the quarsars J1229+0230 and J1159-0940. The data reduction was carried out with the Common Astronomy Software Applications (CASA) 4.5.3 and the final images were cleaned using the natural weighting, resulting in a synthesized beam of 1.0″0.8″ (full width at half maximum; FWHM) at a position angle (PA) of 75° (N to E) for both continuum and line data. The r.m.s. noise in the continuum image, which is the average of the 3 continuum SPWs, is 34 Jy beam-1. The final [N ii] spectral cube has a velocity channel width of 100 km s-1, with an r.m.s. noise of 0.3 mJy beam-1 in individual channels.
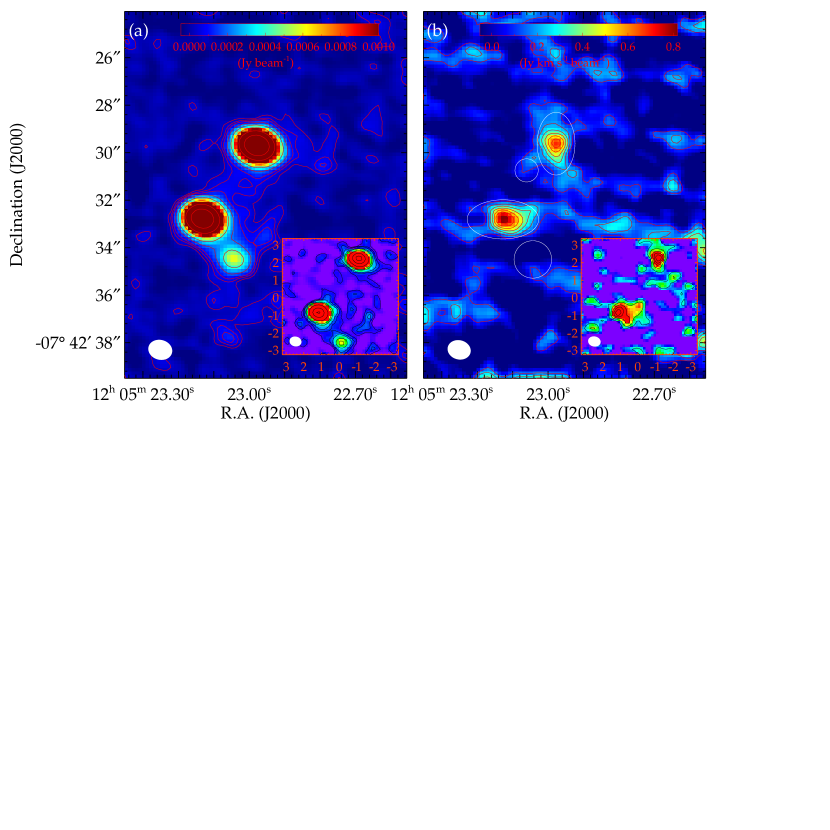
We compare in Fig. 1 the continuum image and the [N ii] image integrated over 256.148 to 257.090 GHz, which encompasses all and the vast majority of the [N ii] fluxes from QSO and SMG, respectively. While the QSO, SMG and LAE2 are all detected in the continuum, only the QSO and SMG are clearly detected in [N ii]. There appears to exist some faint (up to 3 or 0.1 mJy beam-1) dust emission connecting the QSO and SMG, with a morphology similar to what is seen in [C ii] (Carilli et al. 2013). However, its counterpart is not detected in the [N ii] image. The outer [N ii] emission contours (up to 3 levels) of both QSO and SMG show distortions. To gain a better insight into this, we also cleaned the data using the Briggs weighting (with robust ) to lower the sidelobes and to effectively enhance the resolution to 0.7″0.6″ (PA 78°). The results are shown in the insert in each panel in Fig. 1 for an image section covering our targets. While the [N ii] emission of the SMG remains in a similar morphology, that of the QSO is marginally resolved into 3 peaks: (i) the brightest one aligns with the peak dust emission; (ii) the second one (12h05m2309, -7°42′332) is 0.7″ southwest of (i), in the direction of LAE2; (iii) the third one (12h05m2306, -7°42′325) is 1″ northwest of (i), with a peak surface brightness just under 3. While (i) and (iii) have similar line central velocities, (ii) is blue-shifted by 200 km s-1 relative to (i). Contributing to 10% of the total [N ii] flux of the QSO, (iii) is the main cause of the distorted contours seen. The relative positions of (ii) and (iii) are suggestive of tidal interaction or gas connection between the member galaxies.
3. Analysis and Discussion
In this section we analyze the [N ii] and continuum emissions and derive the parameters in Table 1 using the data cleaned with the natural weighting.
3.1. [N ii] Line Emission
In Fig. 2 we show the [N ii] spectra extracted within the elliptical apertures defined in Table 1. For the QSO and SMG, we fit to their spectrum a single Gaussian profile plus a constant to derive the line flux. The resulting [N ii] line widths are similar to or slightly wider than those of the corresponding CO and [C ii] lines (Salomé et al. 2012; Carilli et al. 2013). For the LAEs, the frequency location of the [N ii] peak emission is marked in Fig. 2, based on the [C ii] redshift (Carilli et al. 2013). Neither LAE is detected here.
Both SMG and QSO are spatially resolved in our [N ii] image. A 2d Gaussian fit to the [N ii] image of the SMG (Fig. 1b) yielded 2.3″1.1″ (FWHM along each axis), with the major axis at PA °. For the QSO, these values are (1.6″0.9″, PA °). After a deconvolution with the ALMA beam, they become (2.1″0.5″, PA °) and (1.3″0.4″, PA °) for the SMG and QSO, respectively. The de-convolved major axes correspond to 14 and 9 kpc for the SMG and QSO, respectively. Both QSO and SMG are unresolved in the continuum (see §3.2) and also appear to be unresolved in [C ii] in Carilli et al. (2013; beam size 1.2″0.8″). Therefore, the [N ii] emission is much more extended (or diffuse) than the dust or [C ii]emission in these galaxies.
For the QSO, the [N ii] channel images reveal that the most blue-shifted (red-shifted) emission is located at the south-western (north-eastern) side of the galaxy, consistent with a rotation. For the SMG, the [N ii] channel images do not support a position-velocity pattern consistent with a rotation. These are all consistent with what is seen in CO (54) and [C ii] (Salomé et al. 2012; Carilli et al. 2013).
3.2. Dust Continuum
We derive the total continuum flux density of a galaxy by fitting a 2d Gaussian to the galaxy image in Fig. 1a after temporarily masking out the other galaxies. The resulting Gaussian FWHMs (in Table 1) confirm that both QSO and SMG are unresolved. [In fact, the insert in Fig. 1a shows that, even at the enhanced resolution of 0.7″, they are still unresolved with the following fitted Gaussian FWHMs: 0.73″0.59″ (PA 76°) for the QSO and 0.75″0.58″ (PA 89°) for the SMG.] Table 1 shows that LAE2 is largely resolved.
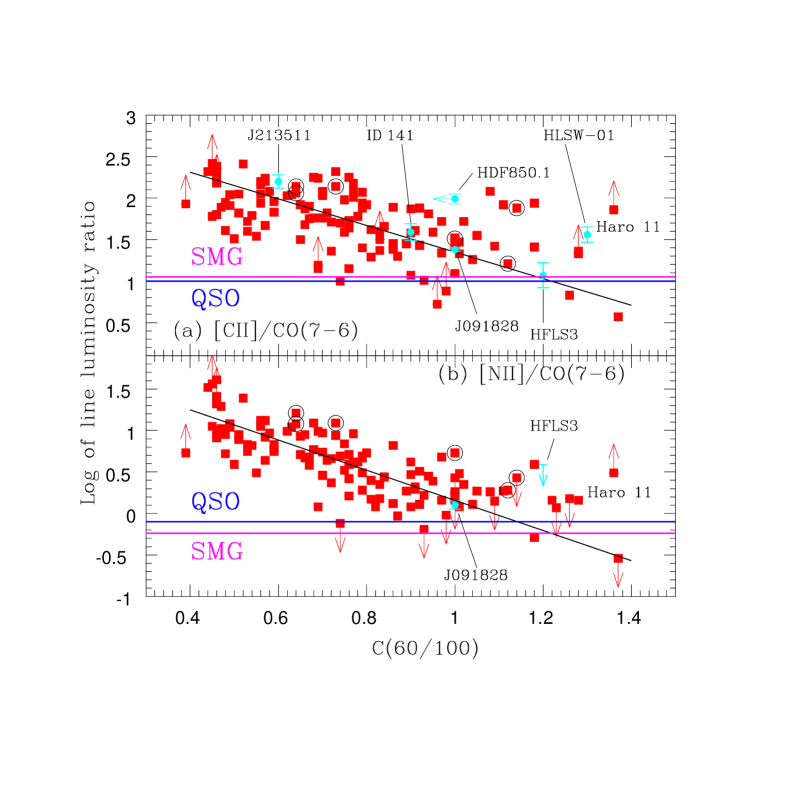
In Fig. 3 we plot the [C ii]/CO (76) and [N ii]/CO (76) flux ratios, each as a function of , for the local (U)LIRGs and high- galaxies used in Lu15. The corresponding flux ratios of the QSO and SMG in BRI 1202-0725 are indicated by the horizontal lines. The black line in each plot is a least-squares bisector fit (Isobe et al. 1990) to the local (U)LIRGs of detections only, excluding the AGNs (see Fig. 3 caption). For the SMG, the corresponding line flux ratio intercepts the black line at in (a) and 1.23 in (b). The difference between these values is smaller than the scatter (0.15 to 0.2) in these plots. We therefore simply adopt their average value of 1.21. For the QSO, such determined values are 1.22 and 1.15, respectively. Even though there is some apparent segregation between the AGNs and the rest of the local (U)LIRGs in Fig. 3b, the AGN sample size is still too small to draw a firm conclusion on this. We therefore also adopt the average for the QSO. We set the uncertainty of these FIR colors to the horizontal scatter w.r.t. the black line in the [N ii] plot, i.e., 0.15. Assuming (Planck Collaboration et al. 2011), these adopted FIR colors correspond to () K.
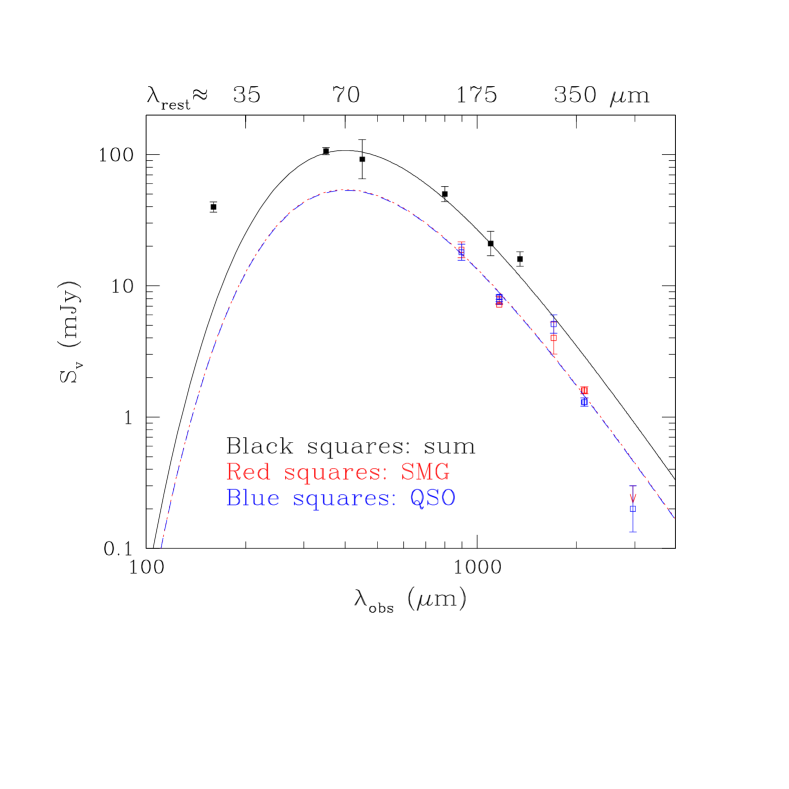
The QSO and SMG are only spatially separated by a few existing interferometric observations, all at the long-wavelength side of their SED peak (see Fig. 4). The determined above provides a crucial constraint on the SED shape. Our best modified-blackbody SED fits for the QSO and SMG separately, after fixing at 43 K and at 1.8, are also shown in Fig. 4. We note that similar SED fits would be obtained by using only the continuum flux from the CO (76) observation and our adopted . The luminosity of the SED fit integrated over 20 to 1000 is for the QSO (SMG). These values are 3-5 times larger than those in Salomé et al. (2012). The (over 42122) from our SED fit is , resulting in a () for the QSO (SMG). These values agree with the average of for our local (U)LIRG sample to within 1.5, where () is the local sample standard deviation (see Lu15).
3.3. Star Formation Properties
Following Lu15, the SFR inferred from is 5.1 yr-1 for the QSO (SMG) using the initial mass function (IMF) of Chabrier (2003). For local (U)LIRGs, is empirically correlated with (Liu et al. 2015) or (Lutz et al. 2016). The scatter of these correlations is fairly significant, e.g., 0.6 dex in Lutz et al. (2016). Nevertheless, these two independent correlations give comparable estimates for : yr-1 kpc-2 for both QSO and SMG after we adjusted their correlations to Chabrier IMF and increased the -based SFR in Lutz et al. by a factor of 2 to align with the Kennicutt (1998) formula. These estimates of are quite high, but still below the Eddington limit of yr-1 kpc-2 (Murray et al. 2005; Thompson et al. 2005; Hopkins et al. 2010). The face-on FWHM diameter, , of the SF region can be estimated via . For yr-1 kpc-2, the resulting (1.5) kpc for the QSO (SMG), consistent with them being unresolved in our continuum image. These sizes are somewhat smaller than the 2 kpc scale resolved in a high-resolution CO (2) image (Carilli et al. 2002), a phenomenon that is also seen locally (Xu et al. 2014, 2015). Following Scoville et al. (2016), we estimated the molecular gas mass, , to be for either galaxy based on the rest-frame (850) from our SED fit. The formal uncertainty for is about a factor of 2. The gas depletion time 10 (7) years for the QSO (SMG).
3.4. On [N ii]/[C ii] Ratios
For local (U)LIRGs, correlates linearly with , with a scatter of only 0.15 in (Lu15). As increases from 0.4 to 1.3, drops by a factor of 4 (from 0.12 to 0.03). This correlation is due to an increasing contribution to [C ii] from the neutral medium around young massive stars as increases (see Daíz-Santos et al. 2017). Our observation shows that both QSO and SMG in BRI 1202-0725 follow this local trend as well.
Theoretical considerations predict a smaller [N ii]/[C ii] ratio for a lower metallicity (Nagao et al 2012; Pereira-Santaella et al. 2017). In such a scenario, galaxies of different metallicities follow separate [N ii]/[C ii] tracks. In principle, one needs to know both [N ii]/[C ii] and in order to constrain the metallicity of a galaxy. For example, our current observation sets [N ii]/[C ii] for the two LAEs. These limits alone are not stringent enough to conclude if the LAEs follow a different [N ii]/[C ii] track than the local (U)LIRGs.
References
- (1) Benford, D. J., Cox, P., Omont, A., et al. 1999, ApJ, 518, L65
- (2) Béthermin, De Breuck, C., Gullberg, B., et al. 2016, A&A, 586, L7
- (3) Carilli, C. L., Kohno, K., Kawabe, R., et al. 2002, AJ, 123, 1838
- (4) Carilli, C. L., Riechers, D., Walter, F., et al. 2013, ApJ, 763, 120
- (5) Chabrier, G. 2003, PASP, 115, 763
- (6) Combes, F., Rex, M., Rawle, T. D., et al. 2012, A&A, 538, L4
- (7) Decarli, R., Walter, F., Neri, R., et al. 2012, ApJ, 752, 2
- (8) Decarli, R., Walter, F., Carilli, C., et al. 2014, ApJ, 782, L17
- (9) Díaz-Santos, T., Armus, L., Charmandaris, V., et al. 2017, ApJ (submitted)
- (10) Fontana, A., Cristiani, S., D’Odorico, S., Giallongo, E., & Savaglio, S. 1996, MNRAS, 279, L27
- (11) Hopkins, P. F., Murray, N., Quataert, E., & Thompson, T. A. 2010, MNRAS, 401, L19
- (12) Hu, E. M., McMahon, R. G., & Egami, E. 1996, ApJ, 459, L53
- (13) Iono, D., Yun, M. S., Elvis, M., et al. 2006, ApJ, 645, L97
- (14) Isaak, K., McMahon, R. G., Hills, R. E., & Withington, S. 1994, MNRAS, 269, L28
- (15) Isobe, T., Feigelson, E. D., Akritas, M. G., & Babu, G. J. 1990, ApJ, 364, 104
- (16) Kennicutt, R. C., Jr. 1998, ARA&A, 36, 189
- (17) Leipski, C., Meisenheimer, K., Klaas, U., et al. 2010, A&A, 518, L34
- (18) Liu, L., Gao, Y., & Greve, T. R. 2015, ApJ, 805, 31
- (19) Lu, N., Zhao, Y., Xu, C. K., et al. 2014, ApJ, 787, L23
- (20) Lu, N., Zhao, Y., Xu, C. K., et al. 2015, ApJ, 802, L11 (Lu15)
- (21) Lu, N., Zhao, Y., Díaz-Santos, T., et al. 2017, ApJS, 230, 1
- (22) Lutz, D., Berta, S., Contursi, A., et al. 2016, A&A, 591, A136
- (23) Momjian, E., Carilli, C. L., & Petric, A. O. 2005, AJ, 129, 1809
- (24) Murray, N., Quataert, E., & Thompson, T. A. 2005, ApJ, 618, 569
- (25) Nagao, T., Maiolino, R., De Breuck, C, et al. 2012, A&A, 542, L34
- (26) Ohta, K., Yamada, T., Nakanishi, K., et al. 1996, Nature, 382, 426
- (27) Ohta, K., Matsumoto, T., Maihara, T., et al. 2000, PASJ, 52, 557
- (28) Ohyama, Y., Taniguchi, Y., & Shioya, Y. 2004, AJ, 128, 2704
- (29) Omont, A., Petitjean, P., Guilloteau, S., et al. 1996, Nature, 382, 428
- (30) Pareira-Santaella, M., Digopoulou, D., Frrah, D., et al. 2017, MNRAS (in press) (ArXiv:1705.0836)
- (31) Pavesi, R., Riechers, D. A., Capak, P. L., et al. 2016, ApJ, 832, 151
- (32) Planck Collaboration, Abergel, A., Ade, P. A. R., et al. 2011, A&A, 536, A25
- (33) Rawle, T. D., Egami, E., Bussmann, R. S., et al. 2014, ApJ, 783, 59
- (34) Salomé, P., Guélin, M., Downes, D., et al. 2012, A&A, 545, 57
- (35) Sanders, D. B., & Mirabel, I. F. 1996, ARA&A, 34, 749
- (36) Scoville, N., Sheth, LK., Aussel, H., et al. 2016, ApJ, 820, 83
- (37) Thompson, T. A., Quataert, E., & Murray, N. 2005, ApJ, 630, 167
- (38) Wagg, J., Wiklind, T., Carilli, C. L., et al. 2012, ApJ, 752, L30
- (39) Xu, C. K., Cao, C., Lu, N., et al. 2014, ApJ, 787, 48
- (40) Xu, C. K., Cao, C., Lu, N., et al. 2015, ApJ, 799, 11
- (41) Yun, M. S., Carilli, C. L., Kawabe, R., et al. 2000, ApJ, 528, 171
- (42) Yun, M. S., & Carilli, C. 2002, ApJ, 568, 88
Continuum:
R.A.b & J2000 12h05m2313 12h05m2298 12h05m2304
Decl.b J2000 -7°42′328 -7°42′297 -7°42′345
(256 GHz)c mJy 7.58 () 7.20 () 0.83
Gaussian fitc (1.08″0.89″, 73°) (1.08″0.87″, 75°) (1.20″0.98″, 122°)
[N ii]:
Apertured (3″1.65″, 90°) (2.65″1.6″, 0°) (1.6″1.6″, 0°) (1″1″, 0°)
4.695 4.693
Fluxf Jy km s-1 1.01 () 0.99 ()
FWHMg km s-1 380 794
Diameterh kpc 9 14
Derived parameters:
6.6 () 8.9 ()
6.5 () 10.0 ()
5.3 () 5.2 ()
K 43 () 43 ()
2.3 () 2.4 ()
5.0 () 6.7 ()
SFRm yr-1 5.1 () 6.9 ()
yr-1 kpc-2 16/21 18/21
SF diametero kpc 1.3 1.5
5 5
years 10 7
 |
 |
 |
 |