How Mutation Alters Fitness of Cooperation in Networked Evolutionary Games
Abstract
Cooperation is ubiquitous in every level of living organisms. It is known that spatial (network) structure is a viable mechanism for cooperation to evolve. Until recently, it has been difficult to predict whether cooperation can evolve at a network (population) level. To address this problem, Pinheiro et al. proposed a numerical metric, called Average Gradient of Selection (AGoS) in 2012. AGoS can characterize and forecast the evolutionary fate of cooperation at a population level. However, stochastic mutation of strategies was not considered in the analysis of AGoS. Here we analyzed the evolution of cooperation using AGoS where mutation may occur to strategies of individuals in networks. Our analyses revealed that mutation always has a negative effect on the evolution of cooperation regardless of the fraction of cooperators and network structures. Moreover, we found that mutation affects the fitness of cooperation differently on different social network structures.
Introduction
Cooperation is ubiquitous in every level of living organisms and has played an important role in the major evolutionary transitions (West et al.,, 2015; Michod,, 2007, 2006). In principle, cooperators benefit others by incurring some costs to themselves, while defectors do not pay any costs. Therefore, cooperation cannot be an evolutionarily stable strategy for a noniterative game in a well-mixed population (Nowak,, 2006; Maynard Smith and Price,, 1973; Taylor and Jonker,, 1978; Maynard Smith,, 1982; Hofbauer and Sigmund,, 1998).
In such a situation, spatial (network) structure is a viable mechanism for cooperation to evolve (Nowak and May,, 1992; Santos and Pacheco,, 2005). However, until recently, it has been difficult to predict whether cooperation can evolve at a network (population) level due to the complex interactions between evolution of strategies and topologies of networks. To address this problem, Pinheiro et al., 2012a proposed a numerical metric, called Average Gradient of Selection (AGoS), to characterize and forecast the evolutionary fate of cooperation at a population level. AGoS can analyze the dynamics of the evolution of cooperation in structured populations even when nontrivial selection pressure is introduced (Pinheiro et al., 2012b, ), when nonlinear imitation probability is used (Dai et al.,, 2013), and also when structures and states of networks change over time (adaptive social networks) (Pinheiro et al.,, 2016).
In these earlier studies, however, stochastic mutation of strategies was not considered. It is important to incorporate such mutation because they frequently occur in real societies and also because results obtained with stochastic fluctuations of strategies would provide more robust observations and conclusions. Here we analyze the evolution of cooperation using AGoS where mutation may occur to strategies of individuals in networks.
Model
We developed an agent-based model for the analysis of AGoS. Individuals are placed on the nodes in a network and they interact only with their neighbors. The networks used in this paper are described in the next subsection. Each individual can take one of two strategies: Cooperation () or Defection ().
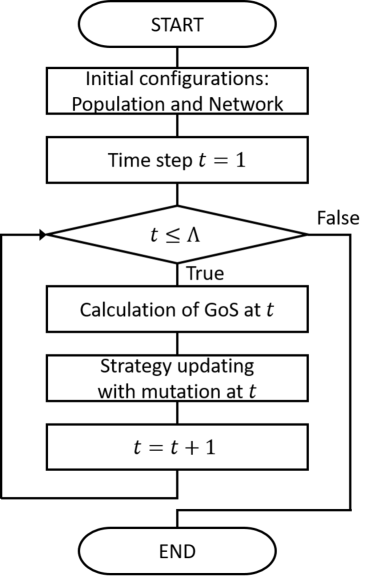
Once the composition of individuals in a network is given, we can calculate the probability of increasing or decreasing the number of cooperators by one, called Gradient of Selection (GoS) at time (Pinheiro et al., 2012a, ). Simultaneously, we can also update the strategies of individuals based on the framework of evolutionary games at time . Right after the strategy updating, mutation (flipping strategy from to or vice versa) occurs with probability . Therefore, in evolutionary simulations, the calculations of GoS and the strategy updating with mutation take place alternately in one time step and these processes are repeated. The calculation of GoS and the strategy updating with mutation are repeated time-steps. Figure 1 gives the flow of the model for each simulation. Simulations are repeated times in total.
Network structure
Pinheiro et al., 2012a revealed that cooperation was sustained in a network level and network structures led to the different evolutionary results of cooperation. Following to the existing work (Pinheiro et al., 2012a, ; Pinheiro et al., 2012b, ), we focus on two classes of network structures: homogeneous and heterogeneous. We use homogeneous in the sense that every individual has the same degree. In the case of heterogeneous, individuals can have different degrees.
For homogeneous networks, we use two types: homogeneous random networks (HR) (Santos et al.,, 2005) and square lattice (Lattice). HR is created by randomizing links from homogeneous regular ring networks. For heterogeneous networks, we use Barabási-Albert scalfe-free networks (BA) (Barabási and Albert,, 1999). In BA, a small number of nodes called hubs connect with a substantial number of links while most other nodes connect with a few nodes.
In the initial setting, the number of cooperators in a population, , is given to each simulation. The locations of cooperators and defectors in a network are random.
AGoS calculation
Once each simulation starts, GoS of the given population at time is calculated. If there is no population (network) structure, the probability of the change of cooperators can be calculated analytically. However, in structured populations, the calculation is difficult due to the complex connections on networks.
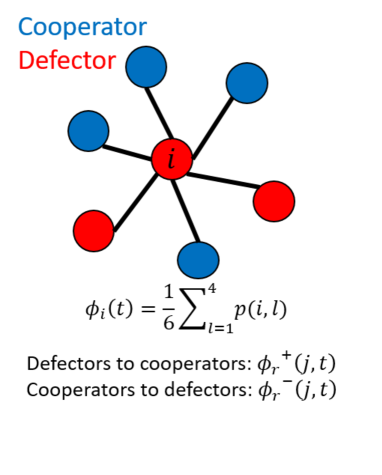
The GoS gives the numerical solution for the evolution of cooperation even in such a situation. Let be the probability that ’s strategy changes to the other different strategy (from to or from to ). This can be the product of two terms: the probability of selecting a neighbor with the different strategy, , and the average probability that imitates the different strategy, , where is the number of ’s neighbors and is the number of neighbors which has the different strategy opposite to ’s. is defined in the next subsection. Thus, can be defined as follows. An example of is illustrated in Fig. 2.
| (1) |
From the definition, for a given simulation , the probability to increase the number of at (the number of s in the network) is while the probability for the decrease of the number of s is , where is the population size, is a set of defectors (), and is a set of cooperators (). Then, GoS at time in a given simulation is defined as the difference between them, as
| (2) |
Finally, we obtain the Average Gradient of Selection (AGoS) (Pinheiro et al., 2012a, ), which averages the GoS by the number of time steps and the number of simulations , as
| (3) |
Strategy updating with mutation
After the GoS calculation, the strategy updating takes place as follows. In each time step, we randomly choose one individual from the population. The individual plays the Prisoner’s Dilemma (PD) game with its neighbors and accumulates the payoffs resulting from the games. In each game, both individuals obtain payoff for mutual cooperation while for mutual defection. If one selects cooperation while the other does defection, the former obtains the sucker’s payoff while the latter obtains the highest payoff , the temptation to defect. The relationship of the four payoffs is usually in PD games. AGoS is used for the other types of collective games including Stag Hunt (Pacheco et al.,, 2009) and Snowdrift (Santos et al.,, 2012) games.
Following the parameter settings used in the model by Pinheiro et al., 2012a ; Pinheiro et al., 2012b , we used , and , while . The neighbors of also play the PD game with their neighbors and accumulate the payoffs. Let and be the payoffs of individual and (one of the randomly selected ’s neighbors), respectively. Based on the framework of evolutionary games, higher fitness will be imitated more. In order to realize this, we use the pairwise comparison rule (Traulsen et al.,, 2006, 2007; Szabó and Tőke,, 1998). Individual imitates ’s strategy with the probability
| (4) |
where controls the intensity of selection. For , there is no selection pressure, meaning that evolutionary dynamics proceeds by random drift. As becomes larger, the tendency that strategies with higher payoffs will be imitated increases.
In the previous studies (Pinheiro et al., 2012a, ; Pinheiro et al., 2012b, ), the next time step immediately follows after the strategy updating. In contrast, we incorporate mutation in this paper. Specifically, the strategy of individual changes to the different strategy with probability after the strategy updating. We focus on how mutation alters fitness of cooperation in networks.
Results
In each simulation, we calculated the GoS and conducted the strategy updating with mutation every time step, which was iterated time steps. The population was composed of ( for Lattice) individuals and an average degree was . The intensity of selection was . We ran simulations in total (we ran 30 runs for each from to ). Thus, we set for HR and BA while for Lattice. The temptation to defect was different depending on networks. We varied the values of mutation probability as the experimental parameter.
Case of HR networks
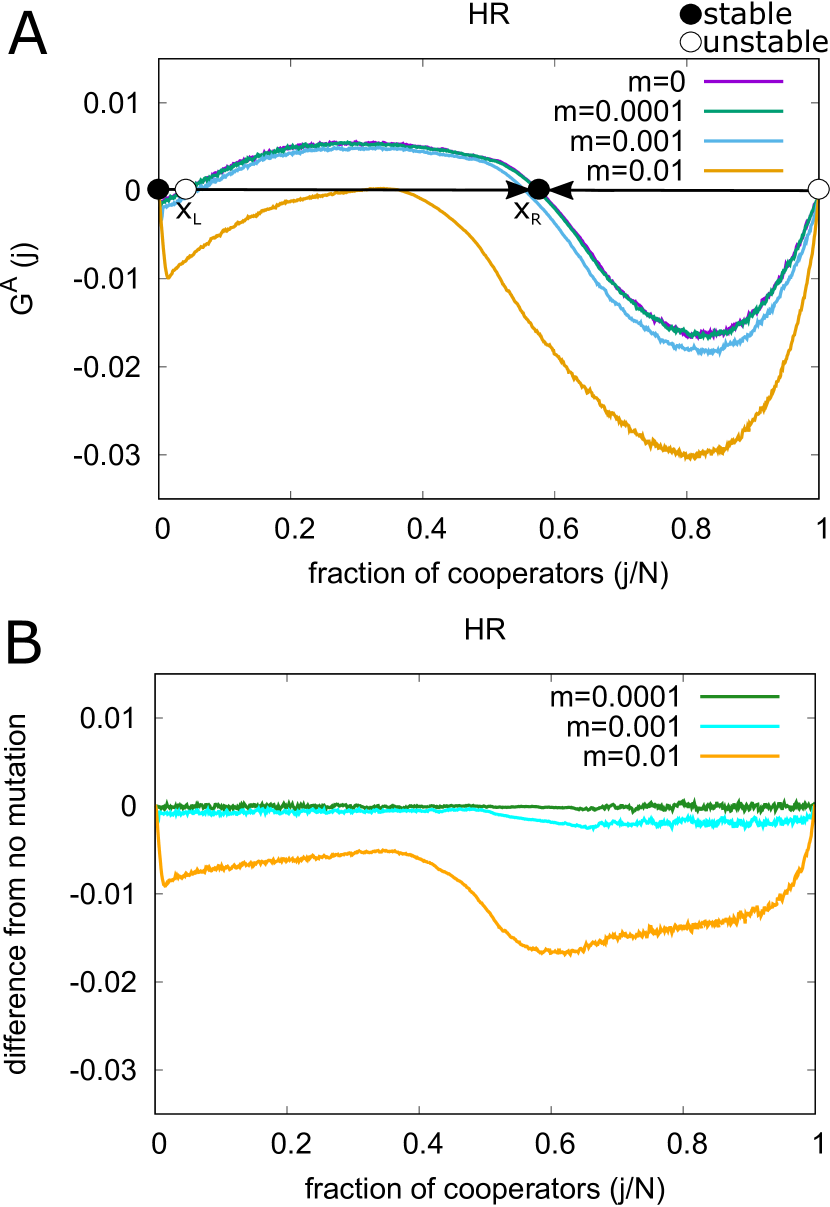
We first see the results of homogeneous networks. Figure 3A shows the AGoS () on HR networks where the mutation probabilities are varied. When , the result perfectly matches the corresponding case of Pinheiro et al., 2012a .
It has two stable equilibrium points and two unstable equilibrium points. One of the unstable points, , exists at . One of the stable points, , exists at . The other unstable and stable points exist at and , respectively. As the arrows suggest, as long as , the population composition converges to the stable point . Thus, unlike the case of well-mixed populations, cooperation and defection can co-exist in the network. In other words, from a global, population-level perspective, HR networks can sustain cooperation even though all individuals play PD. As becomes larger, goes down overall. Thus, the stable coexistence point becomes lower. In the case of , we expect that the only stable point exists at because is always likely to be lower than 0, meaning that cooperation can no longer exist. Therefore, mutation is always harmful for cooperation although mutation is neutral itself.
Figure 3B shows the difference of with mutations on HR networks when we set the case of no mutation as the baseline. Compared to the lower , the higher leads to the lower more as the mutation probability increases. This is because, in the case of the higher , clusters of cooperators are easily destroyed by the mutation.
Case of lattice networks
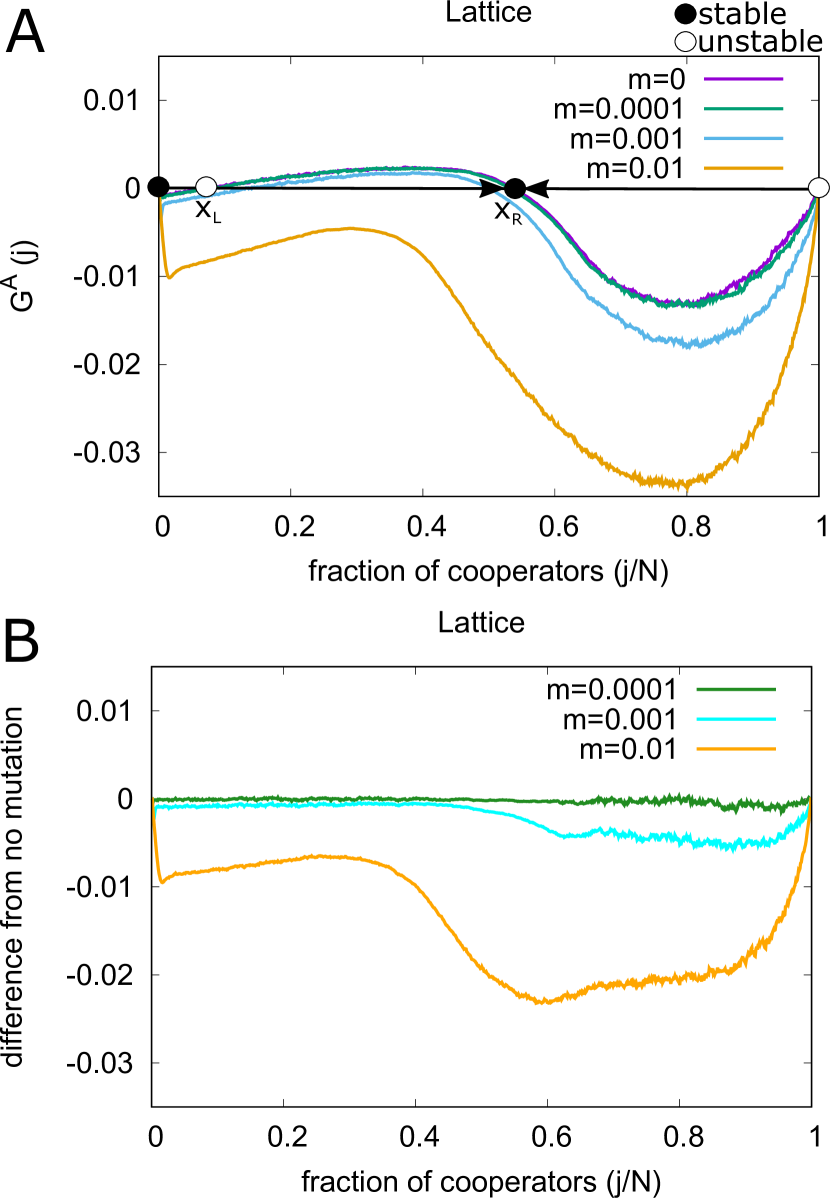
Figure 4A shows the AGoS on lattice networks where the mutation probabilities are varied. The tendency of this result is the same with the HR networks because lattice is classified into homogeneous networks.
It has also two stable equilibrium points and two unstable equilibrium points. One of the unstable points, , exists at . One of the stable points, , exists at . Hence, the density of co-existence is lower than HR networks (). The other unstable and stable points exist at and , respectively. If , cooperation and defection can co-exist in the network. As becomes larger, goes down overall. Thus, the stable coexistence point becomes lower. When , the only stable point exists at . In this case, cooperation finally converges to 0 (extinction) no matter the initial fraction of cooperators () because is always lower than 0.
Figure 4B shows the difference of with mutations on lattice networks when we set the case of no mutation as the baseline. The value of AGoS is small in the positive zone () while the absolute value in the negative zone () is large when (See Fig. 4A). In lattice networks, both cooperation and defection are localized. Therefore, when the number of cooperators is low, only small clusters of cooperators can exist. It is difficult for them to expand their regions because they do not affect faraway places. In contrast, when the number of cooperators is high, there can be some big cooperative clusters. In this case, if mutation to defection takes place in the clusters, it immediately changes cooperative clusters to defectors. Thus, the absolute value of AGoS when in the negative zone may become large.
Case of BA networks
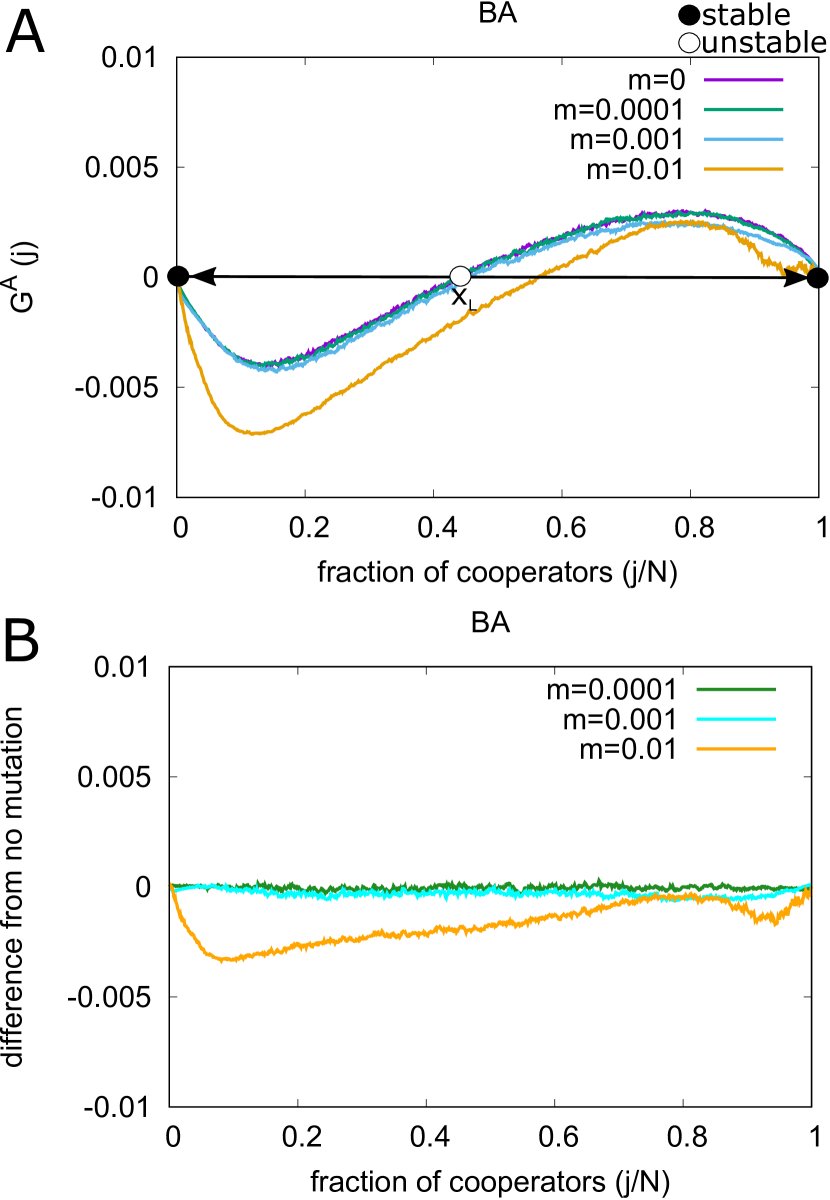
Figure 5A shows the AGoS on BA networks where the mutation probabilities are varied. When , there are one unstable equilibrium point and two stable equilibrium points, and . This is the same with the one observed in the previous study (Pinheiro et al., 2012a, ). This means that cooperation becomes dominant when . As increases, the number of cooperators needed for sustaining the dominance of cooperation becomes larger. However, it is still possible for cooperation to become dominant even if the mutation rate is high () in BA networks.
Figure 5B shows the difference of with mutations on BA networks when we set the case of no mutation as the baseline. Interestingly, mutation is especially harmful for cooperation in the lower in BA networks, which is the opposite result compared to homogeneous networks (HR and lattice). In the case of BA networks, cooperative hubs surrounded by cooperators are robust to defectors’ invasion. Thus, cooperation is not so affected when is large.
Conclusion
In this paper, we analyzed the evolution of cooperation at a population level in the presence of mutation by the AGoS. We used two classes of networks: homogeneous (HR and lattice) and heterogeneous (BA). Our analyses revealed that mutation always has a negative effect on cooperation regardless of the fraction of cooperators and network structures, because local clusters of cooperators can easily be destroyed by mutation.
Interestingly, we found that mutation is particularly harmful to cooperation when the fraction of cooperation is high in homogeneous networks (HR and lattice), but so it is when the fraction of cooperation is low in heterogeneous networks (BA). This may be due to that hubs surrounded by cooperators are robust to mutated defectors. If we assume average payoffs rather than accumulated payoffs as considered here, we may have different results, as previously suggested (Ichinose and Sayama,, 2017). We also may have different results when the game structure is different (e.g. the Snowdrift game) even when the network structures are the same, as Hauert and Doebeli, (2004) have revealed.
These results indicate the importance of considering random noise (mutation), which was largely overlooked in the literature, in studying the evolution of cooperative behavior in social networks. Mutation can be considered genetic changes if we assume biological systems. If we assume cultural systems, mutation can be considered a stochastic behavior to explore new behaviors. Although we showed such a random exploration was harmful to keep cooperative societies, if we consider different forms of exploration, those explorations may work beneficially for societies, such as collaborative problem solving (Sayama and Dionne,, 2015). We would like to consider those cases in the future work.
Acknowledgements
G.I. acknowledges the support by Hayao Nakayama Foundation For Science & Technology & Culture.
References
- Barabási and Albert, (1999) Barabási, A.-L. and Albert, R. (1999). Emergence of scaling in random networks. Science, 286(5439):509–512.
- Dai et al., (2013) Dai, Q., Li, H., Cheng, H., Zhang, M., and Yang, J. (2013). The effects of nonlinear imitation probability on the evolution of cooperation. Chaos, Solitons & Fractals, 56:53 – 58. Collective Behavior and Evolutionary Games.
- Hauert and Doebeli, (2004) Hauert, C. and Doebeli, M. (2004). Spatial structure often inhibits the evolution of cooperation in the snowdrift game. Nature, 428:643.
- Hofbauer and Sigmund, (1998) Hofbauer, J. and Sigmund, K. (1998). Evolutionary Games and Population Dynamics. Cambridge Univ. Press.
- Ichinose and Sayama, (2017) Ichinose, G. and Sayama, H. (2017). Invasion of cooperation in scale-free networks: Accumulated versus average payoffs. Artificial Life, 23:25–33.
- Maynard Smith, (1982) Maynard Smith, J. (1982). Evolution and the Theory of Games. Cambridge Univ. Press.
- Maynard Smith and Price, (1973) Maynard Smith, J. and Price, G. R. (1973). The logic of animal conflict. Nature, 246(5427):15–18.
- Michod, (2006) Michod, R. E. (2006). The group covariance effect and fitness trade-offs during evolutionary transitions in individuality. Proceedings of the National Academy of Sciences, 103(24):9113–9117.
- Michod, (2007) Michod, R. E. (2007). Evolution of individuality during the transition from unicellular to multicellular life. Proceedings of the National Academy of Sciences, 104(suppl 1):8613–8618.
- Nowak, (2006) Nowak, M. A. (2006). Evolutionary Dynamics: Exploring the Equations of Life. Harvard University Press.
- Nowak and May, (1992) Nowak, M. A. and May, R. M. (1992). Evolutionary games and spatial chaos. Nature, 359:826.
- Pacheco et al., (2009) Pacheco, J. M., Santos, F. C., Souza, M. O., and Skyrms, B. (2009). Evolutionary dynamics of collective action in n-person stag hunt dilemmas. Proceedings of the Royal Society of London B: Biological Sciences, 276(1655):315–321.
- (13) Pinheiro, F. L., Pacheco, J. M., and Santos, F. C. (2012a). From local to global dilemmas in social networks. PLOS ONE, 7:e32114.
- (14) Pinheiro, F. L., Santos, F. C., and Pacheco, J. M. (2012b). How selection pressure changes the nature of social dilemmas in structured populations. New Journal of Physics, 14(7):073035.
- Pinheiro et al., (2016) Pinheiro, F. L., Santos, F. C., and Pacheco, J. M. (2016). Linking individual and collective behavior in adaptive social networks. Physical Review Letters, 116:128702.
- Santos and Pacheco, (2005) Santos, F. C. and Pacheco, J. M. (2005). Scale-free networks provide a unifying framework for the emergence of cooperation. Physical Review Letters, 95:098104.
- Santos et al., (2005) Santos, F. C., Rodrigues, J. F., and Pacheco, J. M. (2005). Epidemic spreading and cooperation dynamics on homogeneous small-world networks. Physical Review E, 72:056128.
- Santos et al., (2012) Santos, M. D., Pinheiro, F. L., Santos, F. C., and Pacheco, J. M. (2012). Dynamics of n-person snowdrift games in structured populations. Journal of Theoretical Biology, 315:81 – 86.
- Sayama and Dionne, (2015) Sayama, H. and Dionne, S. D. (2015). Studying collective human decision making and creativity with evolutionary computation. Artificial Life, 21:379–393.
- Szabó and Tőke, (1998) Szabó, G. and Tőke, C. (1998). Evolutionary prisoner’s dilemma game on a square lattice. Physical Review E, 58:69–73.
- Taylor and Jonker, (1978) Taylor, P. D. and Jonker, L. B. (1978). Evolutionarily stable strategies and game dynamics. Mathematical Biosciences, 40:145–156.
- Traulsen et al., (2006) Traulsen, A., Nowak, M. A., and Pacheco, J. M. (2006). Stochastic dynamics of invasion and fixation. Physical Review E, 74:011909.
- Traulsen et al., (2007) Traulsen, A., Pacheco, J. M., and Nowak, M. A. (2007). Pairwise comparison and selection temperature in evolutionary game dynamics. Journal of Theoretical Biology, 246(3):522 – 529.
- West et al., (2015) West, S. A., Fisher, R. M., Gardner, A., and Kiers, E. T. (2015). Major evolutionary transitions in individuality. Proceedings of the National Academy of Sciences, 112(33):10112–10119.