A novel anomalous region of water
Abstract
Water is the most important liquid in the Universe. At the same time it is the most anomalous liquid. It demonstrates several dozens of anomalies, among which are density anomaly, diffusion anomaly etc. Anomalous behavior of water is a topic numerous publications. However, most of the publications investigate the anomalous behavior of water in the vicinity of critical points: the liquid-gas critical point and the second hypothetical critical point in supercooled region. Here we analyze experimental data on such properties of water as heat capacity, speed of sound, dynamic viscosity and thermal conductivity. We show that these properties demonstrate anomalous maxima and minima in a region which is far from both critical points. Therefore, we find a novel region of anomalous properties of water (anomalous triangle) which cannot be related to critical fluctuations. We also perform a molecular dynamics simulations of this region with two common water models - SPC/E and TIP4P - and show that these models fail to describe the novel anomalous region.
pacs:
61.20.Gy, 61.20.Ne, 64.60.KwWater is the most important liquid in the Universe. The existence of life is attributed to water. At the same time water is very strange liquid which demonstrate numerous anomalous properties (see, for instance, water-anom for the list of anomalies of water). Many of these properties are responsible for importance water for life and technology, e.g. density anomaly or extremely high solubility of many substances in water. All of this made water one of the most studied substance. However, up to now many questions still remain unsolved. Moreover, investigations of water bring some novel discoveries. For example, many novel solid phases of ice were found in the last few decades. That is why in spite of numerous efforts water is still a unique universe of problems for scientists.
As it was mentioned above, water exhibits many anomalous properties. More then 70 anomalies are described in the literature. Many of them are well described in a recent review paper gallo-tale . Anomalous properties of water include such phenomena as density anomaly (negative thermal expansion coefficient), diffusion anomaly (diffusion coefficient increases under isothermal compression), structural anomaly (water becomes more structured under isothermal compression) etc. More anomalies are related to the behavior of thermodynamic response functions - heat capacity, isothermal compressibility, isobaric expansion coefficient etc. These anomalies are often related to the so called Widom line, which is defined as a line of maxima of correlation length in the vicinity of critical point widom-init . Many other quantities, e.g. the response functions mentioned above also demonstrate maxima close to the critical point and it was supposed that the locations of maxima of different quantities should be close to each other. However, in our recent publications it was shown that even in simple liquids like Lennard-Jones fluid or square-well system the lines of maxima of different functions rapidly diverge and one cannot approximate them by a single line widom-lj ; widom-sq . Moreover, even the maxima of the same quantity taken along different thermodynamic paths (for example, isotherms or isobars) can be different widom-co2 . Therefore, the Widom line is not uniquely defined. The Widom line of water in the vicinity of liquid-gas critical point was reported in Ref. widom-water . Another reference widom-water-dynam demonstrated that bends of transport coefficients of water take place at the line of maxima of isobaric heat capacity of water.
In Ref. mish-st it was proposed that some anomalous properties of water can be induced by a liquid-liquid critical point which is located in so-called ’no man’s land’ - an experimentally inaccessible region of the phase diagram. The fluctuations above this critical point induce the maxima of isobaric heat capacity, thermal compressibility, etc. This concept attracted a lot of attention of researchers and many experimental and theoretical works discussed it. In particular, many publications investigated the second Widom line of supercooled water (see, for instance, ws1 ; ws2 ; ws3 and references therein).
One can see that investigation of properties of water is a very hot topic and the literature on it is extremely vast. However, one can notice that most of these studies are restricted to relatively small pressures. Moreover, many theoretical models explaining the origin of these models are based on the critical fluctuations. From studies of the Widom line widom-lj ; widom-sq ; widom-co2 ; widom-water ; widom-water-dynam one can see that the critical fluctuations extend to relatively narrow region with and . In case of water the regions of critical fluctuations related to two critical points can be estimated as (temperature in Kelvins), (pressure in bars) for liquid-gas critical point and K and bar for liquid-liquid critical point. These regions are shown in Fig. 1.
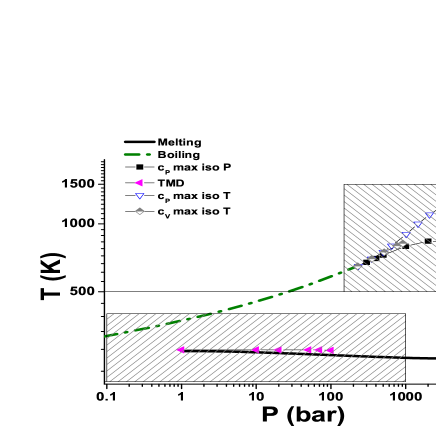
From Fig. 1 one can see that the investigation of anomalous behavior of water is restricted to two relatively narrow regions. In particular, there is no investigations of water anomalies under high pressure. Nowadays the methods to obtain high pressures and perform experiments under such conditions rapidly develop and novel records of pressure are achieved. The behavior of many substances under pressure appears to be very unexpected which makes the high pressure studies extremely intriguing and interesting topic.
The melting line of water is measured up to the pressure of 60 GPa. In the present study we combine the melting line of water from many publications melt1 ; melt2 ; melt3 ; melt4 ; melt5 ; melt6 ; melt7 . However, the properties of liquid water under such conditions are much less studied. Even if there are some experimental works on it, often they are not systematized which make harder to construct a self-consistent picture of the behavior of water under high pressure.
In the present paper we discuss the anomalous properties of water under high pressure. We analyze available experimental results and compare them to molecular dynamic calculations.
We start our investigation from detailed analysis of experimental data which are summed up in NIST database nist . This database summarizes numerous experimental data. The database uses approximations for the experimental data. Several quantities are reported there. Here we consider such properties of water reported in NIST database as equation of state (pressure as a function of density and temperature), isochoric and isobaric heat capacities - and respectively, adiabatic speed of sound , dynamic viscosity and thermal conductivity . We consider these quantities in the whole range of thermodynamic parameters given in the database and find the locations of their minima and maxima. These points are placed on the phase diagram. The boiling curve of water is taken in Ref. boiling-exp and the melting curve is combined from the data given in Refs. melt1 ; melt2 ; melt3 ; melt4 ; melt5 ; melt6 ; melt7
In a set of our recent papers we showed that a so called Rosenfeld relation 10 ; 11 which make a connection between transport coefficient of a fluid with excess entropy can be valid along isochors, but break down along isotherms ros1 ; ros2 . It led us to a conclusion that some properties of fluid appear differently along different trajectories in the space of thermodynamic variables traj1 ; traj2 . Later we discovered that the locations of maxima of the same quantity in the vicinity of a critical point also depends on the thermodynamic path widom-co2 . That is why it is important to monitor the quantities of interest along different ”trajectories” in the space of thermodynamic variables. Here we study the all properties along isochores, isotherm and isobars. The corresponding curves in the plots are denoted as iso V, iso T and iso P respectively.
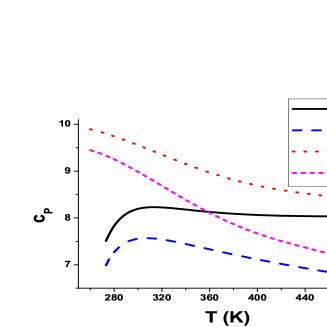
Fig. 2 gives some examples of anomalous behavior of several properties of water under high pressure. The pressure is chosen bar. The temperature ranges from K up to K. One can see that the isobaric heat capacity (Fig. 2 (a)) demonstrates two maxima at the given pressure: at K and K. A minimum of is also observed at K. The isochoric heat capacity (Fig. 2 (b)) has only a maximum at K which is very close to the low temperature maximum of . The maximum of speed of sound (Fig. 2 (c)) is located at K. The behavior of viscosity at this pressure is monotonous (not shown) while the thermal conductivity shown at Fig. 2 (d) has a maximum at K.


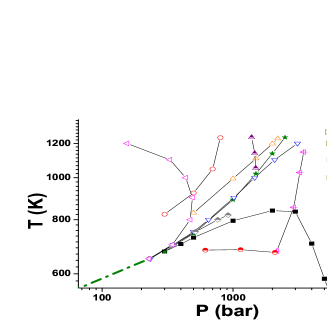
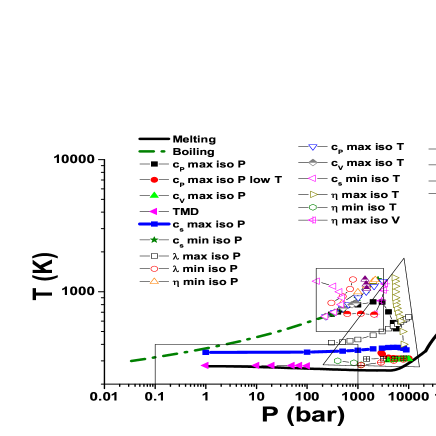
We have explored the data along many isobars, isotherms and isochors and located minima and maxima of different quantities. The results are given in Fig. 3. Fig. 3 (a) gives the overall picture, while panels (b) and (c) enlarge the region close to the critical point and to the bend of the melting line respectively. Note, that some quantities demonstrate several maxima or minima along the same trajectory as we saw for along bar isobar. The melting and boiling lines are also given.
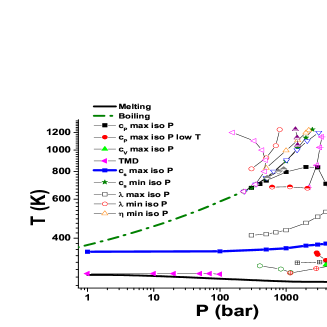
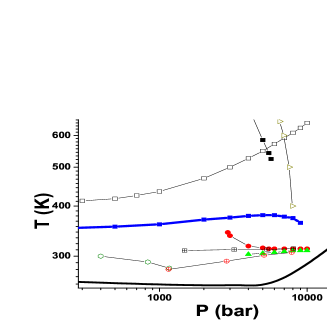
As it was discussed in the introduction, most of studies considered or low-temperature anomalies which are located close to the TMD line in Fig. 3 (a), or maxima in the vicinity of the critical point (Widom lines) (Fig. 3 (b)). However, from Fig. 3 (a) one can determine a novel anomalous region of water which is located to the higher pressures from the boiling line and mostly below the critical temperature. From right hand side it is bounded by the melting line. Fig. 3 (c) enlarges this region.
From Fig. 3 we can better interpret the example given above. The maximum of at K is related to the critical point of water, since it belongs to the Widom line of (black square in the plot). However, the maximum of at K belongs to a separate line of maxima which is located close to the bend of the melting line and can be related to this bend. Interestingly, only heat capacities and demonstrate maxima in the vicinity of the bend of the melting line. The maxima of adiabatic speed of sound are located at higher temperatures and can be observed in the whole range of pressures. At moderate pressures the maxima almost do not depend on temperature. At higher pressures the temperature of maximum of passes a maximum. However, the dependence of this maximum of the pressure is extremely small.
Concerning the anomalies observed along isochors, many of them fall on the boiling line and should be related to phase transition.
We observe several anomalies of viscosity and thermal conductivity. Minima of viscosity along isotherms are observed at low temperatures and pressures from bar up to bar. The location of these minima almost do not depend on temperature ( K at bar and K at bar). Another line of viscosity minima is the line of minima on isobars which is located in the region of Widom lines above the critical point. Finally, there is a line of viscosity maxima along isotherms which goes from the point K and bar to the point K and bar. This line looks to be not connected to any special lines, like melting or boiling ones. Interpretation of this line requires further studies.
The behavior of thermal conductivity appears to be even more complex. In the vicinity of the critical point we observe two lines of minima of along isochors and a line of mimina along isobars. These minima are most probably related to the fluctuations in the vicinity of the critical point. Another line is the line of maxima of thermal conductivity of water along isobars which starts at K and bar and ends up at K and bar. Like in the case of viscosity this line looks to be disconnected to any special lines on the phase diagram. The interpretation of this line also requires further studies.
For further investigation of the novel anomalous region of water we performed molecular dynamics simulation. Two models of water were used - SPC/E spce and TIP4P tip4p . In both cases we simulated system of 4000 molecules in a cubic box with periodic boundary conditions. The temperature was varied from K up to K with step K. The density varied from up to with step . The phase diagrams of these models of water were calculated in several publications vega1 ; vega2 ; vega3 ; vega4 . It was found that all these models overestimate the melting pressure at a given temperature. That is why we expect that the melting density of models should be higher with respect to the experimental one and because of this we simulate the system up to such extremely high densities. The time step was set to 1 fs. The equilibration period consisted of steps. After that steps were performed for production. We calculated the equations of state and internal energy of the system at all data points. The data were used to construct polynomial approximations of internal energies and pressures. The approximation for energy was used to calculate the isochoric heat capacity . From approximations of both internal energy and pressure we calculated the enthalpy and used it to calculate the isobaric heat capacity . Our main goal was to see whether these models demonstrate the maxima of heat capacities in the pressure range from bar up to bar. All simulations were performed using lammps simulation package lammps .
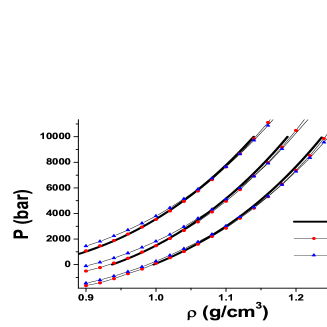
Fig. 4 demonstrates equations of state from NIST database and from molecular dynamics simulations. Both TIP4P and SPC/E models are shown. One can see that both models give rather accurate values of pressure. Both models a bit underestimate the pressure at high densities. SPC/E model also overestimates the pressure at the low densities. However, the overall agrement is not bad. However, the results for heat capacities obtained in simulations do not describe the experimental ones at all. For example, Fig. 5 shows isobaric and isochoric heat capacities along bar isobar. The results are given in dimensionless units, i.e. the temperature is measured in the units of energy. One can see that TIP4P model strongly overestimates the heat capacities. Moreover, while experimental and demonstrate maxima, no maximum is observed in TIP4P results. The results for SPC/E model also do not describe the experimental data. We can conclude that common models of water fail to reproduce the heat capacities in the high pressure region. Therefore no computational model known up to day is able to describe the novel region of anomalies.
In conclusion, we have analyzed the data on the properties of water in a vast region of thermodynamic parameters. The results allowed us to establish an existence of several novel anomalous properties of water which take place in the region of high pressure and relatively low temperature. These anomalies cannot be related to the critical points known up to date. The region of these anomalies can be represented as a triangle shown in Fig. 6 - anomalous triangle. At the moment there is no any explanation of the origin of the anomalies inside the triangle. Moreover, the most common theoretical models fail to describe the behavior of water in this region of pressures and temperatures. Development of novel models of water under high pressures is required.
We thank the Russian Scientifc Center at Kurchatov Institute and Joint Supercomputing Center of Russian Academy of Science for computational facilities. The work was supported by the Russian Science Foundation (Grant No 14-22-00093).
References
- (1)
- (2) P. Gallo et. al, Chemical Reviews, 116(13), 7463-7500 (2016).
- (3) L. Xu, P. Kumar, S. V. Buldyrev, S.-H. Chen, P. H. Poole, F. Sciortino, and H. E. Stanley, PNAS 102, 16558-16562 (2005).
- (4) V. V. Brazhkin, Yu. D. Fomin, A. G. Lyapin, V. N. Ryzhov, and E. N. Tsiok, J. Phys. Chem. B 115 (48), 14112 14115 (2011).
- (5) V. V. Brazhkin, Yu. D. Fomin, V. N. Ryzhov, E. E. Tareyeva, and E. N. Tsiok, Phys. Rev. E 89, 042136 (2014).
- (6) Yu. D. Fomin, V. N. Ryzhov, E. N. Tsiok, and V. V. Brazhkin, Phys. Rev. E 91, 022111 (2015).
- (7) A.R. Imre, U.K. Deiters, T. Kraska, I. Tiselj, Nuclear Engineering and Design 252, 179 183 (2012).
- (8) P. Gallo, D. Corradini and M. Rovere, Nature Communications 5, 5806 (2014)
- (9) O. Mishima and H. Eu. Stanley, Nature 396, 329-335 (1998).
- (10) G. Franzese and H. Eu. Stanley, J. Phys.: Condens. Matter 19, 205126 (2007).
- (11) J. L. F. Abascal and C. Vega, J. Chem. Phys. 133, 234502 (2010).
- (12) K. T. Wikfeldt, C. Huang, A. Nilsson, and L. G. M. Pettersson, J. chem. Phys. 134, 214506 (2011)
- (13) Wagner, W., Saul, A., Pruß, A. International Equations for the Pressure along the Melting and along the Sublimation Curve of Ordinary Water Substance. J. Phys. Chem. Ref. Data 23, 515-527 (1994).
- (14) IAPWS, Revised Release on the Pressure along the Melting and Sublimation Curves of Ordinary Water Substance (2011), http://www.iapws.org, Date of access: 02/08/2015
- (15) Schwager, B., Chudinovskikh, L., Gavriliuk, A., Boehler, R. Melting curve of H2O to 90 GPa measured in a laser-heated diamond cell. J. Phys.: Condens. Matter 16, S1177 (2004).
- (16) Goncharov, A. F. et al. Dynamic ionization of water under extreme conditions. Phys. Rev. Lett. 94, 125508 (2005).
- (17) Lin, J. F. et al. High pressure-temperature Raman measurements of H2O melting to 22 GPa and 900 K. J. Chem. Phys. 121, 8423-8427 (2004).
- (18) Lin, J. F. et al. Melting behavior of H2O at high pressures and temperatures. Geophys. Research Lett. 32, L11306 (2005).
- (19) Datchi, F., Loubeyre, P., LeToullec, R. Extended and accurate determination of the melting curves of argon, helium, ice (H2O), and hydrogen (H2). Phys. Rev. B 61, 6535 (2000).
- (20) Thermophysical Properties of Fluid Systems, (2011) http://webbook.nist.gov/chemistry/fluid
- (21) Pressure and Boiling Points of Water, (2010) , Date of access: 02/08/2015
- (22) Ya. Rosenfeld, Phys. Rev. A 15 (1977) 2545.
- (23) Ya. Rosenfeld, J. Phys.: Condens. Matter 11 (1999) 5415.
- (24) Yu. D. Fomin, V. N. Ryzhov, and N. V. Gribova, Phys. Rev. E 81, 061201 (2010).
- (25) Yu.D. Fomin, V.N. Ryzhov, Physics Letters A 375, 2181 2184 (2011).
- (26) Yu. D. Fomin, E. N. Tsiok, and V. N. Ryzhov, J. Chem. Phys. 135, 124512 (2011).
- (27) Yu. D. Fomin and V. N. Ryzhov, Advanced in Chemical Physics, 152, 81 (2013).
- (28) H. J. C. Berendsen, J. R. Grigera, and T. P. Straatsma, J. Phys. Chem. 91, 6269 6271 (1987).
- (29) W. L. Jorgensen, J. Chandrasekhar, J. D. Madura, R. W. Impey, and J. Klein J. Chem. Phys. 79, 926 935 (1983).
- (30) E. Sanz, C. Vega, J. L. F. Abascal, and L. G. MacDowell, Phys. Rev. Lett. 92, 255701 (2004).
- (31) J. L. F. Abascal, E. Sanz, R. Garc a Fern ndez, and C. Vega, J. Chem. Phys. 122, 234511 (2005).
- (32) C. Vega, J. L. F. Abascal, E. Sanz, L. G. MacDowell and C. McBride, J. Phys. Condensed. Matter 17, S3283 S3288 (2005).
- (33) M. M. Conde, M. A. Gonzalez, J. L. F. Abascal, and C. Vega, J. Chem. Phys. 139, 154505 (2013).
- (34) S. Plimpton, J. Comp. Phys, 117, 1-(1995), http://lammps.sandia.gov/index.html