\ul
Impact of Detour-Aware Policies on Maximizing Profit in Ridesharing
Abstract
This paper provides efficient solutions to maximize profit for commercial ridesharing services, under a pricing model with detour-based discounts for passengers. We propose greedy heuristics for real-time ride matching that offer different trade-offs between optimality and speed. Simulations on New York City (NYC) taxi trip data show that our heuristics are up to optimal and times faster than the (necessarily) exponential-time optimal algorithm.
Commercial ridesharing service providers generate significant savings by matching multiple ride requests using heuristic methods. The resulting savings are typically shared between the service provider (in the form of increased profit) and the ridesharing passengers (in the form of discounts). It is not clear a priori how this split should be effected, since higher discounts would encourage more ridesharing, thereby increasing total savings, but the fraction of savings taken as profit is reduced. We simulate a scenario where the decisions of the passengers to opt for ridesharing depend on the discount offered by the service provider. We provide an adaptive learning algorithm IDFLA that learns the optimal profit-maximizing discount factor for the provider. An evaluation over NYC data shows that IDFLA, on average, learns the optimal discount factor in under iterations.
Finally, we investigate the impact of imposing a detour-aware routing policy based on sequential individual rationality, a recently proposed concept. Such restricted policies offer a better ride experience, increasing the provider’s market share, but at the cost of decreased average per-ride profit due to the reduced number of matched rides. We construct a model that captures these opposing effects, wherein simulations based on NYC data show that a increase in market share would suffice to offset the decreased average per-ride profit.
1 Introduction
Ridesharing is a key initiative that can curb ever-increasing congestion on the urban transportation network and is an important means to move the world towards a sustainable future. While the term ridesharing has been used to include peer-to-peer carpooling platforms as well, here we focus on commercial ridesharing service providers such as LyftLine and UberPool, that hold a significant share of the ridesharing population.
While ridesharing is undoubtedly appealing from a sustainability perspective, profit maximization is the primary goal of commercial providers. Given the emerging literature on detour-aware pricing and routing policies, e.g., [1, 2] that enhance the ride experience, algorithms for profitable ride-matching should adapt to keep up. Such quality-enhancing policies encourage increased adoption of ridesharing, but perhaps at the cost of reduced average per-ride profit. We study three connected issues centered around profit optimization in commercial ridesharing.
First, it is unclear how to tune real-time ride-matching algorithms to quickly find a near-optimal set of matches that results in high profit under detour-based discounts (the exact optimization is an NP-hard problem [3]).
Second, ridesharing generates significant economic savings by reducing the driver-miles necessary to serve a set of passengers, which are split between the service provider (their profit) and the passengers (as discounts). It is not obvious how this split should be effected, since higher discounts encourage more ridesharing, increasing total savings, but the fraction of savings that constitutes the profit is smaller.
Third, in order to survive in an increasingly competitive market, ridesharing providers adopt additional quality-enhancing features which do not align fully with the goal of profit maximization, perhaps resulting in lower profit (due to the smaller feasible set of quality-compliant rides). It is important to understand the overall impact on profitability, and ensure that any resulting increase in market share can counter the reduced average per-ride profit.
The issues mentioned above are crucial for commercial ridesharing platforms; however, they are less explored. We address these issues, give solutions, and provide extensive evaluation on a real-world dataset.
1.1 Our Contributions
We investigate three important aspects of profit optimization in commercial ridesharing, resulting in the following contributions:
-
•
In Section 3, given a detour-based discount policy, we provide an Integer Linear Program (ILP), and a family of efficient greedy heuristics that quickly match passengers to rides to approximately maximize profit. We evaluate their performance experimentally.
-
•
In Section 4, under a model in which the likelihood of opting for ridesharing depends on the offered discount, we propose an adaptive algorithm that learns the profit-maximizing discount parameter.
- •
2 Related Work
There is a huge body of literature that studies several optimization problems related to ride sharing [4, 5, 6], but the problem of pricing in ridesharing has been relatively less studied, with profit optimization rarely discussed. [7] characterizes the pros/cons of static versus dynamic pricing. [1] provides heuristics for maximizing profit subject to bounded detours. In contrast, we study profit maximization over a pricing model that incorporates a detour-based discount.
[8] proposes a dynamic, demand-responsive ridesharing system using auction mechanisms, where customers enjoy additive detour-based discounts. Our model considers multiplicative detour-based discounts; moreover, we also provide an algorithm to learn the profit-maximizing discount parameter under a suitable user choice model.
A closely related problem is that of cost sharing in peer-to-peer ridesharing or carpooling, which, until recently, received little attention. Individual passengers are either asked to post what they are willing to pay in advance [9], to share the total cost proportionately among themselves according to the distances travelled [10, 11], or negotiate their shares on their own during/after the ride. Such methods ignore the real-time costs and delays incurred during the ride and are generally insensitive to the disproportionate delays encountered during the ride. Fair cost sharing in ridesharing has been studied [12, 13, 14, 15, 2], but its impact on profitability is left unexplored. We fill this gap by studying the trade-off between average per-ride profits and market share.
3 Matching Rides to Maximize Profit
Ridesharing generates significant profit to commercial platforms such as Uber and Lyft. The profit from a single cab is the difference between the fare paid by the passengers and the amount paid to the driver. When compared to assigning each user their own cab, ridesharing requires fewer cabs to serve the same set of users, leading to increased profit.
At the core of these platforms is a real-time matching algorithm that runs at regular time intervals, and generates a set of matched users from a set of waiting users (preprocessed to accommodate other spatio-temporal constraints). Such a system would maintain a pool of pending requests, and then invoke the matching algorithm every few minutes to determine optimal matches. We provide matching heuristics that directly optimize profit, under a detour-based discount scheme. Any unmatched requests left at the end of the algorithm either wait for another round, or, after a certain waiting time threshold elapses, are assigned fresh, empty cabs. Thus, it is important to provide a time-efficient matching algorithm for the larger dynamic ridesharing system to be sufficiently responsive to incoming user requests.
Moreover, under a detour-based discount policy, shared rides with smaller detours are more likely to be profitable. However, such a myopic observation could lead to suboptimal solutions, thus rendering the problem nontrivial.
In Section 3.1, we provide an Integer Linear Program (ILP) that matches users to shared cabs (each with capacity ) to maximize profit, given a multiplicative detour-based discount , which is a linear function of the distance-wise () and time-wise () fractional detours experienced by user . is the “base” (fixed) cost for a ride, and are the costs per unit distance and time, respectively. is the fraction of driver earnings taken by the service provider.
3.1 ILP Formulation
Each user is associated with a source-destination pair . We consider initially empty cabs and construct a complete directed graph with vertices that represent all the sources and destinations, that is, . Each directed edge represents the best route from location to , and weights and denote the corresponding distance and time, respectively.
The ILP seeks values to assign to a set of optimization variables in order to maximize an objective function subject to a set of constraints.
Optimization Variables: Let denote whether or not user is served by cab along edge . Let denote whether cab travels along edge while serving one or more users. Let denote whether cab serves at least one user. We set if .
Objective Function:
For each user , we have:
-
(a)
Distance travelled, .
-
(b)
Time in travel, .
-
(c)
Distance-wise fractional detour, .
-
(d)
Time-wise fractional detour, .
-
(e)
The passenger’s fare is computed as,
For each cab , we have:
-
(a)
Distance traveled, .
-
(b)
Time in travel, .
-
(c)
Driver earnings, .
Thus, the objective function to be maximized is the total profit, given by
.
Constraints:
-
(i)
if and only if for some :
-
(ii)
if and only if for some :
-
(iii)
Each user is picked up by exactly one cab:
-
(iv)
Each user is dropped off by exactly one cab:
-
(v)
Each user is not served before pickup:
-
(vi)
Each user is not served after dropoff:
-
(vii)
Each user is served by a single cab, only between pickup and dropoff:
-
(viii)
Each cab serves at most users along any edge:
-
(ix)
Each cab’s overall route is not disjoint, i.e., there are no gaps between serving users during which the cab is empty. Equivalently, if a cab serves a total of users, then it must do so using exactly edges:
The inequality () is to allow empty cabs ().
-
(x)
Binary integer constraints:
Computing the optimal solution to the ILP takes a lot of time and memory, and is unsuitable for real-time matching, which requires fast, near-optimal techniques. However, it is a handy benchmark against which to experimentally evaluate the performance of our proposed methods (Section 3.3).
3.2 Heuristics for Real-Time Ride Matching
Given a set of users matched to a cab, the driving distance and time for the best route for serving all the users are denoted by and , respectively. For each user , and denote the driving distance and time from to along that route, respectively. Thus, the profit from a cab serving a set of users can be computed as follows:
-
•
User Cost: The cost of the ride to user ,
(1) where =, and =.
-
•
Driver Earnings: The earnings to the driver from the ride,
(2) -
•
Profit: The profit to the service provider,
(3)
The incremental profit of merging two cabs (combining the users matched to two cabs into one and removing the other cab from the system), serving sets of users and is:
| (4) |
The above framework for real-time ride matching is more general than that of the ILP. A limitation of the ILP is that is restricted to be a linear function. Moreover, it may not be possible for an ILP to explicitly incorporate additional detour-aware routing constraints and user preferences. However, during performance evaluation of our proposed methods, we limit the scope to the constraints listed in Section 3.1, in order to compare against the optimal ILP solution.
Greedy-Max-Profit-Based Method:
We now describe a greedy method for profit-maximizing real-time matching. We begin by assigning each of input users to their “own” cab, i.e., no two users are assigned to the same cab.111We assume that all cabs are initially empty; however, our methods extend to a more general case where some cabs already have passengers in them with their own constraints to begin with. We maintain two collections of cabs, namely, a set of unavailable cabs and a current pool of cabs . We initialize with the single-user cabs and . We repeatedly perform the following steps until is empty, at which point, we return as the output:
-
(a)
For every two cabs and in , if it is feasible to merge them subject to the capacity constraint (and any other optional constraints), compute the corresponding incremental profit .
-
(b)
Find two cabs and such that is maximum. If , terminate and return as output. Otherwise, merge them and replace the individual cabs and in with the merged cab. If the merged cab has passengers, move it from to .
Note that each iteration either terminates the method, or decreases the size of by at least one; therefore, the method terminates after at most iterations. The time complexity of this method is .
Greedy-Order-Based Methods:
Now we describe a family of faster greedy heuristics (parameterized by an order protocol). We create an ordered list of the initial single-user cabs according to a certain order, and initialize the set of unavailable cabs . At each iteration, we pick the cab at the top of the list (say ) and merge it with the first cab down the list such that , subject to the capacity constraint (and any other optional constraints), remove the individual cabs and from and insert the merged cab at the appropriate position in . If no such cab exists, then is moved from to . If the merged cab has passengers, we move it from to . These methods have a time complexity of .
3.3 Experimental Performance Evaluation
In order to compare the performance of our proposed greedy methods, we evaluate them against the optimal solution computed by solving the ILP of Section 3.1. Since the ILP takes a prohibitively long time to output the optimal solution, we first evaluate the near-optimality of our methods using a small dataset, and then use a larger dataset for demonstrating the scalability and comparing the speed-optimality trade-off of our proposed heuristics among themselves. We consider two orders when evaluating Greedy-Order-Based methods:
-
(a)
Distance Order: Decreasing order of .
-
(b)
Profit Order: Increasing order of .
Experimental Setup:
We evaluate our methods using publicly available New York City (NYC) taxi trip data [16]. The GB dataset has logs for all NYC trips taken in . Each trip in the dataset specifies pickup and dropoff coordinates, pickup time, dropoff time, trip distance and travel time. Each trip is considered as a “user” for our simulation. We assume that each cab serves at most users.
We discretize the underlying NYC map into grids of area and select representative landmarks using the methodology of [17]. We precompute the inter-landmark distance and time using Open Trip Planner [18]. For each user, we map their source and destination coordinates to their nearest representative landmarks and use the precomputed values for computing necessary metrics such as profit, detour, driving distance and time.
The values , , , and are taken from publicly available Lyft user pricing and driver payment data [19, 20].
Experimental Results:
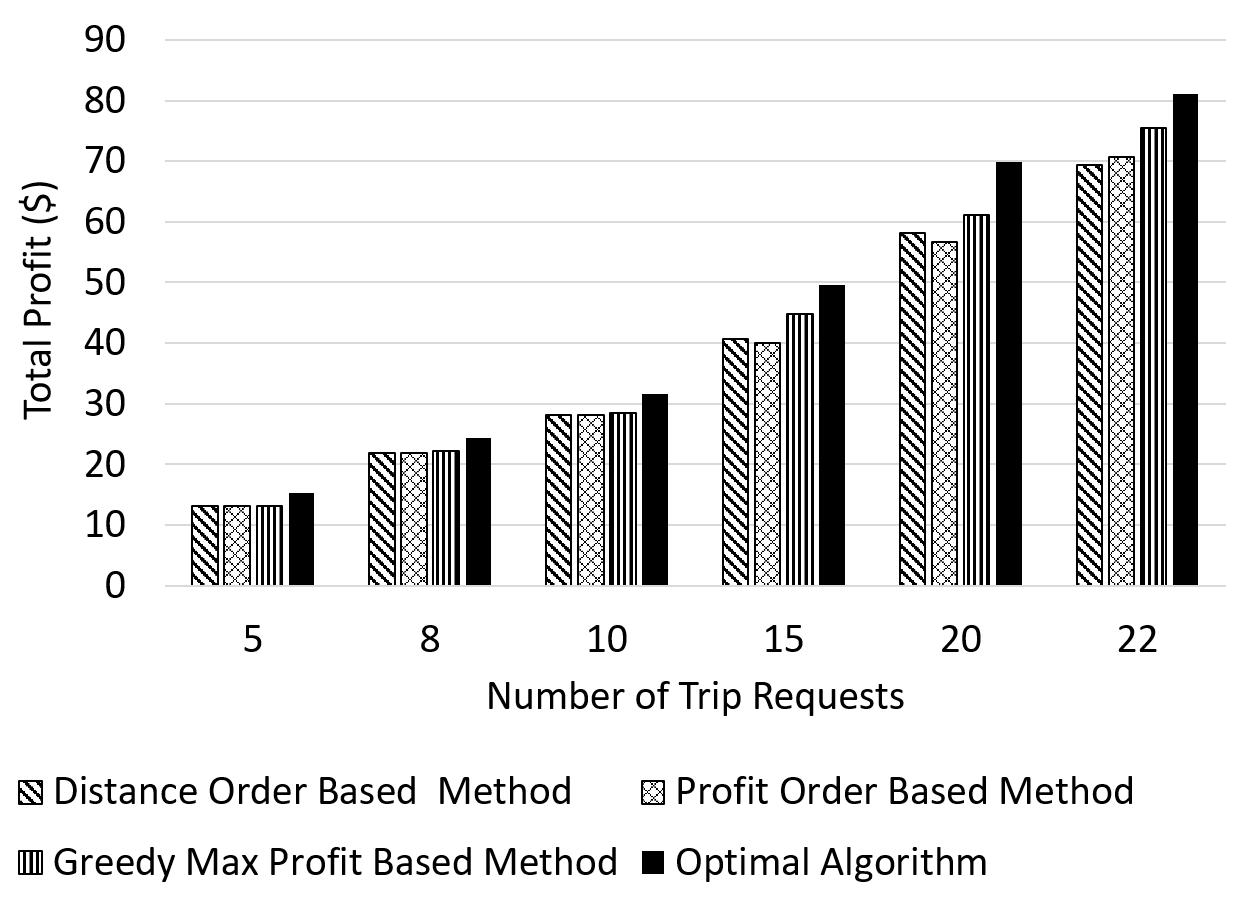
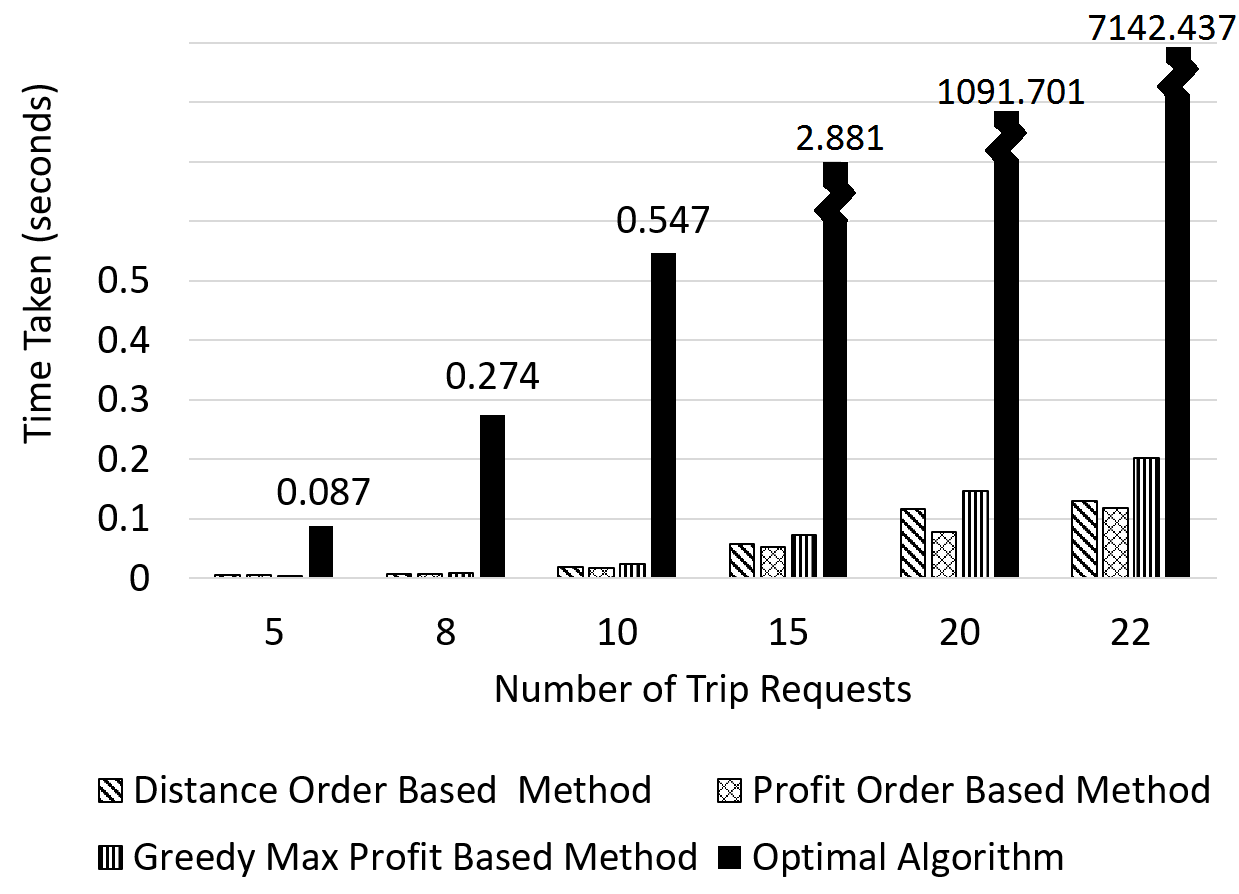
We select NYC taxi trips on randomly chosen days of , between : - : pm. We intentionally choose the rush times, since many shared rides would be possible, and it would be interesting to see how our proposed heuristics perform. We run our methods on several subsamples by considering a different number of users each time (, , , , , and ). We compare the total profit generated (Figure LABEL:fig:profit_20) and the total time taken (Figure LABEL:fig:time_20) across each method, averaged over the small-sized subsamples of users. We observe that the total profit obtained by the Greedy-Max-Profit-Based method is up to optimal and runs times faster than the optimal algorithm on a machine with a quad Intel Core i7 processor with GB RAM. The optimal algorithm becomes intractable for instances where the number of users exceeds (terminated after over hours due to lack of memory).
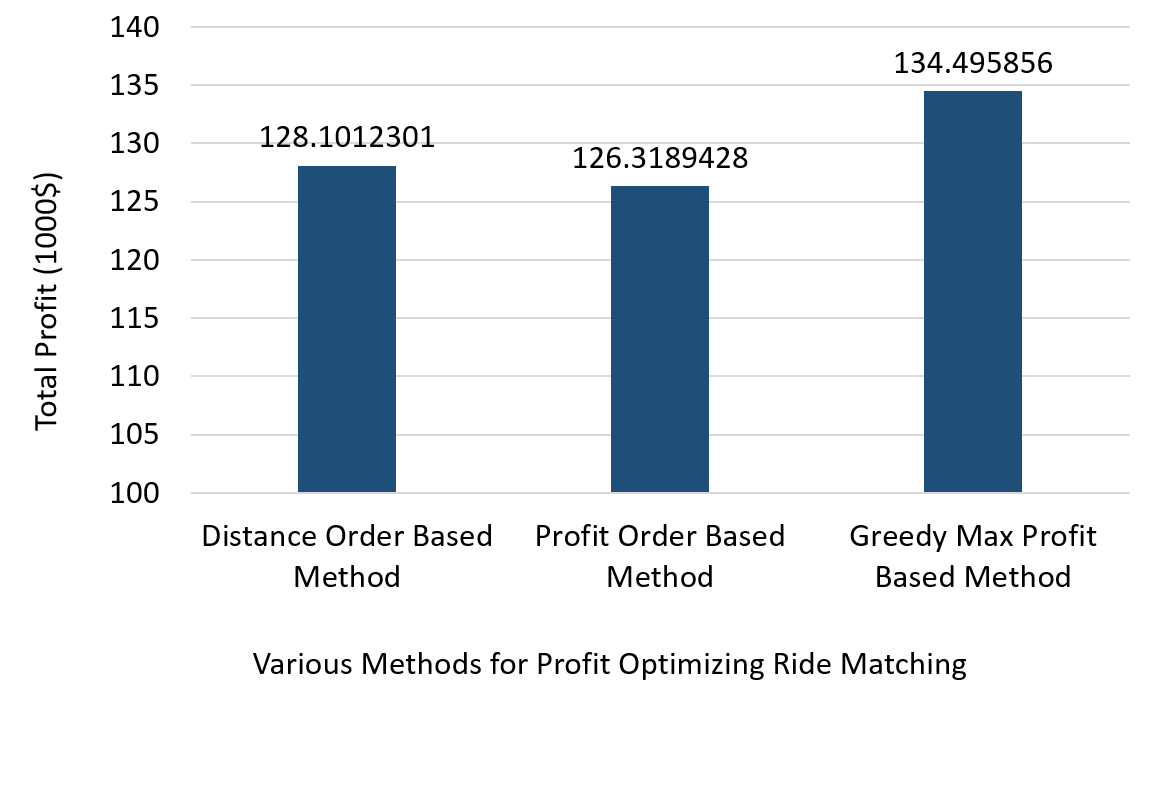
Our proposed algorithms scale to a larger input set with users (obtained from a one-hour slot). The Greedy-Max-Profit-Based method takes minutes while the Distance-Order-Based and Profit-Order-Based methods take and minutes, respectively.222If the matching algorithm is invoked once per minute, in NYC, there are only requests per minute on average, for which all of our proposed greedy methods finish in less than a second. Figure 2 shows that the performance of the former is significantly better than that of the latter methods in terms of the total profit. Thus, the speed-optimality trade-off becomes important in choosing the method that best suits the needs of a service provider. Finally, we also observe that the Greedy-Max-Profit-Based method matches users into cabs (reducing the operational cost significantly), obtaining a profit of .
4 Learning the Optimal Discount Policy
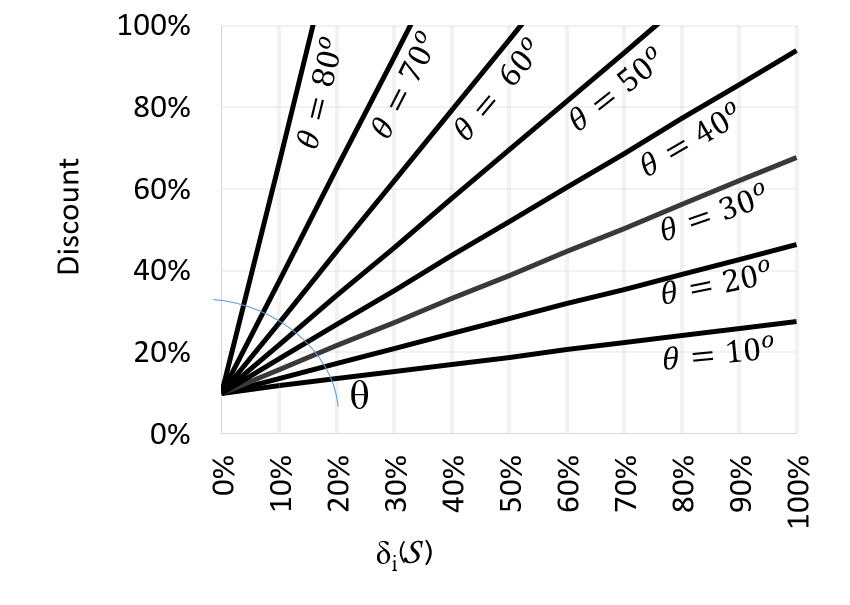
In the previous section, we laid out efficient ride-matching heuristics to maximize profit under a fixed detour-based discount for users. In this section, our goal is to learn the optimal detour-based discount policy, under a fixed ride-matching algorithm. For simplicity, we assume that the detour-based discount is a linear function of the fractional distance-wise detour. Thus, the discount to a user is given by
| (5) |
where is a constant denoting the minimum discount given to a user (to incentivize them to opt for ridesharing in the first place), and the discount parameter governs how steeply the discount increases with the detour. Figure 3 plots (5) for various values of , assuming .
Let denote the probability of a user opting to rideshare, a nondecreasing function of . A larger would lead to a larger population of users who are willing to rideshare, and potentially more shared rides; however, the profit from each shared ride would be smaller. Since the expected total profit depends on the number of users opting to rideshare, as well as the per-ride profit, it is important to find a value of that provides the optimal balance to maximize the expected total profit. We propose a method, which we call Iterative Discount Function Learning Algorithm (IDFLA), that learns such a over a period of time.
Each day, a value of is declared by the service provider. In response, the users who opt for ridesharing are then matched throughout the day using one of the heuristics from Section 3.2. The total profit earned is computed at the end of the day. IDFLA (Algorithm 1) learns the expected daily profit earned using different values of , and eventually converges to the best that maximizes this quantity. This kind of sequential decision making in stochastic environment can be categorized as a stochastic multi-armed bandit problem [21], where the values are the arms, and the daily profit earned by using a certain is the reward earned by pulling the corresponding arm. IDFLA uses a popular technique for solving stochastic multi-armed bandit problems, called UCB1 [22].
4.1 Performance Evaluation of IDFLA
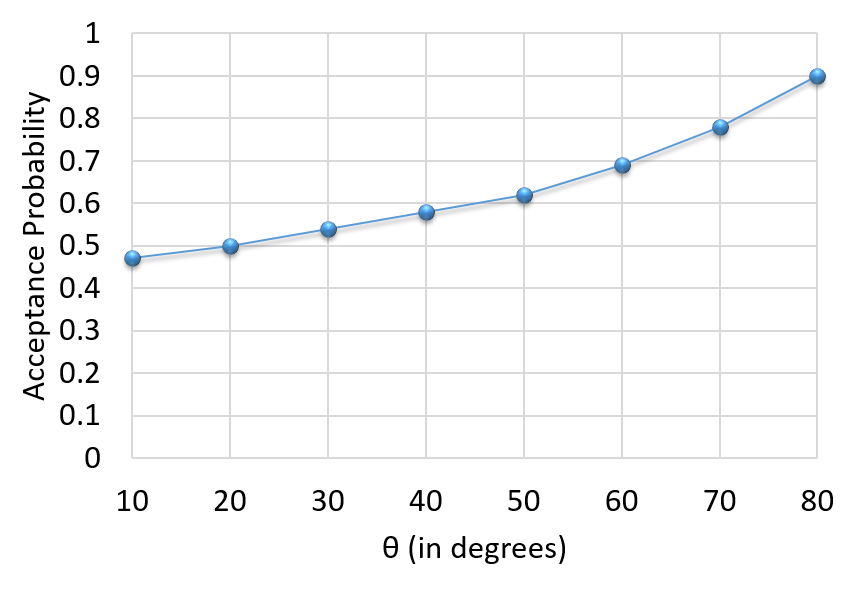
We evaluate our learning method IDFLA under the Greedy-Max-Profit-Based ride-matching heuristic. We take , and run IDFLA to find near-optimal discount parameter, . The value of optimal discount parameter depends on which is the probability of opting rideshare. For simulating the user-behavior, we need to assume to be any non-decreasing function of . In practice, this probability is estimated while the optimal is learnt (step 14 of IDFLA). This corresponds to the fraction of times () the users have opted for ridesharing whenever the discount parameter was . The function that we have assumed for our simulation, is shown in Figure 4.
Taxi trips in NYC between : - : pm of the Wednesdays of were used to compare the performance of IDFLA with an “oracle” method (BDF) that knows the Best Discount Function apriori. Figure 5 shows the average daily profit obtained by declaring the same discount function everyday. We observe that the best discount function is obtained when ; therefore, BDF chooses everyday.
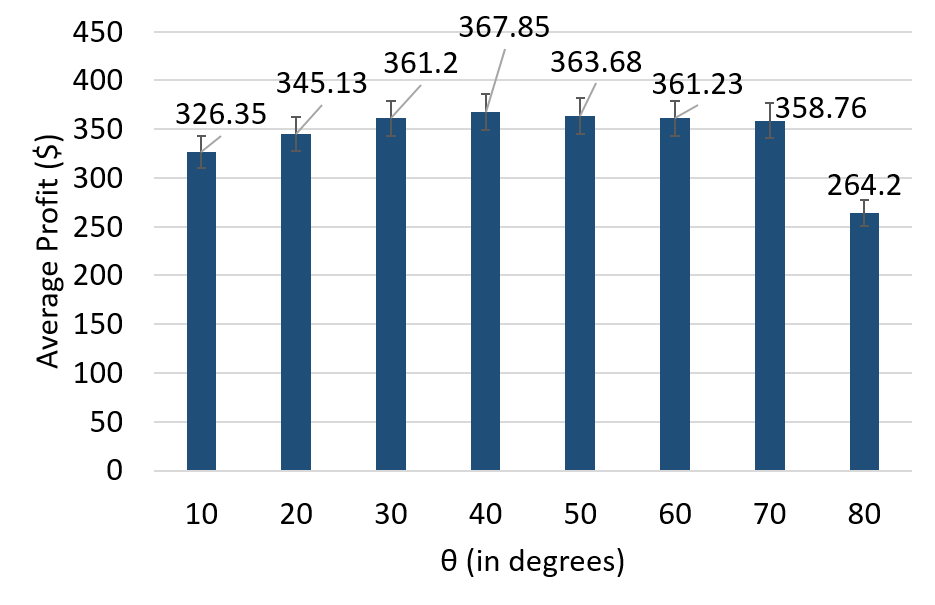
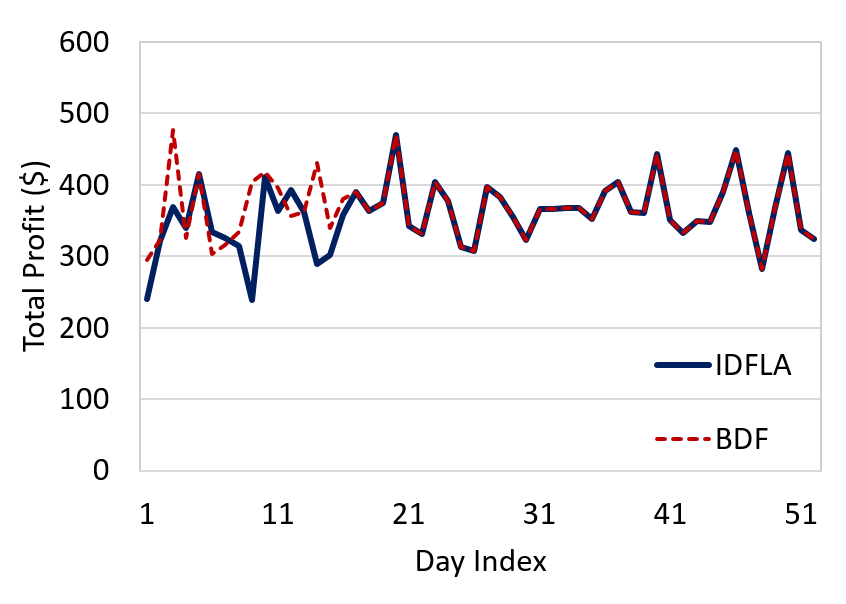
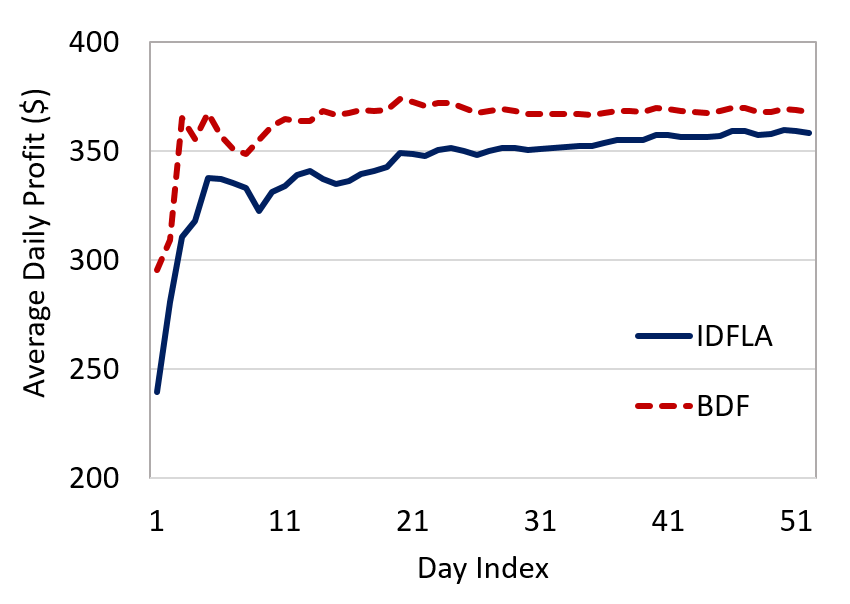
Figure LABEL:fig:total_profit_52 shows that the discount parameter selected by IDFLA converges to that of BDF in days. We also observe (Figure LABEL:fig:average_profit_52) that the average daily profit, that is, the cumulative total profit over days divided by , converges to that of the best discount function BDF. We show that after days, the difference333The difference between the average reward of a learning algorithm to that of the optimal is called regret. An upper bound on the regret of UCB1 after iterations is [22], when each arm’s reward is a bounded random variable. in average daily profit obtained by IDFLA and BDF is just , or . Thus, IDFLA quickly learns the optimal discount parameter that can help the service provider maximize profit while keeping users sufficiently happy by providing suitable discounts.
5 Impact of Detour-Aware Routing
In conjunction with desirable pricing schemes for ridesharing users, recent work has proposed detour-aware routing policies that impose upper bounds on the total detour [1] (static) or incremental detours [2] (dynamic). Such detour-aware routing policies work together with detour-based discount policies in order to enhance the quality of the ride experience for ridesharing users. This induces a similar trade-off as the one in Section 4: imposing additional quality-enhancing constraints into the ride-matching process incentivizes greater adoption of ridesharing and increases the market share of the ridesharing population, but could result in reduced average per-ride profit. In this section, we consider the impact of one such detour-aware routing policy, based on the concept of Sequential Individual Rationality (SIR), introduced by [2].
SIR guarantees that the disutility to existing users (sum of the monetary cost and an “inconvenience cost” due to detours) in a shared ride is non-increasing as additional users are picked up. A parameterized version of SIR, called SIR-, ensures that the incremental benefit (decrease in disutility) to an existing user upon picking up a new user is at least , where . Imposing SIR- results in a reduced set of feasible matched rides, leading not only to reduced average per-ride profit, but also a potential loss due to the “up-front discounts” (the parameter in (5)) given to the passengers who opt for ridesharing, but end up being unmatched. However, the resulting detour-aware routing policy improves the quality of shared rides, thereby increasing the market share of ridesharing users, which could offset these negative effects. Unlike [2] that looks at the detour-aware routing policy from the user perspective (especially fairness), in this work we answer such a scheme’s impact on the service provider’s profit.
We investigate this phenomenon by performing experiments to address the following questions:
-
(a)
What is the trade-off between fewer matched rides and increased market share, compared to a scenario where no SIR- is imposed? How does this affect the profit?
-
(b)
How sensitive is the profit to the fraction of additional users who opt for ridesharing in response to the adoption of detour-aware routing by imposing SIR-?
5.1 Experimental Setup
As before, we use NYC taxi trip data for our experiments. We randomly select a weekday of and a one hour time slot on that day. We then split the hour into one-minute instances, and collect the sources and destinations for the users who initiated trips in each instance. The average number of users per instance is . While reporting our results, we take an average across these instances.
The parameters , , , and are taken from publicly available Lyft user pricing and driver payment for NYC [19, 20]. We select “detour-sensitivities” (higher values imply more aversion to detours) randomly from per mile.We assume that each cab serves at most users, so that the profit maximization problem can be solved optimally in polynomial time using Edmond’s algorithm [23].444The experiments can be carried out for as well, by using one of our proposed heuristics from Section 3.2 instead. The driving distance and time between locations are obtained by querying Open Trip Planner [18]. The parameters of the linear detour-based discount policy (5) are and . To begin with, before imposing SIR-, we assume that the service provider’s initial market share is , within which each user opts for ridesharing with a probability directly proportional to and , and inversely proportional to .
For each instance, we keep the following fixed: user origins, destinations, whether they are part of the initial market share, and if so, whether they opted for ridesharing. Then, we generate realizations, where each user reacts to the adoption of a detour-aware routing policy (SIR-), by flipping biased coins parameterized by , which is a measure of how strongly users value a quality-enhancing detour-aware routing policy. This participatory behavior is one of many that can be used. For any behavior model, our primary interest is the fraction of users who end up opting for ridesharing, and not the generative process itself. In the coin-flip-based process, the first group of users, who are in the initial market share but did not opt for ridesharing, flip with bias that is directly proportional to , , and , and inversely proportional to , with denoting the constant of proportionality. The second group of users, who are outside the initial market share, flip with bias (the factor is hand-picked). The users who had already opted for ridesharing remain so. For consistency, we ensure that as we increase the value of , only users who have previously not opted for ridesharing flip again.
We calculate the profit obtained by matching users in the new market share. The parameter is varied from and , while is varied from to .
5.2 Experimental Results
Figure 7 shows profitability as increases for various values of . The baseline profit, without SIR-, is shown as a horizontal line. For any value of , there is a range of for which a higher profit can be obtained by imposing the appropriate SIR- policy. Moreover, when is high, the profit declines, because too many users remain unmatched.
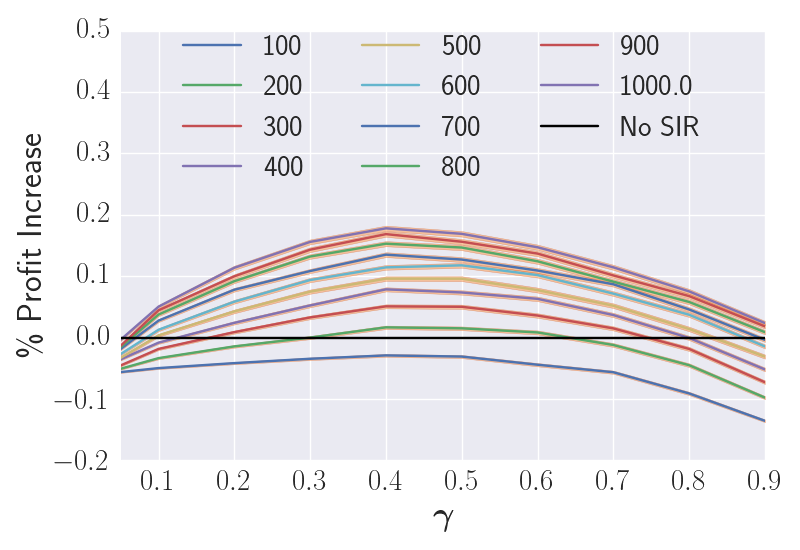
Figure 8 shows a different visualization by plotting profitability as a function of , for different values of .
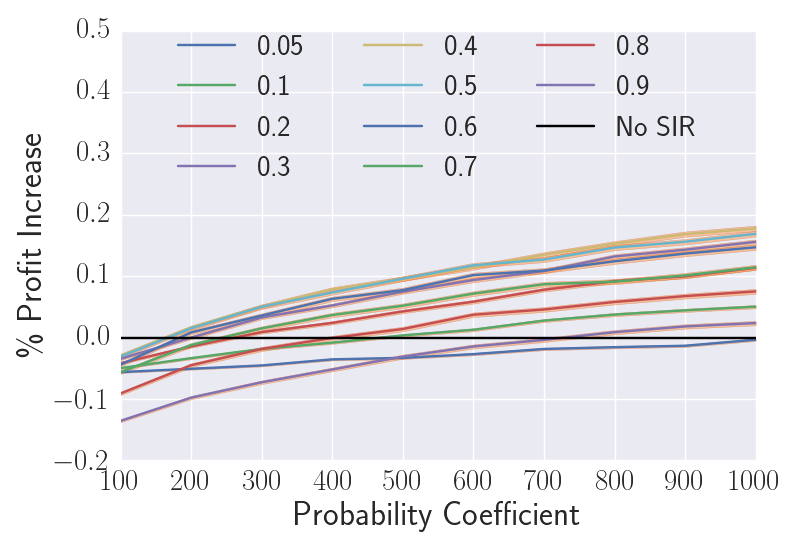
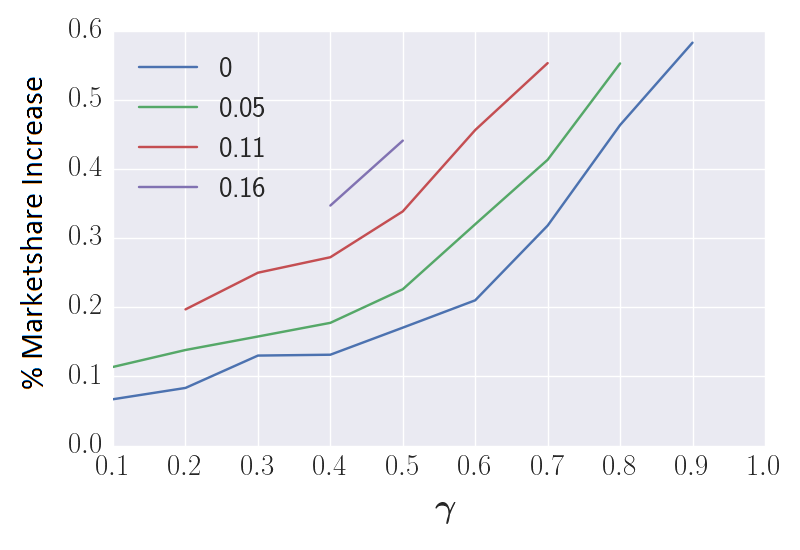
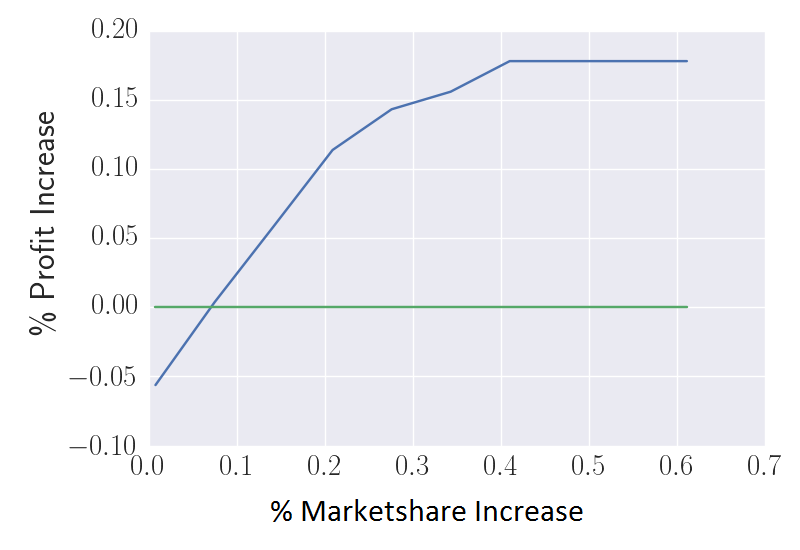
Figure 9 plots the minimum increase in market share that is necessary to meet a given lower bound on the profit, as a function of . For instance, to be more profitable, a increase is needed, as shown by the green curve. Alternatively, Figure 10 shows the maximum possible increase in profit (over all ), as a function of the increase in market share. The key takeaway here is that a increase555A increase in market share in response to a quality-enhancing policy is not unrealistic. Lyft’s market share increased by over in , owing in large part to better quality of service, resulting in Lyft’s customers being happier than those of their primary competitor, Uber [24]. in market share is sufficient to recover from the negative effects (on the profit) of adopting a detour-aware routing policy.
6 Concluding Remarks
In this paper, we adopt a profit-centric view of real-time ridesharing system design, and undertake an empirical investigation of three key elements that impact profit, namely (a) real-time ride matching, (b) user discounts, and (c) detour-aware routing, by using publicly available NYC taxi trip data.
An optimal ride matching algorithm, even on a small set of requests, can take hours, while our greedy heuristics generate near-optimal profit in less than of the time, and scale well, e.g., matching trip requests into cabs, while offering different trade-offs between optimality and running time. Our adaptive learning algorithm called IDFLA learns the optimal detour-based discount parameter that achieves the right balance between the number of passengers who opt for ridesharing and the portion of savings taken as profit from each shared ride, within iterations. Finally, we demonstrate that even a small market share increase of , in response to other restricted detour-aware policies such as sequential individual rationality, is sufficient to counter the reduced per-ride profit due to the restricted constraints. Thus, one of our contributions is also a holistic treatment of the framework for detour-aware policies.
Given the encouraging empirical results of our proposed solutions for profit optimization, future work should explore corresponding theoretical results, e.g., approximation guarantees for the proposed greedy ride-matching heuristics, regret bounds for the proposed learning algorithm IDFLA, and a formal mathematical analysis to characterize the dependence between profit under a detour-aware routing policy and market share of users who opt for ridesharing. Another interesting direction to explore is the interplay between these different elements, e.g., how does a detour-aware routing policy affect the performance of the ride-matching heuristics and the convergence of the learning algorithm?
References
- [1] J. Jung, R. Jayakrishnan, and J. Y. Park, “Design and modeling of real-time shared-taxi dispatch algorithms,” in Proc. Transportation Research Board 92nd Annual Meeting, 2013.
- [2] R. Gopalakrishnan, K. Mukherjee, and T. Tulabandhula, “The costs and benefits of ridesharing: Sequential individual rationality and sequential fairness,” CoRR, vol. abs/1607.07306, 2016.
- [3] J.-F. Cordeau, G. Laporte, M. W. Savelsbergh, and D. Vigo, “Vehicle routing,” in Handbooks in operations research and management science: Transportation. Elsevier, 2006, vol. 14, ch. 6, pp. 367–428.
- [4] M. Furuhata, M. Dessouky, F. Ordóñez, M.-E. Brunet, X. Wang, and S. Koenig, “Ridesharing: The state-of-the-art and future directions,” Transportation Research Part B: Methodological, vol. 57, pp. 28–46, 2013.
- [5] N. Agatz, A. Erera, M. Savelsbergh, and X. Wang, “Optimization for dynamic ride-sharing: A review,” European Journal of Operational Research, vol. 223, no. 2, pp. 295–303, 2012.
- [6] D. Pelzer, J. Xiao, D. Zehe, M. H. Lees, A. C. Knoll, and H. Aydt, “A partition-based match making algorithm for dynamic ridesharing,” IEEE Transactions on Intelligent Transportation Systems, vol. 16, no. 5, pp. 2587–2598, 2015.
- [7] S. Banerjee, R. Johari, and C. Riquelme, “Pricing in ride-sharing platforms: A queueing-theoretic approach,” in Proceedings of the Sixteenth ACM Conference on Economics and Computation, 2015, pp. 639–639.
- [8] D. T. Nguyen, “Fair cost sharing auction mechanisms in last mile ridesharing,” Ph.D. dissertation, Singapore Management University, 2013.
- [9] B. Cao, L. Alarabi, M. F. Mokbel, and A. Basalamah, “SHAREK: A scalable dynamic ride sharing system,” in Proceedings of the 16th IEEE International Conference on Mobile Data Management (MDM), 2015, pp. 4–13.
- [10] R. Geisberger, D. Luxen, S. Neubauer, P. Sanders, and L. Volker, “Fast detour computation for ride sharing,” in Proceedings of the 10th Workshop on Algorithmic Approaches for Transportation Modelling, Optimization, and Systems, OASIcs-OpenAccess Series in Informatics, vol. 14. Schloss Dagstuhl-Leibniz-Zentrum fuer Informatik, 2010, pp. 88–99.
- [11] N. A. Agatz, A. L. Erera, M. W. Savelsbergh, and X. Wang, “Dynamic ride-sharing: A simulation study in metro atlanta,” Transportation Research Part B: Methodological, vol. 45, no. 9, pp. 1450–1464, 2011.
- [12] F. Bistaffa, A. Farinelli, G. Chalkiadakis, and S. Ramchurn, “Recommending fair payments for large-scale social ridesharing,” in Proceedings of the 9th ACM Recommender Systems Conference (RecSys), 2015, pp. 139–146.
- [13] A. Kleiner, B. Nebel, and V. A. Ziparo, “A mechanism for dynamic ride sharing based on parallel auctions,” in Proceedings of the Twenty-Second International Joint Conference on Artificial Intelligence (IJCAI), 2011, pp. 266–272.
- [14] D. Zhao, D. Zhang, E. H. Gerding, Y. Sakurai, and M. Yokoo, “Incentives in ridesharing with deficit control,” in Proceedings of the 2014 international conference on Autonomous agents and multi-agent systems (AAMAS), 2014, pp. 1021–1028.
- [15] E. Kamar and E. Horvitz, “Collaboration and shared plans in the open world: Studies of ridesharing,” in IJCAI, 2009, pp. 187–194.
- [16] C. Whong and A. Monroy-Hernández, “New York City taxi trips,” http://www.andresmh.com/nyctaxitrips, 2013, last accessed: 2016-06-18.
- [17] T. Rajasubramaniam, K. Mukherjee, G. Raravi, A. Metrewar, N. Annamaneni, and K. Chattopadhyay, “Xhare-a-ride: A search optimized dynamic ride sharing system with approximation guarantee,” in IEEE International Conference on Data Engineering, 2017.
- [18] “Open Trip Planner,” https://www.opentripplanner.org, 2016.
- [19] LyftLine, “Lyft Line Driver Pay,” https://help.lyft.com/hc/en-us/articles/213582268-Lyft-Line-Driver-Pay, 2016.
- [20] ——, “Lyft Line Pricing,” https://help.lyft.com/hc/en-us/articles/213815178-Lyft-Line-Pricing, 2016.
- [21] S. Bubeck and N. Cesa-Bianchi, “Regret analysis of stochastic and nonstochastic multi-armed bandit problems,” 2012, arXiv preprint arXiv:1204.5721.
- [22] P. Auer, N. Cesa-Bianchi, and P. Fischer, “Finite-time analysis of the multiarmed bandit problem,” Machine Learning, vol. 47, no. 2-3, pp. 235–256, 2002.
- [23] J. Edmonds, “Paths, trees, and flowers,” Canadian Journal of mathematics, vol. 17, no. 3, pp. 449–467, 1965.
- [24] A. Swan, “Sorry, Uber. Social Data Validates The Lyft Growth Story And Valuation Demands,” http://www.forbes.com/sites/andyswan/2016/08/31/sorry-uber-social-data-validates-the-lyft-growth-story-and-valuation-demands/, 2016.