In silico screening of drug-membrane thermodynamics reveals linear relations between bulk partitioning and the potential of mean force
Abstract
The partitioning of small molecules in cell membranes—a key parameter for pharmaceutical applications—typically relies on experimentally-available bulk partitioning coefficients. Computer simulations provide a structural resolution of the insertion thermodynamics via the potential of mean force, but require significant sampling at the atomistic level. Here, we introduce high-throughput coarse-grained molecular dynamics simulations to screen thermodynamic properties. This application of physics-based models in a large-scale study of small molecules establishes linear relationships between partitioning coefficients and key features of the potential of mean force. This allows us to predict the structure of the insertion from bulk experimental measurements for more than 400,000 compounds. The potential of mean force hereby becomes an easily accessible quantity—already recognized for its high predictability of certain properties, e.g., passive permeation. Further, we demonstrate how coarse graining helps reduce the size of chemical space, enabling a hierarchical approach to screening small molecules.
I INTRODUCTION
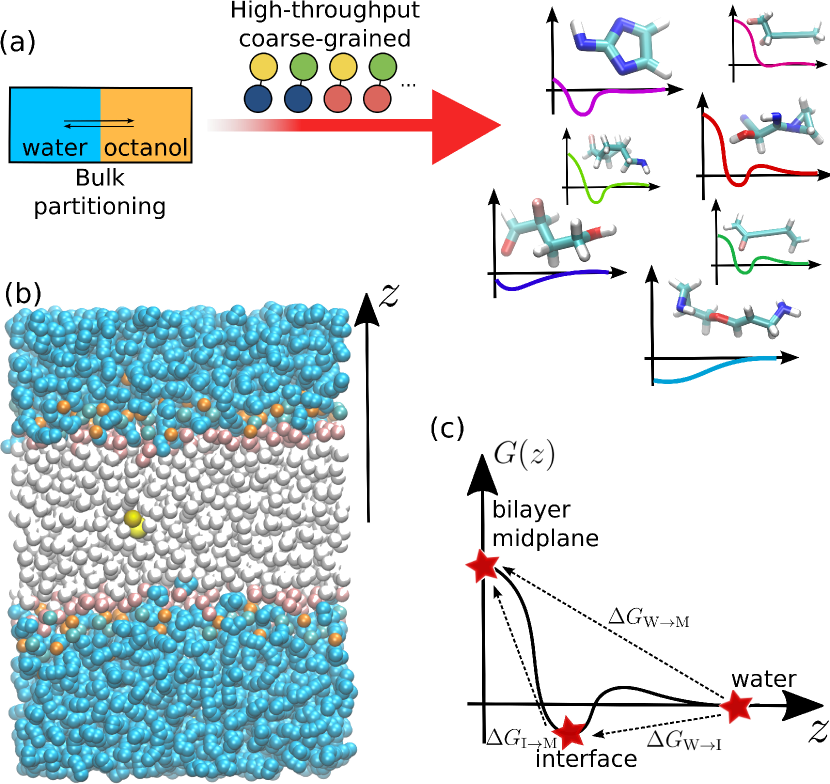
The thermodynamic partitioning of small molecules in lipid-bilayer membrane systems is a key parameter for assessing their suitability for pharmaceutical applications.Lopes et al. (2016); Shinoda (2016); Leung, Sindhikara, and Jacobson (2016) It follows that the thermodynamic partitioning is extremely relevant for high-throughput screening approaches to drug discovery. Experimentally, for different drug molecules it is typically obtained by measuring the bulk concentrations of the molecules in various systems that act as a proxy for the aqueous lipid membrane systems (e.g., oil/water or Caco-2 cell assays). Lopes et al. (2016); Breemen and Li (2016) The same property is obtained in silico by simulating the small molecule in an aqueous environment in the vicinity of a lipid-bilayer membrane (Fig. 1b). Further, structural resolution is provided by the potential of mean force, which describes how the free energy of the system changes as a function of certain reaction coordinates (Fig. 1c). In the context of drug-membrane interactions, the reaction coordinate is often the position of the molecule normal to the membrane.Lopes et al. (2016); Shinoda (2016) Several studies have investigated drug-membrane interactions using atomistic molecular dynamics simulations of specific sets of biomolecules (e.g., amino acids or drug molecules).MacCallum, Bennett, and Tieleman (2008); Carpenter et al. (2014); Lee et al. (2016); Bennion et al. (2017) Moreover, by means of an integrated measure, atomistic potentials of mean force were shown to accurately reproduce the experimental transfer free energies between water and membrane for different compounds.Jakobtorweihen et al. (2014)
However, these studies have proven to be severely computationally expensive, with roughly CPU hours needed to estimate the potential of mean force for each compound, even with the use of enhanced sampling techniques (e.g., umbrella sampling). Neale et al. (2011); Carpenter et al. (2014) Given the extensive computational resources required for these systems, a high-throughput scheme based on atomistic molecular dynamics simulations is currently unfeasible for spanning the large regions of chemical compound space needed to obtain broadly applicable structure-property relationships.
Coarse-grained molecular dynamics simulations provide a means to significantly reduce the computational expense of fully atomistic simulations while still capturing the relevant physical properties.Voth (2008); Noid (2013) Coarse-grained representations of molecules result from mapping groups of atoms to coarse-grained “pseudo-atoms” or beads. The interaction potentials of these beads are determined such that the essential properties of the fully atomistic system are retained at the coarse-grained level. This usually corresponds to a smoothing of the underlying atomistic free-energy landscape that preserves its relevant features, allowing for more efficient sampling. Adapting coarse-grained molecular dynamics simulations to high-throughput screening of chemical compounds requires flexible and reliable mapping and force-field parameterization methods. The coarse-grained Martini force field provides a robust set of transferable force-field parameters for a variety of biomolecular systems.Periole and Marrink (2013); Marrink and Tieleman (2013) Coarse-grained molecules—akin to a combination of functional groups—are constructed from a small set of bead types that encompass a representative spectrum of partitioning free energies between polar and apolar phases. We explore a small subset of chemical-compound space within this model by constructing all possible combinations of one- and two-bead molecules out of neutral bead types—119 in total. We then evaluate the partitioning of each compound in an aqueous lipid-bilayer system from potentials of mean force and free-energy differences. Our computational high-throughput screening scheme establishes linear relationships between key features of the potential of mean force across compounds, allowing a semi-quantitative estimation given the Martini representation of the compound and a single parameter: the water/octanol partitioning coefficient—an experimentally-accessible bulk property. Further, the 119 coarse-grained molecules backmap to at least 465,387 different organic small molecules ranging from 30 to 160 Da, demonstrating a significant reduction in chemical compound space due to the limited set of bead types of the coarse-grained model. We thus present two complementary ways to estimate key features of the potential of mean force for a large number of small molecules: from coarse-grained simulations and from linear relationships established in this work.
II METHODS
II.1 Molecular dynamics simulations
Molecular Dynamics simulations in this work were performed in GROMACS 4.6.6,Hess et al. (2008) using the Martini force field.Marrink, de Vries, and Mark (2004); Marrink et al. (2007); Monticelli et al. (2008); De Jong et al. (2013) We relied on the standard force field parametersDe Jong et al. (2016) with an integration time step of , where is the model’s natural unit of time.
A Parrinello-Rahman barostatParrinello and Rahman (1981) and a stochastic velocity-rescaling thermostatBussi, Donadio, and Parrinello (2007) provided control over the system pressure ( bar) and temperature (K). The corresponding coupling constants were and .
Bulk simulations consisted of and water and octane molecules, respectively. A DOPC membrane of was generated by means of the INSANE building toolWassenaar et al. (2015) and subsequently minimized, heated up, and equilibrated. The total number of lipids in the membrane was (64 per layer), immersed in water molecules. As usual when using non-polarizable Martini water, we added an additional of antifreeze particles in the simulations containing water molecules.Marrink et al. (2007)
In the case of two-bead molecules, we first considered a representative subset of 40 coarse-grained compounds, roughly uniformly covering a range of transfer free-energies from water to bilayer midplane of kcal/mol. We determined the corresponding potentials of mean force as a function of the distance of the compound from the bilayer midplane, , by means of umbrella-sampling techniques.Torrie and Valleau (1977) We set biasing potentials with a harmonic constant of kcal/mol/ every nm along the normal to the bilayer midplane, for a total of 24 simulations. In each of them, two solute molecules were placed in the membrane in order to increase sampling and alleviate leaflet area asymmetry.MacCallum, Bennett, and Tieleman (2008); Bereau, Wang, and Deserno (2014); Jakobtorweihen et al. (2014) The total production time for each umbrella simulation was . We estimated the free-energy profiles by means of the weighted histogram analysis method,Kumar et al. (1992); Bereau and Swendsen (2009); Hub, De Groot, and Van Der Spoel (2010) and the corresponding errors via bootstrapping.Mooney, Duval, and Duvall (1993) The same calculations were performed in order to determine the potentials of mean force for all of the 14 single-bead compounds analyzed in this work. The computational cost for the reconstruction of each potential of mean force amounted roughly to CPU hours.
In the comparison with atomistic resultsMacCallum, Bennett, and Tieleman (2008) presented in Fig. 3 and Fig. 5, we horizontally shifted the coarse-grained potentials of mean force by up to nm to correct for discrepancies in the bilayer thickness between the atomistic and the coarse-grained model, see Ref. Bereau and Kremer, 2015.
We herein focus on calculating and , the transfer free-energies between the three different environments—water (W), interface (I), and bilayer midplane (M)—along the potential of mean force, see Fig. 1c. In terms of , these are defined as and , where nm is the position of the lipid-water interface with respect to the bilayer midplane ().
The transfer free energies for all 105 coarse-grained two-bead molecules were determined from alchemical transformations.Chipot and Pohorille (2007) Given the excellent agreement between the two end points of a potential of mean force and the water/octane partitioning (see Sec. III.1 and Fig. 2), as already pointed out in Ref. Nikolic et al., 2011, the latter was used as a proxy for the hydrophobic core of the membrane.
For two compounds and , their respective water/interface and interface/octane transfer free energies are denoted by , , and . We can relate these quantities to alchemical transformations from to in fixed environments via
| (1) |
We computed , and by means of separate molecular dynamics simulations at the interface, in bulk water and in bulk octane. By performing a linear sequence of such transformations covering all 105 two-bead compounds, we were able to determine the full set of and analyzed in this work.
In the calculation of the , , we employed the multistate Bennett acceptance ratioShirts and Chodera (2008) (MBAR), a generalization of the BAR method.Bennett (1976) MBAR determines the free energy difference by appropriately combining the results obtained from simulations that sample the statistical ensembles generated by a set of interpolating Hamiltonians , , with and . Specifically, we made use of evenly distributed -points between and for each alchemical transformation and in each environment (interface, water and octane). The production time for each point was in bulk water and bulk octane and at the interface. The cumulative computational cost of performing each alchemical transformation in water, interface and octane amounted roughly to CPU hours.
Given the spatial localization of the interface, the free energy was computed by adding a harmonic potential between the compound and the bilayer midplane at a distance nm.
II.2 Analysis of chemical compound space
The algorithm developed by Bereau and KremerBereau and Kremer (2015) for the automated parameterization of the Martini force field was used to coarse grain approximately 3.5 million small organic compounds, for which 465,387 were mapped to Martini molecules consisting of one and two beads. The list of compounds was obtained from the Generated Database (GDB) of molecules which had up to 10 heavy (excluding Hydrogen) atoms,Fink, Bruggesser, and Reymond (2005); Fink and Reymond (2007) representing most synthetically-feasible small organic molecules between 30 and 160 Da. The algorithm utilizes a mapping energy function that is minimized for each molecule so as to optimize both the number and placement of beads used in its coarse-grained representation. The bead typing occurs by assigning an existing Martini bead type that has the best matched water/octanol partition coefficient with that of the molecular fragment encapsulated by the bead. The partition coefficients of these fragments are obtained by using ALOGPS,Tetko, Tanchuk, and Villa (2001) a neural-network algorithm that predicts these values given the chemical structure of the fragment. The standard mean error associated with this algorithm is 0.36 kcal/mol.Tetko, Tanchuk, and Villa (2001); Tetko and Tanchuk (2002)
III RESULTS
III.1 Linear relationships
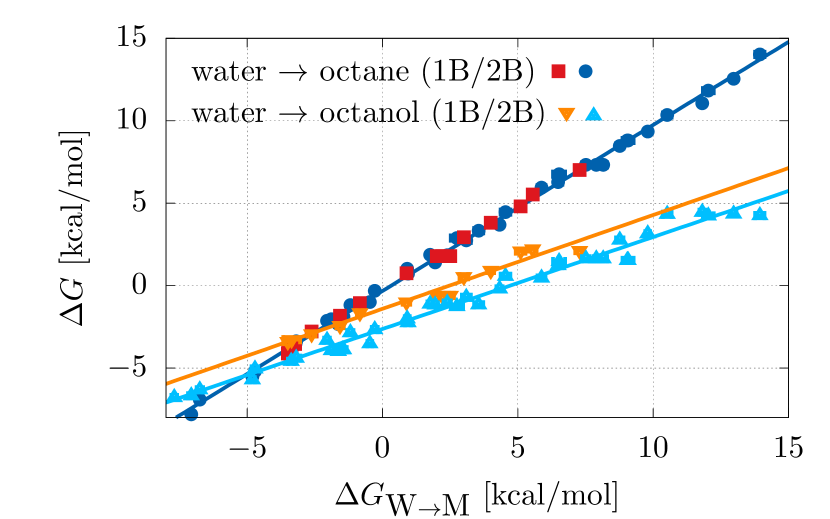
Fig. 2 shows the excellent agreement between the two end-points of a potential of mean force (i.e., ) and the water/octane partitioning, , which illustrates that bulk octane is a good proxy to represent the hydrophobic core of the bilayer, as already discussed in Ref Nikolic et al., 2011. A linear fit for the two quantities provided
| (2) |
, kcal/mol for one-bead and two-bead compounds respectively, with Pearson correlation coefficients . As described in the Methods section, this allowed us to determine transfer free energies with respect to an octane environment, later converting them to the corresponding membrane values.
For every compound, the transfer free energies depicted in Fig. 1c are subject to a thermodynamic cycle that links the three variables
| (3) |
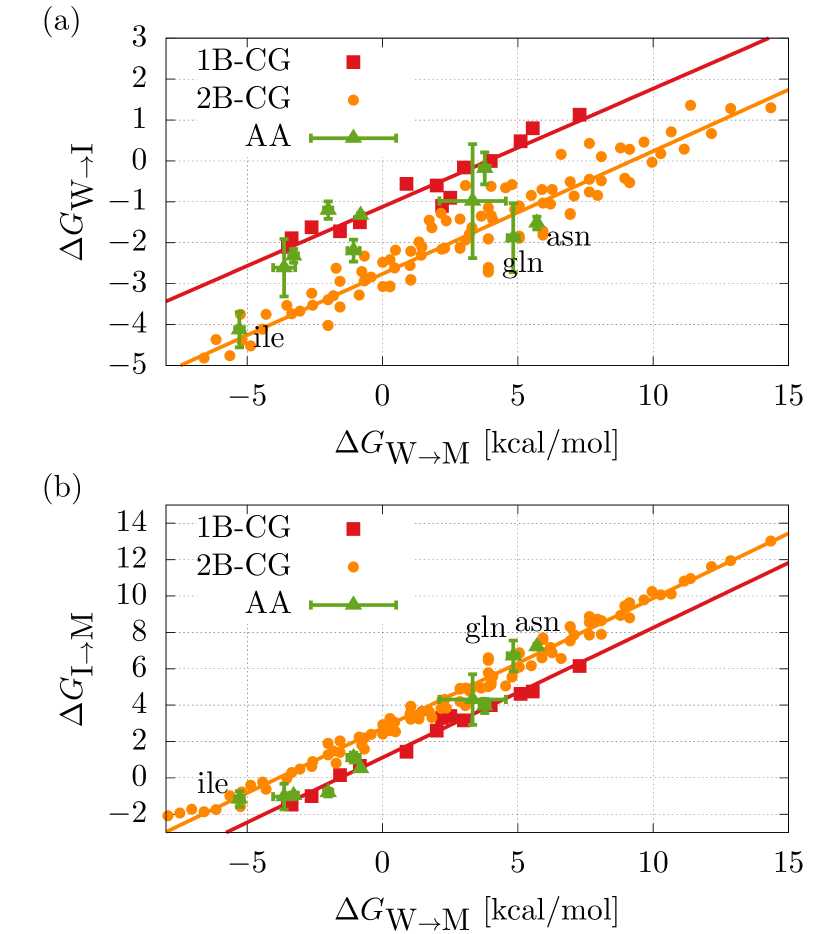
Fig. 3 illustrates the relationship between these three transfer free energies for all 119 coarse-grained molecules considered in this work inserted in a DOPC membrane. In both cases of one- and two-bead compounds, beyond the thermodynamic cycle linking , and , we observe a collapse of the data onto two lines, indicative of a linear relationship between these transfer free energies. Moreover, the only difference between one- and two-bead results consists in the presence of a simple offset (i.e., same slope) between the profiles.
As a result, the thermodynamic cycle shown in Fig. 1c can be reconstructed from the knowledge of a single variable and the Martini bead representation of the compound. The error in doing so amounts to . kcal/mol. These relationships are validated from reference atomistic simulations of amino-acid side chains,MacCallum, Bennett, and Tieleman (2008), where we consider only atomistic compounds whose Martini representation consists of a single bead. While most points fall within the linear fit from the single-bead coarse-grained data, we observe three statistically significant outliers: asparagine (asn), isoleucine (ile), and glutamine (gln). These molecules lie on the data corresponding to two-bead compounds, although their Martini representation consists of a single bead.Monticelli et al. (2008) The origin of such discrepancies will be explained below. The comparison of atomistic and Martini potential of mean force for protein side-chains was already performed in Ref.Monticelli et al., 2008.
Remarkably, the relationships between transfer free energies displayed in Fig. 3 can further be linked to a compound’s water/octanol free-energy , given its accurate linear relation with , see Fig. 2. A fit of the data provided
| (4) |
with and kcal/mol for one- and two-bead compounds, with . Given a compound’s experimentally determined bulk measurement and Martini representation,Bereau and Kremer (2015) we can thereby reconstruct the three main points of the potential of mean force, as shown in Fig. 4a. We rationalize these findings by noting the suitability of the octanol environment as a proxy for the membrane interface. Similarly, we showed the appropriateness of octane for the bilayer midplane (Fig. 2). Indeed, both water/alcohol and water/alkane coefficients correlate with blood-brain partitioning.Toulmin, Wood, and Kenny (2008) Therefore, the relationships in Fig. 3 stem directly from the linear correspondence between water/octane and water/octanol transfer free energies (which can be deduced from the linear relations shown in Fig. 2). From the model’s perspective, the linear relations are not entirely unexpected, as Martini describes hydrophobicity by a set of equally-sized Lennard-Jones particles, with varying well-depths. Interestingly, these relationships also hold at the atomistic level. At infinite dilution, the difference in partitioning of a single small molecule between water and either octane or octanol is due to a single hydrogen bond. We suspect that, at the atomistic level, the impact of this hydrogen bond on the partitioning behavior strongly informs the linearity observed, although the exact mechanism remains unclear. We further remind the reader that the relationships presented here depend strongly on the molecular weight (see the differences between one- and two-bead molecules in Fig. 3). Potentials of mean force of larger compoundsCarpenter et al. (2014) do not follow the relationships presented in Fig. 3. Whether other relationships can be determined for these molecules will be the subject of future work.
The statistical errors displayed by the coarse-grained simulations are marginal: less than kcal/mol. However, a comparison of experimental measurements of the water/octanol partitioning free energies of several hundred small molecules against Martini predictions yielded a mean-absolute error of 0.79 kcal/mol.Bereau and Kremer (2015) Given the relation between the water/octanol and water/midplane curves of Fig. 2 we deduce from it a mean absolute error on features of the potential of mean force of approximately 1.4 kcal/mol. Further, the error associated with the fitted lines on Fig. 3 amounts to an overall error of roughly 1.8 kcal/mol in reconstructing the main points of the potential of mean force—at the bilayer midplane and at the interface, see circles in Fig. 4a—by using as input only the experimental water/octanol partitioning free energy of a compound. At the atomistic level, too few potentials of mean force are available to provide errors across chemical compounds.
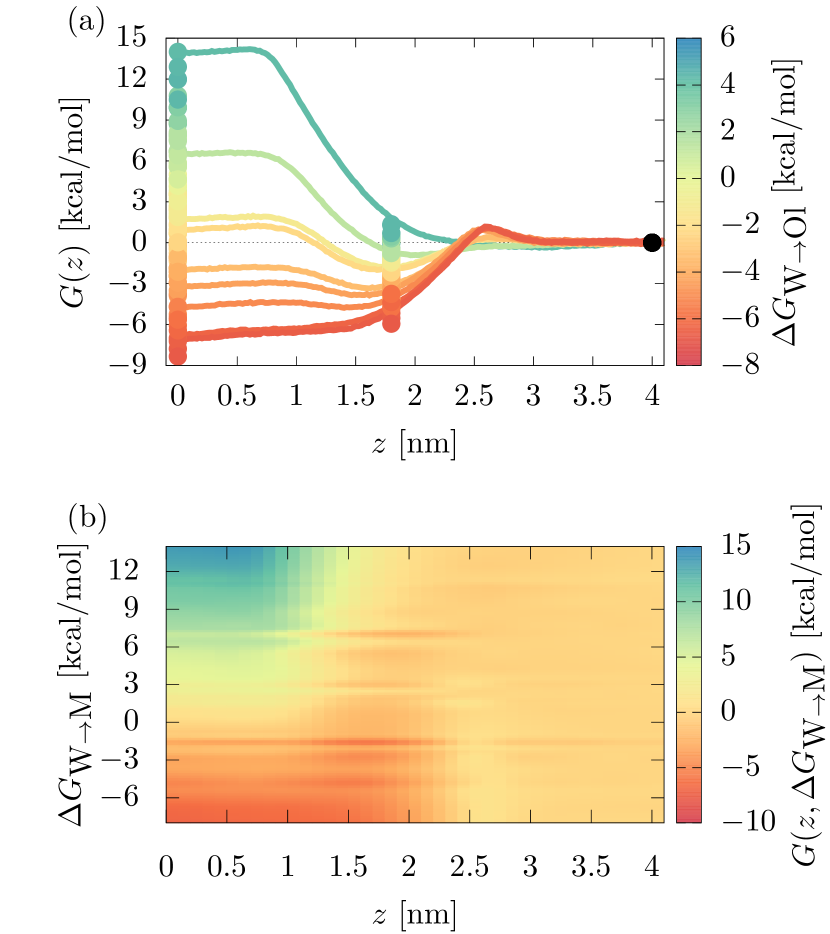
The linearity observed between the free-energy barrier (equivalently ) and the water/membrane partitioning free-energy suggests the possibility of looking for an approximately smooth two dimensional free-energy surface across chemical space, hence as a function of as well as of the distance from the bilayer midplane .
In the case of two-bead coarse-grained molecules, we then constructed a two dimensional map of the free-energy surface starting from the set of potentials of mean force that were determined by means of umbrella sampling simulations, covering a range kcal/mol. Results are shown in Fig. 4b.
The correlations shown in Fig. 3 between and for different compounds correspond, on this surface, to the set of points nm. Apart from minor fluctuations, it is evident how the overall smoothness of the surface on the lines with constant allows us to identify the existence of an average functional relationship between of a compound and its potential of mean force for every value of . As an example, a small free-energy barrier located at nm is present for all the compounds with kcal/mol. Small shifts in z may result from bilayer-thickness discrepancies between atomistic and coarse-grained simulations.Bereau and Kremer (2015)
In this work we focused on the reconstruction of key features of the potential of mean force (i.e., the water/interface and interface/membrane transfer free energies, and ). The results shown in Fig. 4b further suggests that a knowledge of the water/membrane partitioning free energy of a compound, which can be obtained from the corresponding water/octanol one via the linear relation reported in Eq. (4), allows for a semi-quantitative reconstruction of the whole potential of mean force .
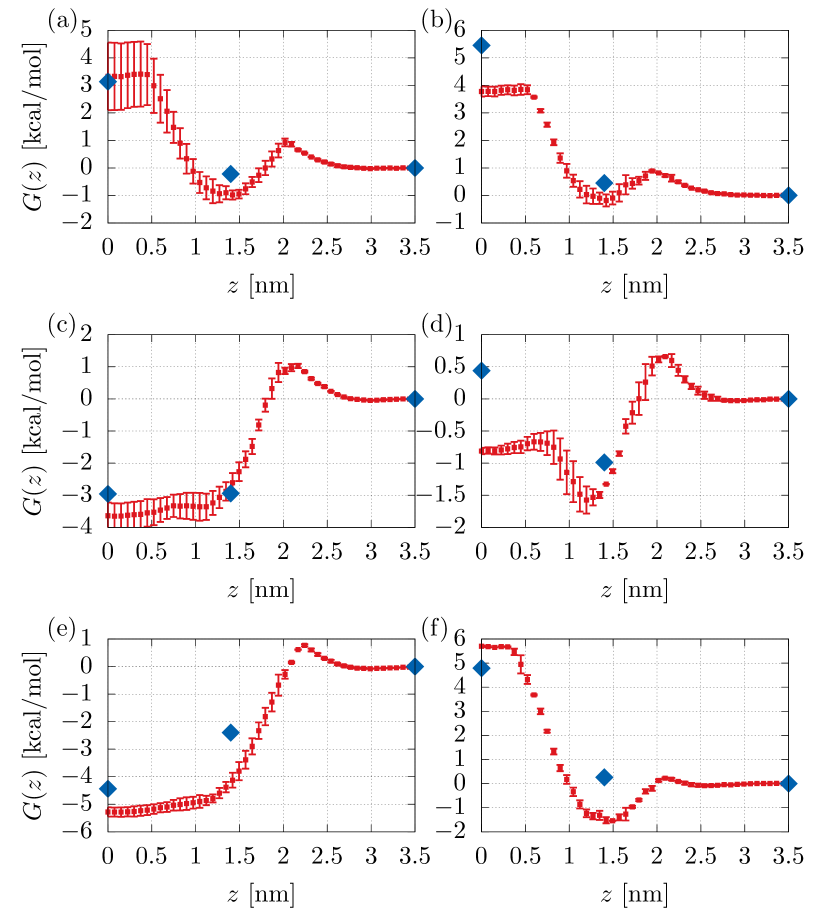
We now quantitatively test our results by comparing the reconstruction of the potential of mean force obtained through the linear relationships presented in Fig. 3 with the atomistic results for amino-acid side chains of Ref. MacCallum, Bennett, and Tieleman, 2008, which map to Martini single-bead molecules. In practice, for each compound we started from the water/octanol partitioning free energy obtained by means of the ALOGPS neural network,Tetko, Tanchuk, and Villa (2001) which was then converted to a water/membrane free-energy by means of Eq. (4). We then used the linear relations of Fig. 3 to determine the water/interface and interface/midplane transfer free energies. Results are shown in Fig. 5. In the first four panels, corresponding to threonine, serine, leucine and cysteine, our predicted free energies are in good agreement with the atomistic results (within our kcal/mol error estimate). Therefore, our method based on coarse-grained simulations is capable of providing a good approximation to key features of the atomistic potential of mean force. On the other hand, by means of an integrated measure on the potential of mean force, atomistic results were shown to accurately reproduce the experimental transfer free energy between water and membrane for different compounds.Jakobtorweihen et al. (2014) The agreement between coarse-grained predictions and atomistic/experimental results has been already described in detail in previous works.Monticelli et al. (2008); Bereau and Kremer (2015) These results further suggest the important role of coarse-grained models as a reasonably predictive tool to capture the fundamental properties of biological soft matter. In panels (e) and (f) of Fig. 5 we show the case of isoleucine (ile) and asparagine (asn), two of the three statistically significant outliers observed in the linear relations presented in Fig. 3. As a consequence, the predicted free energies do not agree with the atomistic results within our error estimate. The origin of these discrepancies is very different in the two cases, and deserves to be discussed separately. The water/membrane free energy of isoleucine lies outside the interval covered by the Martini single-bead compounds, i.e., outside the range of free energies in which linearity is observed, due to the limited number of Martini beads (see Fig. 3). The introduction of more apolar beads in Martini could solve this issue, and work in this direction is in progress. In the case of asparagine and glutamine, which display similar potentials of mean force, the water/interface (and consequently interface/membrane) free-energy is underestimated if one uses the linear relation observed for single-bead compounds (see Fig. 3 and Fig. 5, panel (f)). More interestingly, the datapoints corresponding to these molecules are in agreement with those of two-bead compounds. As both molecules are composed by a combination of a polar and an apolar group, this suggests that their representation in terms of spherical single-bead molecules is incapable of capturing their amphipathic nature, which in turn generates an underestimation of the predicted free-energy barriers. Therefore, the natural coarse-grained representation of both compounds would be that of a two-bead molecule, as Fig. 3 suggests.
III.2 Coarse-graining reduces the size of chemical compound space
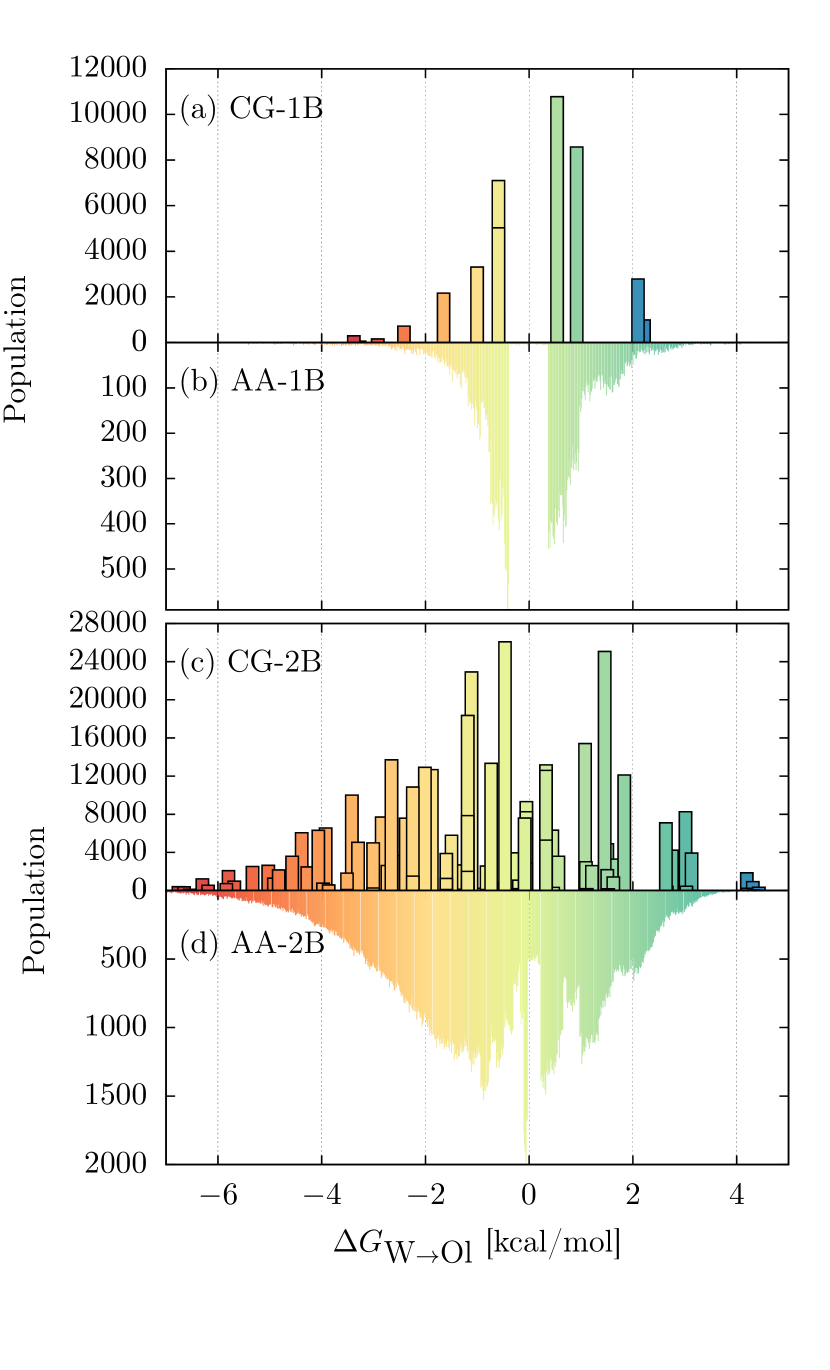
Alternatively to the method presented in Sec. III.1, we identify an independent means to estimate the potential of mean force. We recently showed how the Martini model groups molecules into fewer coarse-grained representations, thereby effectively reducing the size of chemical compound space.Bereau and Kremer (2015) This grouping stems from the discrete set of bead types of the Martini model, which assigns the same representation to groups that are chemically similar. To estimate this grouping, we have coarse-grained compounds from the Generated DatabaseFink and Reymond (2007) of molecules up to ten heavy atoms. In Fig. 6, we show the distributions of compounds that map to any one of the one- and two-bead coarse-grained representations considered here, as a function of the water/octanol partitioning. The atomistic distributions of Fig. 6b,d were obtained using the ALOGPS neural network.Tetko, Tanchuk, and Villa (2001) Despite the uneven spacing of the water/octanol partitioning free energies of the coarse-grained molecules, the atomistic distributions are roughly reproduced by the coarse-grained distributions in Fig. 6a,c, except for small artifacts in the strongly polar regime (i.e., kcal/mol). In total, we identified 465,387 unique molecules, representing most synthetically-feasible small organic molecules between 30 and 160 Da. This many-to-few mapping arises solely from the limited representability of thermodynamic properties of chemical groups, rather than the coarser structural representation (i.e., atoms to beads). The removal of chemically and structurally specific information present in atomistic simulations is traditionally viewed as a necessary drawback for access to otherwise computationally prohibitive simulations. However, it is precisely this drawback that enables a single coarse-grained simulation to be representative of a large number of small molecules, as degenerate chemical groups are mapped to the same bead type. As a counterexample, fixing a Martini-like mapping in combination with a non-transferable, chemically-specific parametrization (e.g., as in most bottom-up, structure-based models) would prevent any reduction in chemical space. This work thereby introduces the ability for transferable coarse-grained models to screen large numbers of small molecules.
III.3 Permeability coefficient
Beyond the structural resolution of a large number of compounds across a membrane interface, the present results provide valuable information for other properties of interest. For instance, the permeability coefficient,Diamond and Katz (1974); Marrink and Berendsen (1994) —a measure for passive permeation that relies on the potential of mean force—has been shown to better correlate with blood-brain barrier permeability compared to water/octanol partitioning (correlation of 0.7 and 0.9, respectively).Carpenter et al. (2014) In the framework of the inhomogeneous solubility-diffusion model,Diamond and Katz (1974); Marrink and Berendsen (1994) the permeability coefficient of a compound is defined asLee et al. (2016)
| (5) |
where is the position-dependent diffusion coefficient. The integration boundaries correspond to the bilayer midplane () and the membrane extension ().
While the computational investment of atomistic simulations prevents the estimation of the potential of mean force for many compounds,Swift and Amaro (2013); Lee et al. (2016) we show that coarse-grained simulations can provide an efficient proxy. Indeed, as a first test of the accuracy of a coarse-grained potential of mean force in reproducing the permeability of a compound, we computed the value of mannitol in a DOPC membrane at , and compared it to reference atomistic results.Carpenter et al. (2014) We assumed a uniform diffusion coefficient , by performing a graphical extrapolation of the average value reported in Ref. Carpenter et al., 2014. We obtained , in very close agreement with the atomistic value of -6.62. Although assuming a constant diffusion coefficient represents an approximation, was shown to be essentially uniform inside the membrane environment and for different compounds.Carpenter et al. (2014)
IV Conclusions
Determing the potential of mean force of the insertion of a small molecule in a lipid bilayer is highly informative but computationally demanding. In this work, we employed high-throughput coarse-grained molecular dynamics simulations in order to perform a screening across small molecules of small molecular weight ( Da). We establish simple relationships relating the water/octanol partitioning coefficient to key features of the potential of mean force. More specifically, this study allows for a semi-quantitative estimation given a widely available experimental measurement—the water/octanol partitioning coefficient, and the coarse-grained representation in terms of Martini beads. Reference all-atom simulations found in the literature confirm these relationships for the range of molecular weights considered. The potential of mean force thereby becomes an easily accessible quantity in drug screening applications, and may be employed in various contexts, such as predicting permeabilities.
Further, any potential of mean force determined at the coarse-grained level is informative of not one, but rather a large number of small molecules. This unexpected property arises due to the coarse-grained model’s limited number of bead types, which amounts to an identical representation of chemically-similar molecules. From a mathematical perspective, the present mapping from atomistic to coarse-grained molecular representations is surjective—“many-to-one.” The size of chemical compound space shrinks with the properties of the coarse-grained model. We thus foresee transferable coarse-grained models to play a role in exploring chemical compound space.
We hope that high-throughput coarse-grained molecular dynamics simulations will further bring about novel insight into the thermodynamic properties of small molecules in complex environments.
ACKNOWLEDGMENTS
We thank Igor Tetko for providing a copy of the ALOGPS software, Tetko, Tanchuk, and Villa (2001) and Joseph F. Rudzinski and Karsten Kreis for critical reading of the manuscript. We acknowledge funding from the Emmy Noether program of the Deutsche Forschungsgemeinschaft (DFG).
References
- Lopes et al. (2016) D. Lopes, S. Jakobtorweihen, C. Nunes, B. Sarmento, and S. Reis, Progress in Lipid Research 65, 24 (2016).
- Shinoda (2016) W. Shinoda, Biochimica et Biophysica Acta - Biomembranes 1858, 2254 (2016).
- Leung, Sindhikara, and Jacobson (2016) S. S. F. Leung, D. Sindhikara, and M. P. Jacobson, J. Chem. Inf. Model. 56, 924 (2016).
- Breemen and Li (2016) R. B. V. Breemen and Y. Li, Expert opinion on drug metabolism & toxicology 1, 175 (2016).
- MacCallum, Bennett, and Tieleman (2008) J. L. MacCallum, W. D. Bennett, and D. P. Tieleman, Biophys. J. 94, 3393 (2008).
- Carpenter et al. (2014) T. S. Carpenter, D. A. Kirshner, E. Y. Lau, S. E. Wong, J. P. Nilmeier, and F. C. Lightstone, Biophys. J. 107, 630 (2014).
- Lee et al. (2016) C. T. Lee, J. Comer, N. L. Conner Herndon, A. Pavlova, R. V. Swift, C. Tung, C. N. Rowley, R. E. Amaro, C. Chipot, Y. Wang, and J. C. Gumbart, J. Chem. Inf. Model. 56, 721 (2016).
- Bennion et al. (2017) B. J. Bennion, N. A. Be, M. W. McNerney, V. Lao, E. M. Carlson, C. A. Valdez, M. A. Malfatti, H. A. Enright, T. H. Nguyen, F. C. Lightstone, and T. S. Carpenter, The Journal of Physical Chemistry B 121, 5228 (2017).
- Jakobtorweihen et al. (2014) S. Jakobtorweihen, A. C. Zuniga, T. Ingram, T. Gerlach, F. Keil, and I. Smirnova, J. Chem. Phys. 141, 07B622_1 (2014).
- Neale et al. (2011) C. Neale, W. D. Bennett, D. P. Tieleman, and R. Pomès, J. Chem. Theory Comput. 7, 4175 (2011).
- Voth (2008) G. A. Voth, Coarse-graining of condensed phase and biomolecular systems (CRC press: Boca Raton, FL, 2008).
- Noid (2013) W. G. Noid, J. Chem. Phys. 139 (2013), 10.1063/1.4818908.
- Periole and Marrink (2013) X. Periole and S.-J. Marrink, Biomolecular Simulations: Methods and Protocols , 533 (2013).
- Marrink and Tieleman (2013) S. J. Marrink and D. P. Tieleman, Chemical Society Reviews 42, 6801 (2013).
- Hess et al. (2008) B. Hess, C. Kutzner, D. Van Der Spoel, and E. Lindahl, J. Chem. Theory Comput. 4, 435−447 (2008).
- Marrink, de Vries, and Mark (2004) S. J. Marrink, A. H. de Vries, and A. E. Mark, J. Phys. Chem. B 108, 750 (2004).
- Marrink et al. (2007) S. J. Marrink, H. J. Risselada, S. Yefimov, D. P. Tieleman, and A. H. de Vries, J. Phys. Chem. B 111, 7812 (2007).
- Monticelli et al. (2008) L. Monticelli, S. K. Kandasamy, X. Periole, R. G. Larson, D. P. Tieleman, and S.-J. Marrink, J. Chem. Theory Comput. 4, 819 (2008).
- De Jong et al. (2013) D. H. De Jong, G. Singh, W. D. Bennett, C. Arnarez, T. A. Wassenaar, L. V. Schafer, X. Periole, D. P. Tieleman, and S. J. Marrink, J. Chem. Theory Comput. 9, 687 (2013).
- De Jong et al. (2016) D. H. De Jong, S. Baoukina, H. I. Ingólfsson, and S. J. Marrink, Comput. Phys. Commun. 199, 1 (2016).
- Parrinello and Rahman (1981) M. Parrinello and A. Rahman, J. Appl. Phys. 52, 7182 (1981).
- Bussi, Donadio, and Parrinello (2007) G. Bussi, D. Donadio, and M. Parrinello, J. Chem. Phys. 126, 014101 (2007).
- Wassenaar et al. (2015) T. A. Wassenaar, H. I. Ingólfsson, R. A. Böckmann, D. P. Tieleman, and S. J. Marrink, J. Chem. Theory Comput. 11, 2144 (2015).
- Torrie and Valleau (1977) G. M. Torrie and J. P. Valleau, J. Comput. Phys. 23, 187 (1977).
- Bereau, Wang, and Deserno (2014) T. Bereau, Z.-J. Wang, and M. Deserno, J. Chem. Phys. 140, 03B615_1 (2014).
- Kumar et al. (1992) S. Kumar, J. M. Rosenberg, D. Bouzida, R. H. Swendsen, and P. A. Kollman, J. Comput. Chem. 13, 1011 (1992).
- Bereau and Swendsen (2009) T. Bereau and R. H. Swendsen, J. Comput. Phys. 228, 6119 (2009).
- Hub, De Groot, and Van Der Spoel (2010) J. S. Hub, B. L. De Groot, and D. Van Der Spoel, J. Chem. Theory Comput. 6, 3713 (2010).
- Mooney, Duval, and Duvall (1993) C. Z. Mooney, R. D. Duval, and R. Duvall, Bootstrapping: A nonparametric approach to statistical inference, 94-95 (Sage, 1993).
- Bereau and Kremer (2015) T. Bereau and K. Kremer, J. Chem. Theory Comput. 11, 2783 (2015).
- Chipot and Pohorille (2007) C. Chipot and A. Pohorille, Free energy calculations (Springer, 2007).
- Nikolic et al. (2011) A. Nikolic, S. Baud, S. Rauscher, and R. Pomès, Proteins: Structure, Function, and Bioinformatics 79, 1 (2011).
- Shirts and Chodera (2008) M. R. Shirts and J. D. Chodera, J. Chem. Phys. 129, 124105 (2008).
- Bennett (1976) C. H. Bennett, J. Comput. Phys. 22, 245 (1976).
- Fink, Bruggesser, and Reymond (2005) T. Fink, H. Bruggesser, and J.-L. Reymond, Angewandte Chemie International Edition 44, 1504 (2005).
- Fink and Reymond (2007) T. Fink and J.-l. Reymond, J. Chem. Inf. Model. 47, 342 (2007).
- Tetko, Tanchuk, and Villa (2001) I. V. Tetko, V. Y. Tanchuk, and a. E. Villa, J. Chem. Inf. Comput. Sci. 41, 1407 (2001).
- Tetko and Tanchuk (2002) I. V. Tetko and V. Y. Tanchuk, J. Chem. Inf. Comput. Sci. 42, 1136 (2002).
- Toulmin, Wood, and Kenny (2008) A. Toulmin, J. M. Wood, and P. W. Kenny, J. Med. Chem. 51, 3720 (2008).
- Diamond and Katz (1974) J. M. Diamond and Y. Katz, J. Membrane Biol. 17, 121 (1974).
- Marrink and Berendsen (1994) S.-J. Marrink and H. J. Berendsen, J. Phys. Chem. 98, 4155 (1994).
- Swift and Amaro (2013) R. V. Swift and R. E. Amaro, Chemical biology & drug design 81, 61 (2013).