Eigenvector Centrality Distribution for Characterization of Protein Allosteric Pathways
Abstract
Determining the principal energy pathways for allosteric communication in biomolecules, that occur as a result of thermal motion, remains challenging due to the intrinsic complexity of the systems involved. Graph theory provides an approach for making sense of such complexity, where allosteric proteins can be represented as networks of amino acids. In this work, we establish the eigenvector centrality metric in terms of the mutual information, as a mean of elucidating the allosteric mechanism that regulates the enzymatic activity of proteins. Moreover, we propose a strategy to characterize the range of the physical interactions that underlie the allosteric process. In particular, the well known enzyme, imidazol glycerol phosphate synthase (IGPS), is utilized to test the proposed methodology. The eigenvector centrality measurement successfully describes the allosteric pathways of IGPS, and allows to pinpoint key amino acids in terms of their relevance in the momentum transfer process. The resulting insight can be utilized for refining the control of IGPS activity, widening the scope for its engineering. Furthermore, we propose a new centrality metric quantifying the relevance of the surroundings of each residue. In addition, the proposed technique is validated against experimental solution NMR measurements yielding fully consistent results. Overall, the methodologies proposed in the present work constitute a powerful and cost effective strategy to gain insight on the allosteric mechanism of proteins.
Allostery is a ubiquitous process of physico-chemical regulation in biological macromolecules such as enzymes. The fundamental step in the allosteric regulation is the binding of a ligand at a particular enzymatic site affecting the activity at a different and often very distant position of the protein. While allosteric processes have long been of interest, especially due to their relevance in developing potent and selective therapeutics, the mechanism for energy transfer between allosteric sites remains poorly understood. Thus, establishing a molecular level understanding of communication pathways between the physically distant enzymatic sites is crucial for the design of innovative drug therapiesCsermely et al. (2013); Wagner et al. (2016) and protein engineeringGoodey and Benkovic (2008); Reetz et al. (2009); Ozbil et al. (2012).
Recently, there have been significant efforts toward the development of computational tools to support, interpret and/or predict experimental evidences for elucidation of allosteric pathways in proteins Hawkins and McLeish (2004); Ming and Wall (2005); Palumbo et al. (2006); Rivalta et al. (2012a); Vanwart et al. (2012); Wagner et al. (2016); Ribeiro and Ortiz (2016); Blacklock and Verkhivker (2014). Network analysis has been extensively used in this context, by incorporating concepts and methodologies from graph theory into the realm of molecular dynamics simulations Sun et al. (2014); Zhu et al. (2016); Appadurai and Senapati (2016); Xu et al. (2015); VanWart et al. (2012); Palermo et al. ; Guo and Zhou (2016) For instance, community network analysis (CNA) has emerged as a powerful and increasingly popular approach to analyze the dynamics of enzymes and protein/DNA (and/or RNA) complexes and to detect possible allosteric pathways Li et al. (2014); Sethi et al. (2009); Ricci et al. (2016); Papaleo et al. (2012); David-Eden and Mandel-Gufreund (2008); Jiang et al. (2010); Szilagyi et al. (2013).
In these network theory-based approaches, a protein is represented as a network consisting of a set of nodes, connected by edges, . Usually, each amino acid is associated to a node (typically positioned on the alpha carbon or the center of mass of the residue side chain). Depending on the physical property of interest, there are multiple quantities that can characterize the edges (i.e. the connections between nodes), such as the magnitude of the dynamical correlations Rivalta et al. (2012a); Lange and Grubmülller (2006); Lange and Grubmüller (2008), the energetic coupling Savoie et al. (2014), or the spatial distance between residues Doshi et al. (2016). Given a network of N nodes, its graph can be represented with an N N adjacency matrix whose elements are related with the strength of the physical interaction under consideration.
One of the corner stones of network analysis is the concept of centrality, i.e., the relative importance of a node or clusters of nodes. Measures of centrality are crucial to identify the most influential nodes in a network. The importance is usually quantified by a real-valued function, related to a type of flow or transfer across the network (e.g., the amount of momenta transported by a given atom in a protein). There are many measures of centrality characterizing slightly different aspects of the network. Probably the simplest of all is the degree, , of each node, , which is defined by the number and strength of the connections attached to it,
| (1) |
The degree centrality (DC), provides a measure of the relative connectivity of each node within a network. A node that is well connected is expected to have a large “influence” on the graph. While the DC can provide useful information, it is not a true “node-centrality” as defined by Ruhnau,Ruhnau (2000) and thus does not give a measure of centrality based on a fixed scale that allows comparisons between different graphs.
An alternative definition is the betweenness centrality (BC), , which provides a measure of how information can flow between nodes (or edges) in a network. The BC can be quantified as the number of times a node acts as a bridge along the geodesic (shortest) path between two other nodes,
| (2) |
where is number of shortest paths between nodes and that pass though node , and is the total number of shortest paths between nodes and . The nodes with high BC have a large influence on the overall information passing, and hence, the removal of such nodes may disrupt the communication in the network. However, communication do not always take the shortest path, and hence, the BC may provide a misleading interpretation of the real relevance of each amino acid in the functional dynamics of a protein.
Somehow in between these two definitions of centrality (i.e. degree and betweenness centralities), the eigenvector centrality (EC) emerges as an alternative that takes into account both the number of connections of a given node and its relevance in terms of information flow. The EC of a node, , is defined as the sum of the centralities of all nodes that are connected to it by an edge, ,
| (3) |
therefore, is the eigenvector associated to the eigenvalue of . The EC is, hence, a measure of how well connected a node is to other well connected nodes in the network. Noteworthy, the EC serves as a measure of the connectivity against a fixed scale when normalized, and so it can be used to reliably compare different networks.Ruhnau (2000) For example, the normalization becomes essential when analyzing differences between graphs, e.g., to study the pattern of centrality variation between the apo and holo states of a protein.
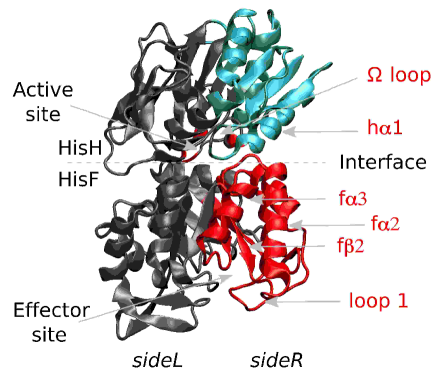
In the present work, we illustrate the potential of the EC measure to provide a molecular level characterization of the allosteric mechanism of enzymes. In particular, we focus on the prototypical case of the Imidazole Glycerol Phosphate Synthase (IGPS), a bacterial enzyme present in the amino acid and purine biosynthetic pathways of most microorganisms, making it an attractive target for antibiotic, pesticide, and herbicide development.Chaudhuri et al. (2001) Structurally, IGPS is a tightly associated heterodimer (see Fig. 1) in which each monomer catalyzes a different reaction: The HisH enzyme promotes the hydrolysis of glutamine (Gln) to produce ammonia, which diffuses to the HisF unit and reacts with the effector PRFAR to form imidazole glycercol phosphate (IGP). While Gln binding is unaffected by the presence of PRFAR, the hydrolysis of Gln is accelerated 5000-fold upon PRFAR binding through a mechanism that, for many years, has remained elusive Myers et al. (2003). IGPS is thus a V-type enzyme and a model system to study non-cooperative allostery involving conformational changes.
In a recent study Rivalta et al. (2012a), we have carried out a BC-based community network analysis by optimizing the modularity function, to explore the underlying allosteric mechanism of this enzyme. We now present an alternative strategy, exploring the description of allostery provided by the EC as compared to the CNA based on optimal modularity (the connection between CNA and the EC is analyzed in detail in the SI). The results presented here are both complementary and fully consistent with our previous findings. Additionally, at variance with our previous CNA approach, the strategy proposed in this work allows to capture the long range contribution to the correlation pattern evidencing fundamental aspects of the allosteric behavior of IGPS. Therefore, the methodology presented here represents an ideal technique for the identification of mutation targets to inhibit or enhance the IGPS catalytic activity, opening the doors to a plethora of combined theoretical-experimental studies oriented to increase the control of its function and develop new alternatives for drug discovery.
The present paper is organized as follows: We first summarize the method of CNA and results for reference Rivalta et al. (2012a). Next the method of EC is introduced and applied to the IGPS systems. Results are discussed and compared with CNA. Correlation matrices are obtained from the same trajectories and following the same protocol as in reference Rivalta et al. (2012a) and Rivalta et al. (2012b).
I Community Network Analysis
Consider a protein residue network where each node represents the -carbon of an amino acid in the protein, and each edge represents the dynamical correlation between the two residues (nodes) it connects. The latter can be quantified using the generalized correlation coefficients, based on the mutual information (MI) between two residues Lange and Grubmülller (2006):
| (4) |
where the fluctuation or atomic displacements vectors are computed from a molecular dynamics (MD) simulations. For clarity, we have kept the original notation used in references Lange and Grubmülller (2006); Rivalta et al. (2012a, b), where a detailed explanation on the calculation of the generalized correlation coefficients can be found.
The mutual information between the two residues is computed as:
| (5) |
where
| (6) |
| (7) |
are the marginal and joint Shannon entropies respectively, obtained as ensemble averages over the atomic displacements , with marginal and joint probability distributions and computed over thermal fluctuations sampled by molecular dynamics simulations of the system at equilibrium. The coefficient ranges from zero for uncorrelated variables, to 1 for fully correlated variables.
The protein graph connectivity is then built excluding direct connections of first nieghbors (in amino acid sequence) and according to two cutoffs: two nodes are considered connected if the distance between their -carbons is within a distance cutoff (generally 4-6 Å) for a certain percentage of the MD trajectories (percentage cutoff, usually 65-85 %). The distances between all the connected nodes () in the graph topology define a matrix of elements obtained from , according to:
| (8) |
setting the distance to infinity (in practice to extremely large values) when two nodes are not connected, as defined by the connectivity rules. The Floyd-Warshall algorithm Floyd (1962) is then used to determine the matrix of minumum distance (maximum correlation), considering direct distances as well as up to N possible intermediate residues mediating indirect communication pathways (where N is the total number of residues in the system). The total number of residues for the IGPS case is N.
The edge-betweenness matrix with elements is defined as the number of shortest paths that include edge () as one of its communication segments. In other words, the edge-betweenness matrix is an estimation of the information “traffic” passing through the edge connecting residues and in the network. The edge-betweenness matrix is then used for partitioning the network into communities according to the Girvan-Newman algorithm which is based on maximizing the modularity measure Girvan and Newman (2002); Newman (2006). Details of the computation of the communities structure based in the maximum modularity from the generalized correlation matrix can be found in references Rivalta et al. (2012a, b).
Figure 1 shows the two most important communities h2 (cyan) and f3 (red) projected into the residue space of the IGPS in the apo state as determined in Rivalta et al. (2012a). Secondary structural element of h2 involves h, h, h, h, h, h, h and -loop. Secondary structural element of f3 instead involves f, f, f, h, h, f, f, f, h and Loop1.
We have previously showed that the correlation between communities h2 and f3 is enhanced (with larger inter-betweenness) after PRFAR binding. Furthermore, it was shown that the explanation for this enhancement relies on the increase in the frequency of an interdomain motion at the dimeric interface (HisH-HisF) upon the binding of PRFAR. This was described as a low-frequency inter-domain breathing motion that allows for fluctuations between two states (open and closed IGPS heterodimer) that are accessible at thermal equilibrium in both the apo and PRFAR complexes. Disruption of this breathing mode with drug-like compounds was recently suggested as a method for inhibiting the allosteric mechanism Rivalta et al. (2016).
The recognition of the local interactions that determine variations in the breathing motion (and, thus, in the h2-f3 inter-communities correlations) has been performed by detailed comparative analysis of chemical interactions along the MD trajectories of apo and PRFAR-bound IGPS complexes Rivalta et al. (2012a). In particular, it was observed that PRFAR binding affects specific hydrofobic interactions in Loop1 and f2 (in HisF), altering salt-bridge formations at the surface exposed f2, f and h helices (at the HisF/HisH interface) that, in turn, determine modification of the breathing motion and of the hydrogen bonding network between the Omega-loop and the oxyanion strand nearby the HisH active site. Thus, among the secondary structure elements of communities h2 and f3, the following elements have been retained as allosteric pathways: Loop1, f, f, f, h and -loop (indicated with red labels in Figure 1). The active allosteric role of some of these residues has been recently proved by single-site mutation experiments Lisi et al. (2017).
The CNA provides an introspection tool for visualizing the most important transformation induced by the allosteric effector in a coarse-grained fashion, allowing easy detection of effector-driven changes in the overall inter-communities information flows. However, we have showed that to recover direct information on allosteric pathways, a detailed analysis of the MD trajectory is still necessary Rivalta et al. (2012a). Therefore, CNA can successfully assist the tedious allosteric pathways detection by indicating major network changes due to the effector binding but it cannot provide an easy detection and immediate visualization of the sequence of amino acids involved in the allosteric-to-active site signal propagation. Here we show that a comparative EC approach on the other hand, can provide fast detection of allosteric nodes and easy interpretation of the signal pathways “activated” by the effector binding.
II Eigenvector Centrality Analysis
Lets define the adjacency matrix as follows:
| (9) |
Just as in the CNA approach, here each node of the graph corresponds to the -carbon of an amino acid residue and the off-diagonal elements of are the weights associated to every edge. Additionally, an exponential damping factor with a length parameter has been introduced to expression 9. This parameter can be adjusted to control the locality of the correlations under consideration based on the average distance between residues (). This means that if is short enough, the correlation between residues that are far away from one another will be disregarded and the effect of the locality in the allosteric pathway will be revealed. On the other hand, if is set to a very large value, all correlations, including those between residues separated by long distances, will be accounted for (i.e. , ). By adopting such damping factor, we obtain a two-fold benefit for the EC analysis: i) by setting reasonably small damping values we could mimic the distance cutoff employed in the CNA and we can then fairly compare EC and CNA results; ii) comparison of EC values at various damping distances provides direct information on the role of long-range correlations in allosteric pathways. This will be discussed in further detail in the last section.
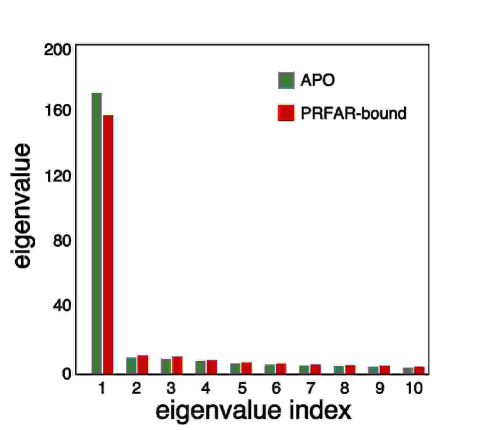
As mentioned in the introduction, the eigenvector centrality (EC) measurement arises from an eigendecomposition of the adjacency matrix, , where c is the vector containing the centralities for each node and is the associated eigenvalue. Therefore, there is a set of solutions to this eigenvalue problem, being the number of -carbon atoms in the protein. However, we will rely here on the assumption that the functional dynamics of the protein can be assigned to the major collective mode of correlation. Consequently, the eigenvectors associated to the remaining eigenvalues will be neglected. The election of this leading eigenvector as the principal component of the correlation pattern can be formally justified considering that the adjacency matrix defined by equation 9, has the following mathematical properties: (i) ; and (ii) . Hence, uniqueness of the definition of the eigenvector centrality is ensured by the Perron-Frobenius theorem which states that any symmetric matrix (property i) with non-negative entries (property ii) has a unique largest real eigenvalue (see SI). To illustrate the practical consequence of this theorem in the case of and PRFAR bound IGPS, Figure 2 shows that there is almost two orders of magnitude separating the highest eigenvalues from the remaining ones.
Based on this definition, the EC values can be computed by diagonalizing matrix and keeping the eigenvector c that corresponds to the maximum eigenvalue . The power method Watkins (2010) is an alternative to matrix diagonalization which is computationally more efficient and would be more appropriated for large systems. The information encoded on the resulting eigenvector c reveals the importance of the nodes for the whole connectivity of the network. The nodes with the highest centralities will act as the principal “channels” for momentum transmission across the protein. This strategy has been applied as a means of visualizing dynamical phenomena in other domains of science Jimenez-Martinez and Negre (2017).
As the set of eigenvectors of is orthonormal, the sum of all the squared centralities is one (). The latter plus the fact that the centralities are positive suggests that the squared centralities could be interpreted as the probability for a signal to pass through node Jimenez-Martinez and Negre (2017). The eigenvalue , in turn, gives a measure of the network degree of connectivity. At (no exponential damping), the values of are 166.8 and 154.0 for apo and PRFAR-bound respectively. This indicates that the system experiences an overall decrease of correlation as a consequence of PRFAR binding as previously suggested by inspecting the correlation matrix Rivalta et al. (2012a). Moreover, our solution NMR spectroscopic measures characterizing the conformational exchange () for numerous amino acids in HisF domain, indicate that nearly every residue increases its flexibility upon PRFAR binding Lisi et al. (2016). This increase in flexibility is translated into an effective reduction of the intermolecular connectivities, and hence, results fully consistent with the predicted drop in the overall correlation.
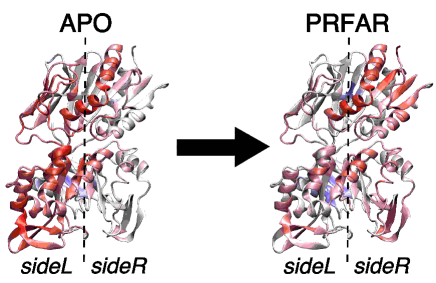
The EC values for each node can be easily visualized in the protein structure (Figure 3), displaying the coefficients for each amino acid with a color scale from white (zero centrality) to red (maximum centrality). In all the cases, a renormalization of the centrality values was applied for plotting purposes (See SI). Figure 3 shows the values of for both apo and PRFAR-bound IGPS proteins, as computed by setting the damping distance to infinity. Noteworthy, the subgraph composed by the most important nodes in the network changes dramatically with the effector binding, highlighting the connection between the EC distribution and the momentum transport pathway. As indicated in Figure 3, the highest EC values shift collectively from sideL to sideR of the IGPS PRFAR binding. This variation of the relative EC distribution evidences a change in the correlation pattern that is in agreement with our previous analysis and consistent with the enhancement in the betweenness of h2-f3 pair of communities Rivalta et al. (2012a).
The methodology introduced above somehow resembles the well known essential dynamics (ED) scheme in which the global trajectory of a system analyzed in terms of its major collective modes of fluctuation.Amadei et al. (1993); Hayward and de Groot (2008); Meyer et al. (2006); Morzan et al. (2013) These modes – usually called essential modes – are obtained by diagonalizing the covariance matrix defined as
| (10) |
Normally, despite not being formally guaranteed, it is observed that the protein dynamics is dominated by a few essential modes. Therefore, this scheme also provides a way to obtain eigenvector coefficients that reveal the relevance of each node in the overall behavior of the network. Nevertheless, the measure of relevance can have several meanings, in particular the upper panel of Figure 4 shows that the nature of the eigenvector coefficients obtained from the first essential mode (the one associated to the highest eigenvalue) is qualitatively different from that of the EC coefficients. There are two main reasons that justify this difference: (i) while in the latter case the generalized mutual information matrix is only a measure of the dynamical correlation between pairs of nodes, in the former case the covariance matrix is both a measure of correlation and the amount of fluctuation. (ii) On the other hand, the covariance measure fails to account for non-colinear correlations. The first observation is consistent with the fact that the behavior of the essential mode coefficients (orange line, upper panel) is quite similar to the root mean square fluctuation per residue (blue curve, upper panel). Therefore, this analysis illustrates that the ED and the EC extracted from the mutual information are two complementary methodologies that provide a different insight on the systems dynamics. In particular the technique presented in this work constitutes a powerful alternative to analyze allosterism because it isolates the principal component in terms of the correlation and not in terms of flexibility as in the case of essential dynamics.
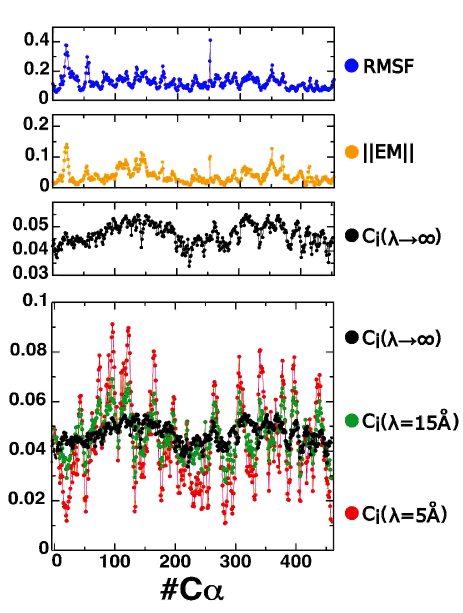
The lower panel of Figure 4 shows the effect of the length parameter defined in expression 9. In the limit of the off-diagonal elements of the adjacency matrix become equivalent to the generalized correlation function for each pair of nodes. The centrality coefficients obtained in this way exhibit a smooth variation. In contrast, when is short enough, only the local components of the correlations survive and the centrality coefficients reveal the relevance of each residue in terms of its dynamical correlation with neighboring aminoacids. In this context, the exponential damping appears as a strategy to elucidate the correlation paths triggered by short range molecular interactions, thus providing a physically relevant description of the momentum transfer within the protein residue network.
III Centrality variation triggered by effector binding
In order to highlight the changes in the EC distribution caused by the binding of the effector PRFAR (see Figure 3), we have examined the EC differences associated to PRFAR binding () for each residue . Figure 5 shows that there is significant redistribution of the EC values upon PRFAR binding. Two protein regions feature increased centralities, namely residues around 5-100 (in HisF) and around 254-330 (1-46 in HisH), involving the f, f, loop1 and h fragments. Connections between the loop1 and -loop are hence established after PRFAR is bound to IGPS as suggested in Ref. Rivalta et al. (2012a) and as clearly depicted in the centrality differences analysis presented in Figure 5.
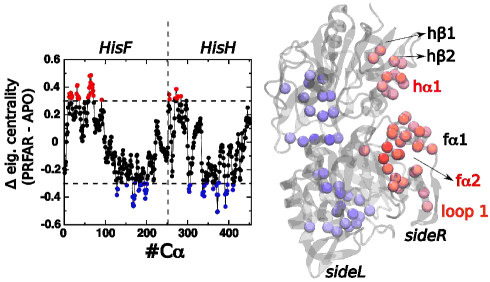
Previous studies have suggested the existence of two dynamically differentiated sides in IGPS, i.e. left and right or sideL and sideR respectively Rivalta et al. (2012a, 2016) (Figure 5). Detailed inspection of MD trajectories have suggested that the allosteric signal propagates through sideR. Noteworthy, in agreement with that observation, Figure 5 shows that the binding of the effector PRFAR causes an increase in the centrality values of sideR amino acids. Moreover, the pattern shown by the centrality distribution allows to clearly identify the two sides of IGPS, confirming our previous hypothesis.
Importantly, the residues identified by this analysis are perfect targets for mutations that may have a major impact on IGPS catalytic behavior. In particular, helix h appears as a specially promising and unexplored fragment for site directed mutagenesis experiments oriented to refine the control of IGPS activity.
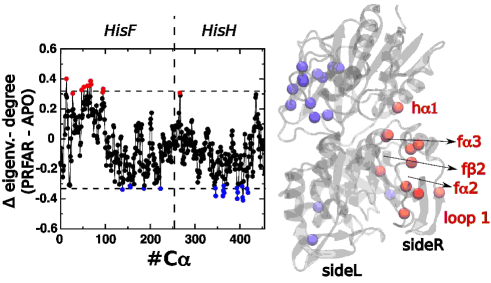
In addition, instead of focusing on the nodes that are important per se, another criteria that can be relevant to guide mutagenesis efforts is to focus on the “neighborhood” of those nodes. This sort of modification may play a more subtle role on altering the proteins activity, which can be potentially relevant for applications like drug discovery in which the desired effect comes from disrupting the environment of key residues in the protein. A strategy to obtain this neighborhood centrality measure is to subtract the degree centrality (DC) coefficients from the original EC values:
| (11) |
Figure 6 illustrates the measurement of the coefficients associated to the transition between the APO and PRFAR bound states (i.e. ). This analysis highlights residues fN14, fV48, fR59, fT61, fL65, fQ67, fV69, fR95, fG96 and hN14 as the ones neighboring the aminoacids with a large increase of centrality upon PRFAR binding. With the exception of residues fT61, fL65 and fV69, all the aminoacids pointed out by this measurement coincide with the ones that have the larger PRFAR induced EC variation. Remarkably, single-point mutation on residue fV48 and fN98 (which is in the vicinity fG96) have shown to have a dramatic effect on the PRFAR-induced activation of IGPS catalytic activity Lisi et al. (2017). On the other hand, the relevance of fV48 as part of the hydrophobic cluster in f2 and fE67 and fR95 as part of the surface salt-bridge network at f2/f3 has been indicated by detailed MD trajectories inspections while here it is rapidly detected by the comparative EC analysis.
IV The locality factor
In order to further analyze the impact of the locality factor in the overall centrality distribution, Figure 7 shows the calculated EC coefficients at different values of . Importantly, adjusting the damping parameter down to Å does not seem to have a significant effect on the overall trend of the EC differences between apo and PRFAR-bound IGPS. The same allosteric pathway for IGPS is revealed whether or not we include the correlations between residues separated by long distances. Moreover, the sideL/sideR structure is maintained at all ’s. This implies that short range correlations dominate the protein dynamics, and hence the residue-to-residue effect is the main mechanism that underlies the momentum transmission in IGPS. Another important point to note is the fact that the disruptions of the centrality values disappear upon the application of the locality factor recovering the smoothness of a residue-to-residue short range transmitted signal.
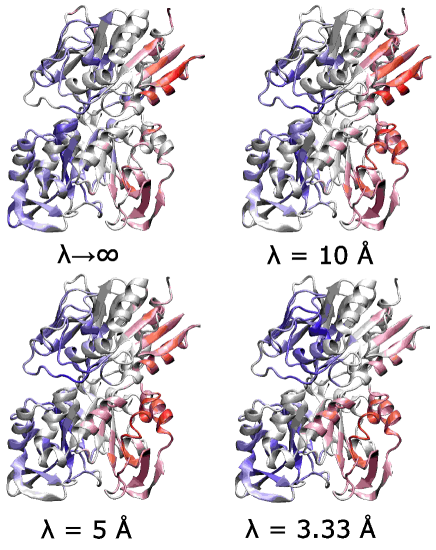
The average Cα-Cα distance is around 3.8 Å, therefore when the value of Å, the correlation matrix becomes almost diagonal (see SI), and the key EC trend is most likely masked by numerical errors.
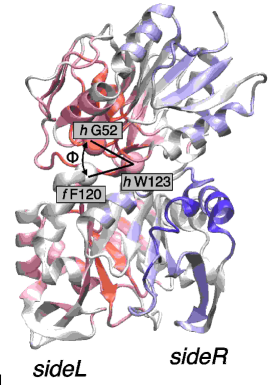
As discussed above, by introducing the locality factor it is possible to select from the overall motion of the system the correlations arising exclusively from physical interactions whose range are below certain distance threshold. On the other hand, despite having shown that the resulting short range component is the one that dominates the overall correlation pattern, it is possible to analyze the nature of the long range contribution. Figure 8 introduces a measurement of the long range component of the PRFAR induced EC coefficients computed as:
| (12) |
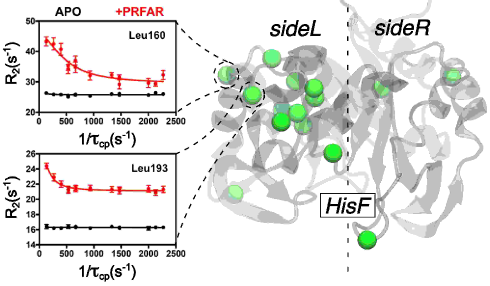
for Å (panels A, B and C respectively) (CHRIS: Panels are missing?). Remarkably, the long range distribution also preserves qualitatively the sideL/sideR structure, but in this case the trends are inverted with respect to the short range picture, and the largest increase in the long range centrality coefficients upon PRFAR binding is mainly located on sideL. This is consistent with the presence of an interdomain “breathing” motion, as previously reported Rivalta et al. (2016, 2012a) (Figure 8.A, dashed black lines forming an angle ). The large structural (long range) rearrangement associated to this motion increases its frequency upon PRFAR binding almost four times Rivalta et al. (2016). Consequently, the highest gain of long range correlation that occurs mainly in sideL can be assigned to this low frequency motion. In agreement with this, our solution NMR relaxation dispersion experiments show that the PRFAR-induced millisecond motions are primarily located on sideL (Figure 9), which supports the existence of a large motion with maximum amplitude on sideL as determined by the long range centrality analysis. Furthermore, sideL of subunit HisF appears more static with weaker effectors than PRFAR Lisi et al. (2016), suggesting that this breathing motion might be determining the allosteric activation of IGPS in some extent. But more generally, the NMR study presented in Figure 9 provides an experimental proof for the presence of the sideL/sideR structure predicted by the EC analysis, in which the two sides of IGPS display clear differences in terms of their dynamical features.
Interestingly, the overall difference between sideR and sideL values is considerably reduced when going from 5 to 10 Å and for Å the distribution becomes almost uniform. This indicates that the characteristic correlation distances involved in the breathing mode are within the range of 5 to 20 Å(see SI).
V Conclusions
In the present work we have introduced a strategy based on the eigenvector centrality (EC) and mutual information metrics as a way of elucidating the allosteric pathways at an atomistic level and disentangle the local and non-local components of the characteristic distances that determine the allosteric mechanism. Furthermore, we have introduced a new perspective to measure centrality in terms of the environment relevance, allowing to interpret recent site directed mutagenesis experiments (Lisi et al., 2017).
As opposed to other principal component analysis of widespread use in the literature, the EC scheme presented in this work provides a way to obtain the major collective correlation mode, independent from the magnitude of the fluctuations. As a consequence, this methodology constitutes a powerful strategy to quantify the relevance of each amino acid in the overall pathways of momentum transfer. In addition, the correlation measure is based on the generalized mutual information, which correctly captures the non-collinear correlation, overcoming the well known limitation of the Pearson correlation coefficients.
We have used the IGPS protein as a test case to show that our approach successfully predicts the most important residues involved in the allosteric mechanism upon effector binding. The identified amino acids are localized around sideR of the HisH-HisF interface connecting the effector and the active sites. These residues belong to the same allosteric pathways detected in our previous community network analysis Rivalta et al. (2012a) further corroborated by recent experimental evidences Lisi et al. (2017). The outcome indicates how the comparative EC analysis here developed can predict allosteric pathways and estimate the role of long-range correlations in allostery through a robust and cost effective protocol.
VI acknowledgement
We acknowledge support by the Office of Basic Energy Sciences of the U.S. Department of Energy (DE-FG02-07ER15909) for supercomputer time from NERSC, XSEDE and the Yale University Faculty of Arts and Sciences High Performance Computing Center partially funded by the National Science Foundation grant CNS 08-21132.
References
- Csermely et al. (2013) P. Csermely, T. Korcsmáros, H. J. M. Kiss, G. London, and R. Nussinov, Pharmacology and Therapeutics 138, 333 (2013), arXiv:1210.0330 .
- Wagner et al. (2016) J. R. Wagner, C. T. Lee, J. D. Durrant, R. D. Malmstrom, V. A. Feher, and R. E. Amaro, Chemical Reviews 116, 6370 (2016).
- Goodey and Benkovic (2008) N. M. Goodey and S. J. Benkovic, Nat. Chem. Biol. 4, 478 (2008).
- Reetz et al. (2009) M. T. Reetz, P. Soni, J. P. Acevedo, and J. Sanchis, Angew. Chem 121, 8418 (2009).
- Ozbil et al. (2012) M. Ozbil, A. Barman, R. P. Bora, and R. Prabhakar, J. Phys. Chem. Lett. 3, 3460 (2012).
- Hawkins and McLeish (2004) R. J. Hawkins and T. C. B. McLeish, Phys. Rev. Lett. 93, 098104 (2004).
- Ming and Wall (2005) D. Ming and M. E. Wall, Phys. Rev. Lett. 95, 198103 (2005).
- Palumbo et al. (2006) M. Palumbo, L. Farina, A. Colosimo, K. Tun, and P. K. Dhar, Curr. Bioinf. 1, 219 (2006).
- Rivalta et al. (2012a) I. Rivalta, M. M. Sultan, N.-S. Lee, G. A. Manley, J. P. Loria, and V. S. Batista, Proc. Natl. Acad. Sci. USA 109, E1428 (2012a), http://www.pnas.org/content/109/22/E1428.full.pdf+html .
- Vanwart et al. (2012) A. T. Vanwart, J. Eargle, Z. Luthey-Schulten, and R. E. Amaro, Journal of Chemical Theory and Computation 8, 2949 (2012), arXiv:NIHMS150003 .
- Ribeiro and Ortiz (2016) A. A. S. T. Ribeiro and V. Ortiz, Chemical Reviews 116, 6488 (2016).
- Blacklock and Verkhivker (2014) K. Blacklock and G. M. Verkhivker, PLOS Computational Biology 10, 1 (2014).
- Sun et al. (2014) X. Sun, H. Ågren, and Y. Tu, The Journal of Physical Chemistry B 118, 14737 (2014), pMID: 25453446, http://dx.doi.org/10.1021/jp506579a .
- Zhu et al. (2016) Y. Zhu, B. Ma, R. Qi, R. Nussinov, and Q. Zhang, The Journal of Physical Chemistry B 120, 3551 (2016), pMID: 27007011, http://dx.doi.org/10.1021/acs.jpcb.5b12299 .
- Appadurai and Senapati (2016) R. Appadurai and S. Senapati, Biochemistry 55, 1529 (2016), pMID: 26892689, http://dx.doi.org/10.1021/acs.biochem.5b00946 .
- Xu et al. (2015) L. Xu, W. Ye, C. Jiang, J. Yang, J. Zhang, Y. Feng, R. Luo, and H.-F. Chen, The Journal of Physical Chemistry B 119, 2844 (2015), pMID: 25633018, http://dx.doi.org/10.1021/jp510940w .
- VanWart et al. (2012) A. T. VanWart, J. Eargle, Z. Luthey-Schulten, and R. E. Amaro, Journal of Chemical Theory and Computation 8, 2949 (2012), pMID: 23139645, http://dx.doi.org/10.1021/ct300377a .
- Palermo et al. (0) G. Palermo, C. G. Ricci, A. Fernando, R. Basak, M. Jinek, I. Rivalta, V. S. Batista, and J. A. McCammon, Journal of the American Chemical Society 0, null (0), pMID: 28764328, http://dx.doi.org/10.1021/jacs.7b05313 .
- Guo and Zhou (2016) J. Guo and H.-X. Zhou, Chemical Reviews 116, 6503 (2016), pMID: 26876046, http://dx.doi.org/10.1021/acs.chemrev.5b00590 .
- Li et al. (2014) S. Li, J. Zhang, S. Lu, W. Huang, L. Geng, Q. Shen, and J. Zhang, PLOS ONE 9, 1 (2014).
- Sethi et al. (2009) A. Sethi, J. Eargle, A. A. Black, and Z. Luthey-Schulten, Proceedings of the National Academy of Sciences 106, 6620 (2009).
- Ricci et al. (2016) C. G. Ricci, R. L. Silveira, I. Rivalta, V. S. Batista, and M. S. Skaf, Scientific Reports 6, 19940 (2016).
- Papaleo et al. (2012) E. Papaleo, K. Lindorff-Larsen, and L. De Gioia, Phys. Chem. Chem. Phys. 14, 12515 (2012).
- David-Eden and Mandel-Gufreund (2008) H. David-Eden and Y. Mandel-Gufreund, Nucleic Acid Res. 36, 4641 (2008).
- Jiang et al. (2010) X. Jiang, C. Chen, and Y. Xiao, J. Comput. Chem. 31, 2502 (2010).
- Szilagyi et al. (2013) A. Szilagyi, R. Nussinov, and P. Csermely, Curr. Topics in Med. Chem. 13, 64 (2013).
- Lange and Grubmülller (2006) O. Lange and H. Grubmülller, Proteins: Structure, Function, and Bioinformatics 62, 1053 (2006).
- Lange and Grubmüller (2008) O. F. Lange and H. Grubmüller, Proteins: Structure, Function, and Bioinformatics 70, 1294 (2008).
- Savoie et al. (2014) B. M. Savoie, K. L. Kohlstedt, N. E. Jackson, L. X. Chen, M. Olvera de la Cruz, G. C. Schatz, T. J. Marks, and M. A. Ratner, Proceedings of the National Academy of Sciences 111, 10055 (2014), http://www.pnas.org/content/111/28/10055.full.pdf .
- Doshi et al. (2016) U. Doshi, M. J. Holliday, E. Z. Eisenmesser, and D. Hamelberg, Proceedings of the National Academy of Sciences 113, 4735 (2016), http://www.pnas.org/content/113/17/4735.full.pdf .
- Ruhnau (2000) B. Ruhnau, Social Networks 22, 357 (2000).
- Chaudhuri et al. (2001) B. N. Chaudhuri, S. C. Lange, R. S. Myers, S. V. Chittur, V. Davisson, and J. L. Smith, Structure 9, 987 (2001).
- Myers et al. (2003) R. S. Myers, J. R. Jensen, I. L. Deras, J. L. Smith, and V. J. Davisson, Biochem. 42, 7013 (2003).
- Rivalta et al. (2012b) I. Rivalta, M. M. Sultan, N.-S. Lee, G. A. Manley, J. P. Loria, and V. S. Batista, Proc. Natl. Acad. Sci. USA 109, E1428 (2012b), supporting information doccument, http://www.pnas.org/content/109/22/E1428.full.pdf+html .
- Floyd (1962) R. W. Floyd, Commun. Acm. 5, 345 (1962).
- Girvan and Newman (2002) M. Girvan and M. E. J. Newman, Proc. Natl. Acad. Sci. USA 99, 7821 (2002), http://www.pnas.org/content/99/12/7821.full.pdf+html .
- Newman (2006) M. E. J. Newman, Proceedings of the National Academy of Sciences of the United States of America 103, 8577 (2006), arXiv:0602124 [physics] .
- Rivalta et al. (2016) I. Rivalta, G. P. Lisi, N.-S. Snoeberger, G. Manley, J. P. Loria, and V. S. Batista, Biochem. 55, 6484 (2016), pMID: 27797506, http://dx.doi.org/10.1021/acs.biochem.6b00859 .
- Lisi et al. (2017) G. P. Lisi, K. W. East, V. S. Batista, and J. P. Loria, Proceedings of the National Academy of Sciences 114, E3414 (2017), http://www.pnas.org/content/114/17/E3414.full.pdf .
- Watkins (2010) D. S. Watkins, Fundamentals of matrix computations, third edition (John Wiley & Sons, 2010).
- Jimenez-Martinez and Negre (2017) J. Jimenez-Martinez and C. F. A. Negre, Phys. Rev. E 96, 013310 (2017).
- Lisi et al. (2016) G. Lisi, G. Manley, H. Hendrickson, I. Rivalta, V. S. Batista, and J. Loria, Structure 24, 1155 (2016).
- Amadei et al. (1993) A. Amadei, A. B. M. Linssen, and H. J. C. Berendsen, Proteins: Structure, Function, and Bioinformatics 17, 412 (1993).
- Hayward and de Groot (2008) S. Hayward and B. L. de Groot, “Normal modes and essential dynamics,” in Molecular Modeling of Proteins, edited by A. Kukol (Humana Press, Totowa, NJ, 2008) pp. 89–106.
- Meyer et al. (2006) T. Meyer, C. Ferrer-Costa, A. Pérez, M. Rueda, A. Bidon-Chanal, F. J. Luque, C. A. Laughton, and M. Orozco, Journal of Chemical Theory and Computation 2, 251 (2006).
- Morzan et al. (2013) U. N. Morzan, L. Capece, M. A. Marti, and D. A. Estrin, Proteins: Structure, Function, and Bioinformatics 81, 863 (2013).