Evolution of vorticity and enstrophy in the intracluster medium
Abstract
Turbulence generated by large-scale motions during structure formation affects the evolution of the thermal and non-thermal components of the intracluster medium.
As enstrophy is a measure of the magnitude of vorticity, we study the generation and evolution of turbulence by analysing the Lagrangian history of enstrophy. For this purpose we combine cosmological simulations carried out with the ENZO-code with our Lagrangian post-processing tool CRaTer. This way we are able to quantify the individual source terms of enstrophy in the course of the accretion of groups onto galaxy clusters. Here we focus on the redshift range from to . Finally, we measure the rate of dissipation of turbulence and estimate the resulting amplification of intracluster magnetic fields.
We find that compressive and baroclinic motions are the main sources of enstrophy, while stretching motions and dissipation affect most of the ensuing enstrophy evolution. The rate of turbulent dissipation is able to sustain the amplification of intracluster magnetic fields to observed levels.
keywords:
galaxy cluster, turbulence, enstrophy, magnetic fields1 Introduction
The intracluster medium (ICM) is a hot ( K), dilute plasma that hosts turbulent motions across all scales. Turbulence is driven on cluster scales, few , as gravitational energy is converted into kinetic energy during the process of hierarchical structure formation (see Brüggen & Vazza, 2015, and references therein for a recent review). Accretion flows convert their kinetic energy into turbulent motions through tangential flows, fluid instabilities or baroclinic motions. The turbulence then cascades from driving scales to dissipative scales and heats the plasma, (re-)accelerates cosmic-ray particles and amplifies magnetic field (e.g. Brunetti & Lazarian, 2007; Miniati & Beresnyak, 2015; Schmidt et al., 2015). Turbulence can also be driven on galactic scales, , for example by outflows driven by active galactic nuclei (AGN) or ICM-based magneto-thermal instabilities (e.g. Mendygral et al., 2012; ZuHone et al., 2013).
In this work, we are tracking the turbulence associated with substructures that are accreted by clusters at . These are typically groups with typical masses of , and they are expected to contribute up to to the total mass of massive galaxy clusters (e.g. Berrier et al., 2009).
Current observations measure turbulence through the SZ-effect or pressure fluctuations and line spectroscopy in X-ray (e.g. Khatri & Gaspari, 2016; Pinto et al., 2015; Zhuravleva et al., 2016). Future X-ray observations should be able to detect the driving scale of turbulence directly due to the outstanding spectral resolution of the new generation of telescopes (e.g. Athena).
The analysis of the turbulent motions is rendered difficult by the need to isolate uncorrelated flows from, both correlated flows on large scales () and small-scale velocity perturbations produced by shocks. Turbulence is also dependent on the local gas conditions, as the compressive turbulent energy can make up only a few percent or up to per cent of the total turbulent kinetic energy. This is important for example, for the understanding of cosmic-ray acceleration. The compressive turbulent component, e.g. curl-free component, most likely follows a Burgers-like spectrum, which reduces the power for cosmic-ray acceleration111In the case the magnetosonic waves, that are responsible for the acceleration of particles, are dissipated at shocks steepening the cascade and reducing the effective energy transfer to the particles (Miniati, 2015). (Brunetti & Jones, 2014; Miniati, 2015).
Porter et al. (2015) simulated the properties of MHD turbulence driven by various combinations of solenoidal and compressive processes. Their objective was to understand the physical sources of ICM enstrophy (see Sec. 1.1) and the associated turbulent amplification of magnetic fields. Vazza et al. (2017) extended this work by analysing a major merger cluster, finding that enstrophy is generated by baroclinic and shock-related motions during accretion and merger processes. In the cluster interior, vortex stretching seeded by mergers is enhancing and generating enstrophy.
In this work, we use our post-processing tool CRaTer to analyse the Lagrangian evolution of enstrophy in eight different clusters taken from the Itasca Simulated Clusters (ISC). The paper is structured as follows: After summarizing the most important points of enstrophy generation and evolution in Sec. 1.1, we will give detailed information on our simulations and numerical tools in Sec. 2. In Sec. 3.1, we give an overview of the general properties of our cluster sample. Our results on the Lagrangian evolution of enstrophy are presented in 3.2. We focus on the evolution of growth and decay times associated with the different source terms that generate enstrophy in Sec. 3.3. In Sec. 3.4, we give estimates on the turbulent energy dissipation and the corresponding magnetic field amplification. Finally, we summarise our results and conclude in Sec. 4. In the Appendix, we further give an analytical derivation of how the dissipation rate of turbulence can be estimated in our simulation.
1.1 Evolution of enstrophy
The kinetic energy of turbulence in the ICM is mostly ( per cent Miniati & Beresnyak, 2015) of solenoidal nature (divergence-free) and its amount can be measured by the vorticity . However, the average vector vorticity tends to zero and other proxies for solenoidal turbulence are needed. The enstrophy is such a proxy as it measures the magnitude of vorticity. The equation for the evolution of enstrophy is derived by taking the dot-product of the vorticity and the vorticity equation (for more details see Porter et al., 2015). The evolution of enstrophy in a fixed, Eulerian frame is determined by advective, compressive, stretching and baroclinic motions222Notice, Porter et al. (2015) include a magnetic term in their equation. This term is neglected here as our simulations only use pure hydrodynamics. as well as dissipation:
| (1) |
The individual sink and source terms (from here on we will refer to them as source terms) are:
| (2) | ||||
| (3) | ||||
| (4) | ||||
| (5) | ||||
| (6) | ||||
| (7) |
In the equations above, and are the gas density and pressure, is the kinematic viscosity and , with the traceless strain tensor 333 (Mee & Brandenburg, 2006). A hat denotes a unit vector. We notice that all derivatives are computed using a second-order central difference.
Each source term represents a different physical process leading to the generation, amplification and destruction of enstrophy. The advective, , source term describes conservative advection of enstrophy across the cluster. The compressive, , source term accounts for both reversible compression and rarefractions as well as enstrophy enhancements due to shock compression. The net influence of shock compression on enstrophy is amplification, although as discussed in Porter et al. (2015) creation of enstrophy within shocks really comes from the strain term in Eq. 6, combined with subsequent compression within the shock. The stretching source term, , accounts for the generation of enstrophy by vortex stretching. Baroclinic, , generation of enstrophy takes place in baroclinic flows, in which the pressure is not a function of density alone; that is, the flow is not barotropic. In our case, where the gas equation of state is adiabatic, that corresponds to flow with non-uniform entropy, which develops behind complex or unsteady shock structures during cluster formation. The dissipation, , term accounts for viscous dissipation of solenoidal flow. The dominant component of the dissipation term corresponds to the damping of turbulent eddies, although the second component can also act as a source term in shocks. For the moment, we ignore since we have no explicit viscosity, , in our simulations. In Sec. 3.4 and in Appendix B we will estimate the effective viscosity by looking at the dissipation of solenoidal turbulent energy. Clearly, the baroclinic and the dissipation term (through its strain tensor contribution) are the only source terms that are able to generate vorticity. The other source terms depend on the enstrophy itself and therefore they cannot generate enstrophy from zero.
Eq. 1 describes the Eulerian evolution of enstrophy. For the tracer analysis we need to transform this into a Lagrangian frame, moving with the ICM fluid, as the change of enstrophy recorded by the tracers between two consecutive timesteps corresponds to the Lagrangian time derivative of the enstrophy. It is computed from Eq. 1 by adding and neglecting , giving
| (8) |
Enstrophy has the dimensions of inverse time squared, so is intuitively best understood in terms of characteristic “turnover rate, or, alternatively, eddy turn over time” for the turbulence. Similarly, the measurements of each source term in Eq. 2-6 are most simply understood in terms of the turnover time.
As a measurement for the impact of each source term we compute the local, effective and individual source growth/decay times as
| (9) | ||||
| (10) |
In the equations above the index refers to the individual source terms.
2 Simulation setup
2.1 ENZO
In this work we study eight galaxy clusters taken from the ISC sample444http://cosmosimfrazza.myfreesites.net/isc-project.
The sample has been simulated with the ENZO code (Bryan et al., 2014) using the the piecewise parabolic method hydro solver (Colella & Woodward, 1984).
We applied the WMAP7 CDM cosmology (Komatsu et al., 2011) in our simulations: , , , , , and a primordial index of .
Each cluster was extracted from an initial cosmological volume, sampled with cells and dark matter particles, of the size (co-moving). The central volume around each cluster has been refined further for a final resolution of . The adaptive mesh refinement (AMR) method used in our simulations is the same as described in Sec. 2 of Vazza et al. (2017).
All simulations started at a redshift of and about data dumps from each simulation, between redshifts and , were saved for further analysis. Our simulations are non-radiative and do not include any magnetic fields nor non-gravitational heating, except an imposed temperature floor of to mimic re-ionization at moderate redshifts, e.g. .
2.2 CRaTer
We use our Lagrangian tracer code Cosmic-Ray Tracer (CRaTer) (which has already been applied in various works: Wittor et al., 2017; Vazza et al., 2016a, b; Wittor et al., 2016) to follow the clumpy accretion of gas in post-processing. We use a Cloud-in-Cell-method to interpolate the velocity, gas density, temperature, enstrophy and various source terms computed on the ENZO-grid to the tracer’s position. The tracers are advected linearly in time.
Following the mass distribution of the ENZO-simulations, the tracers were injected within a volume of cells on the finest grid of the ENZO-simulation at . Using the same mass threshold we injected additional tracers according to the distribution of the mass entering the simulation box during run time. At each cluster is consequently populated by tracers with a mass resolution of . We choose this mass resolution as it is high enough to resolve structures accurately while the corresponding number of tracers can be still handled computationally.
3 Results on IT90_3
3.1 Cluster properties
At a redshift of our eight galaxy clusters cover a mass range of (total mass) and a temperature range of , which corresponds to a sound speed range of . The dynamical and numerical properties of our clusters are summarized in Tab. 1, and a closer look at the dynamical histories and X-ray properties of each individual cluster is given in the appendix A. The classification of each system based on the presence of a major merger has been estimated based on the analysis of the mass accretion history of each system.
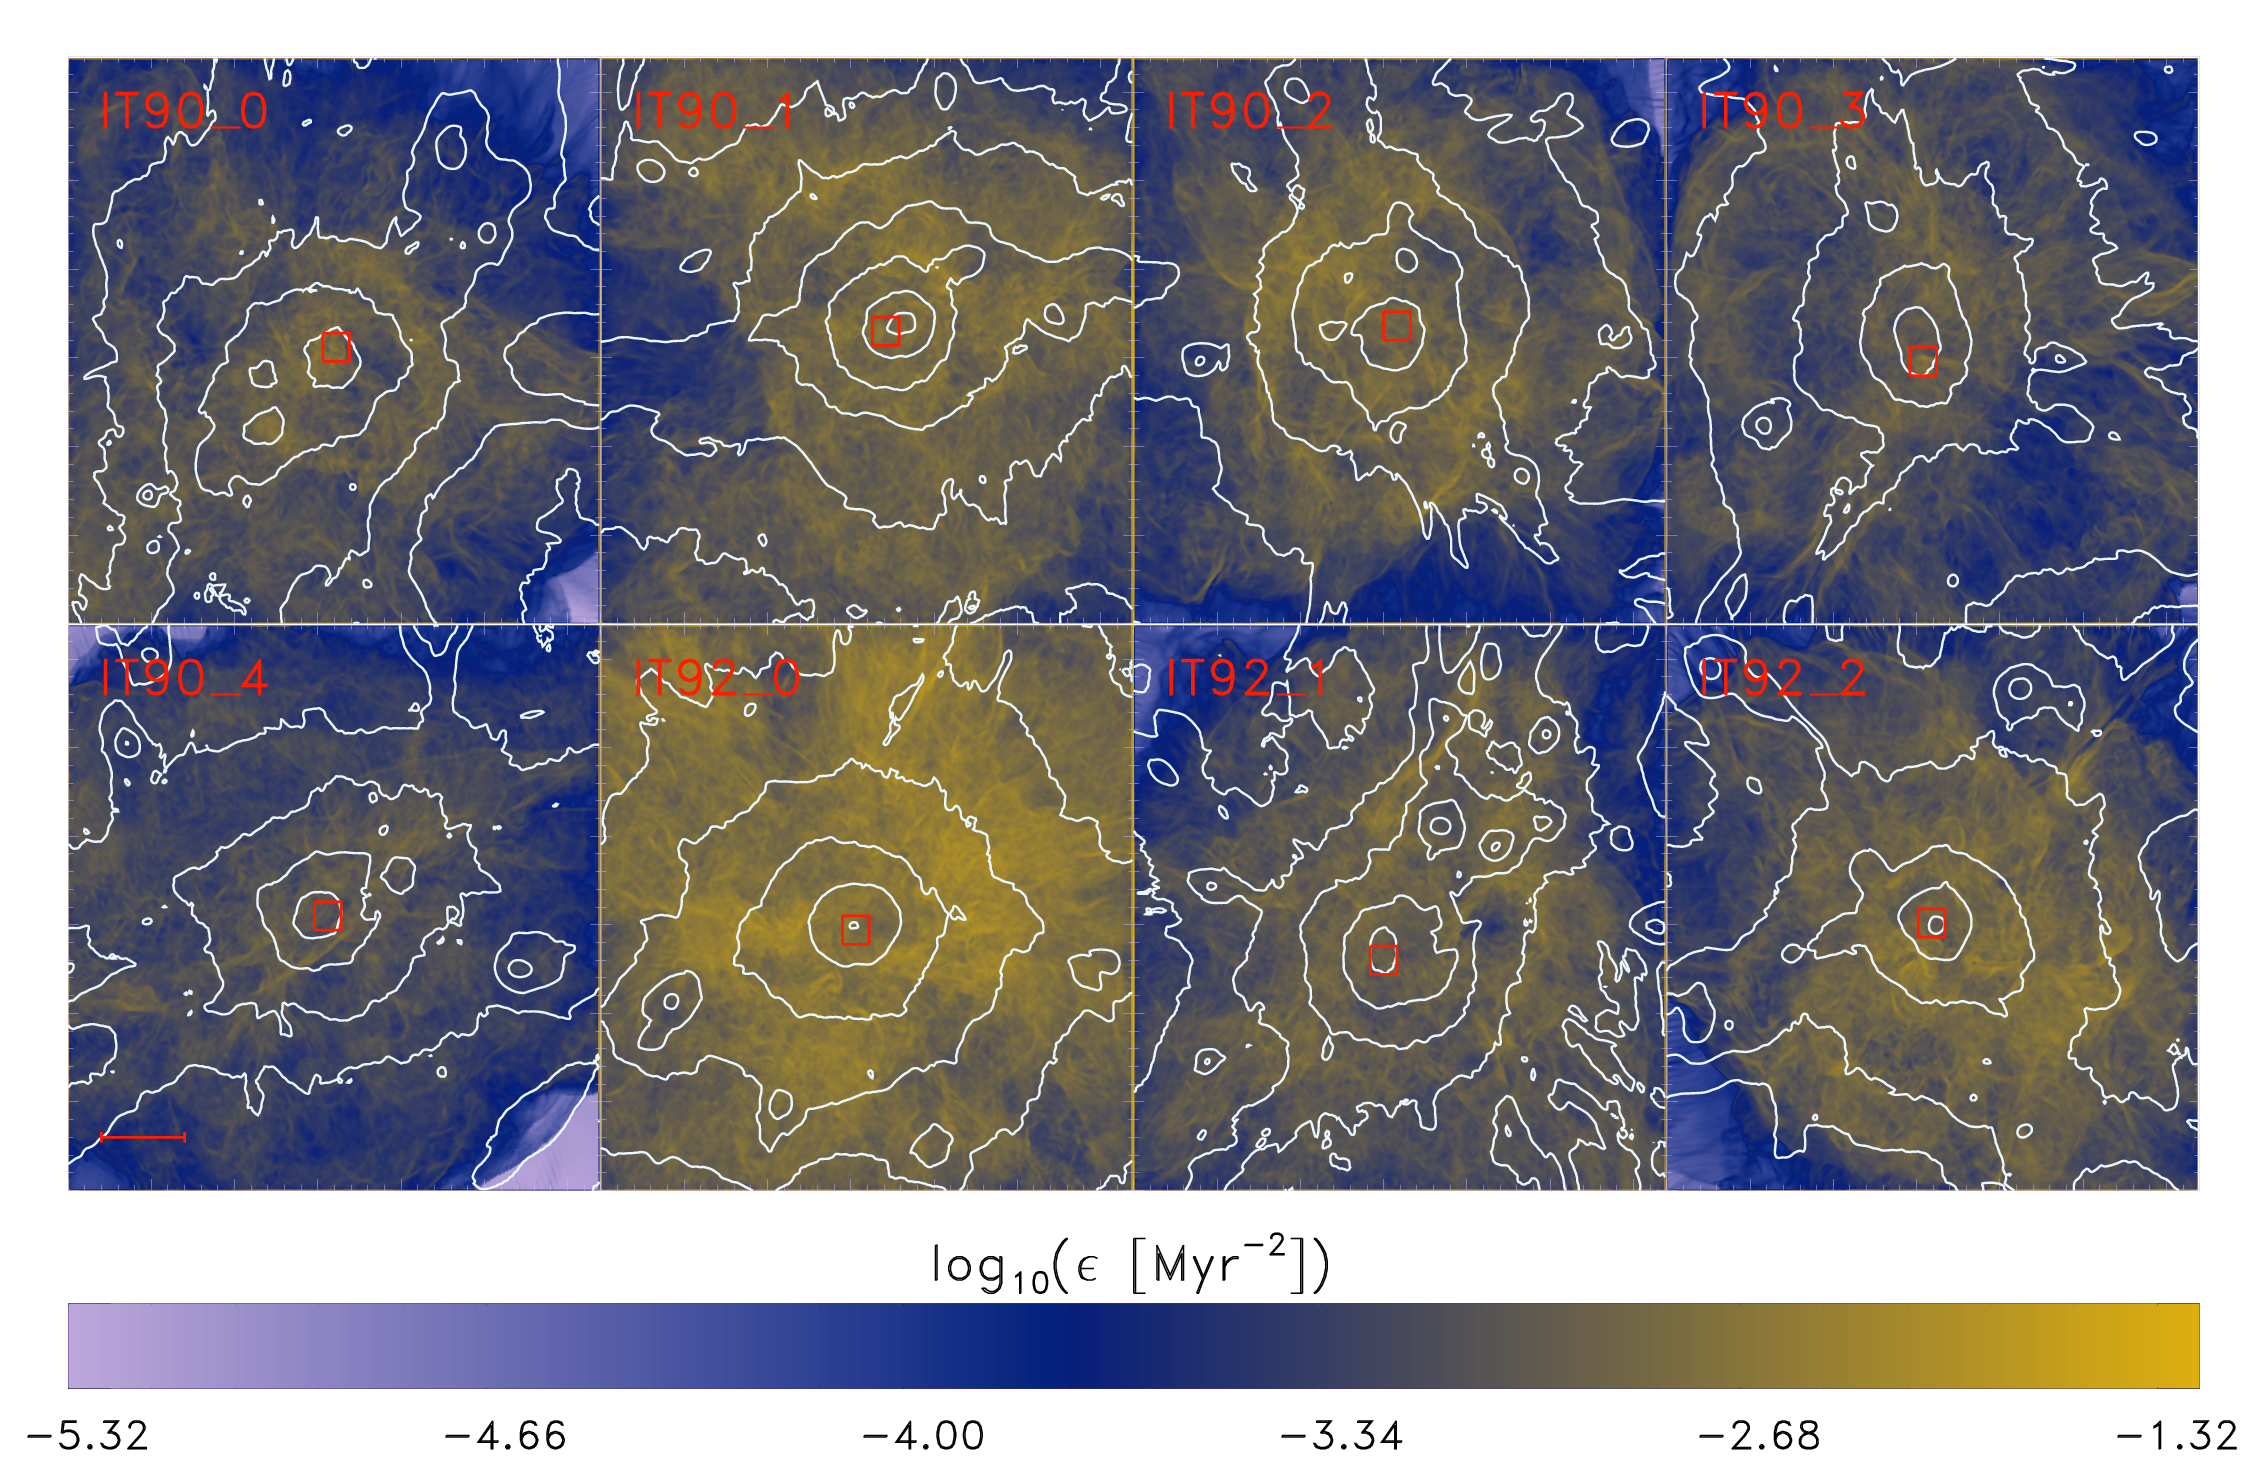
The projected enstrophy overlayed with density contours at a redshift of is shown for all eight clusters in Fig. 1. The red squares mark the volume centred around the peak of enstrophy, which has been chosen in three dimensions and is therefore not clearly visible in the projected maps. For our tracers analysis we will focus on the tracers that are located in this region at a redshift of .
Following the methods described in Sec. 2.2, we advected tracer particles in post-processing for each cluster between redshifts and . Most of our discussion will revolve around the merging cluster IT90_3, which has been already studied in great detail in Vazza et al. (2017). We will point out differences and similarities with the other ISC clusters where it is most instructive.
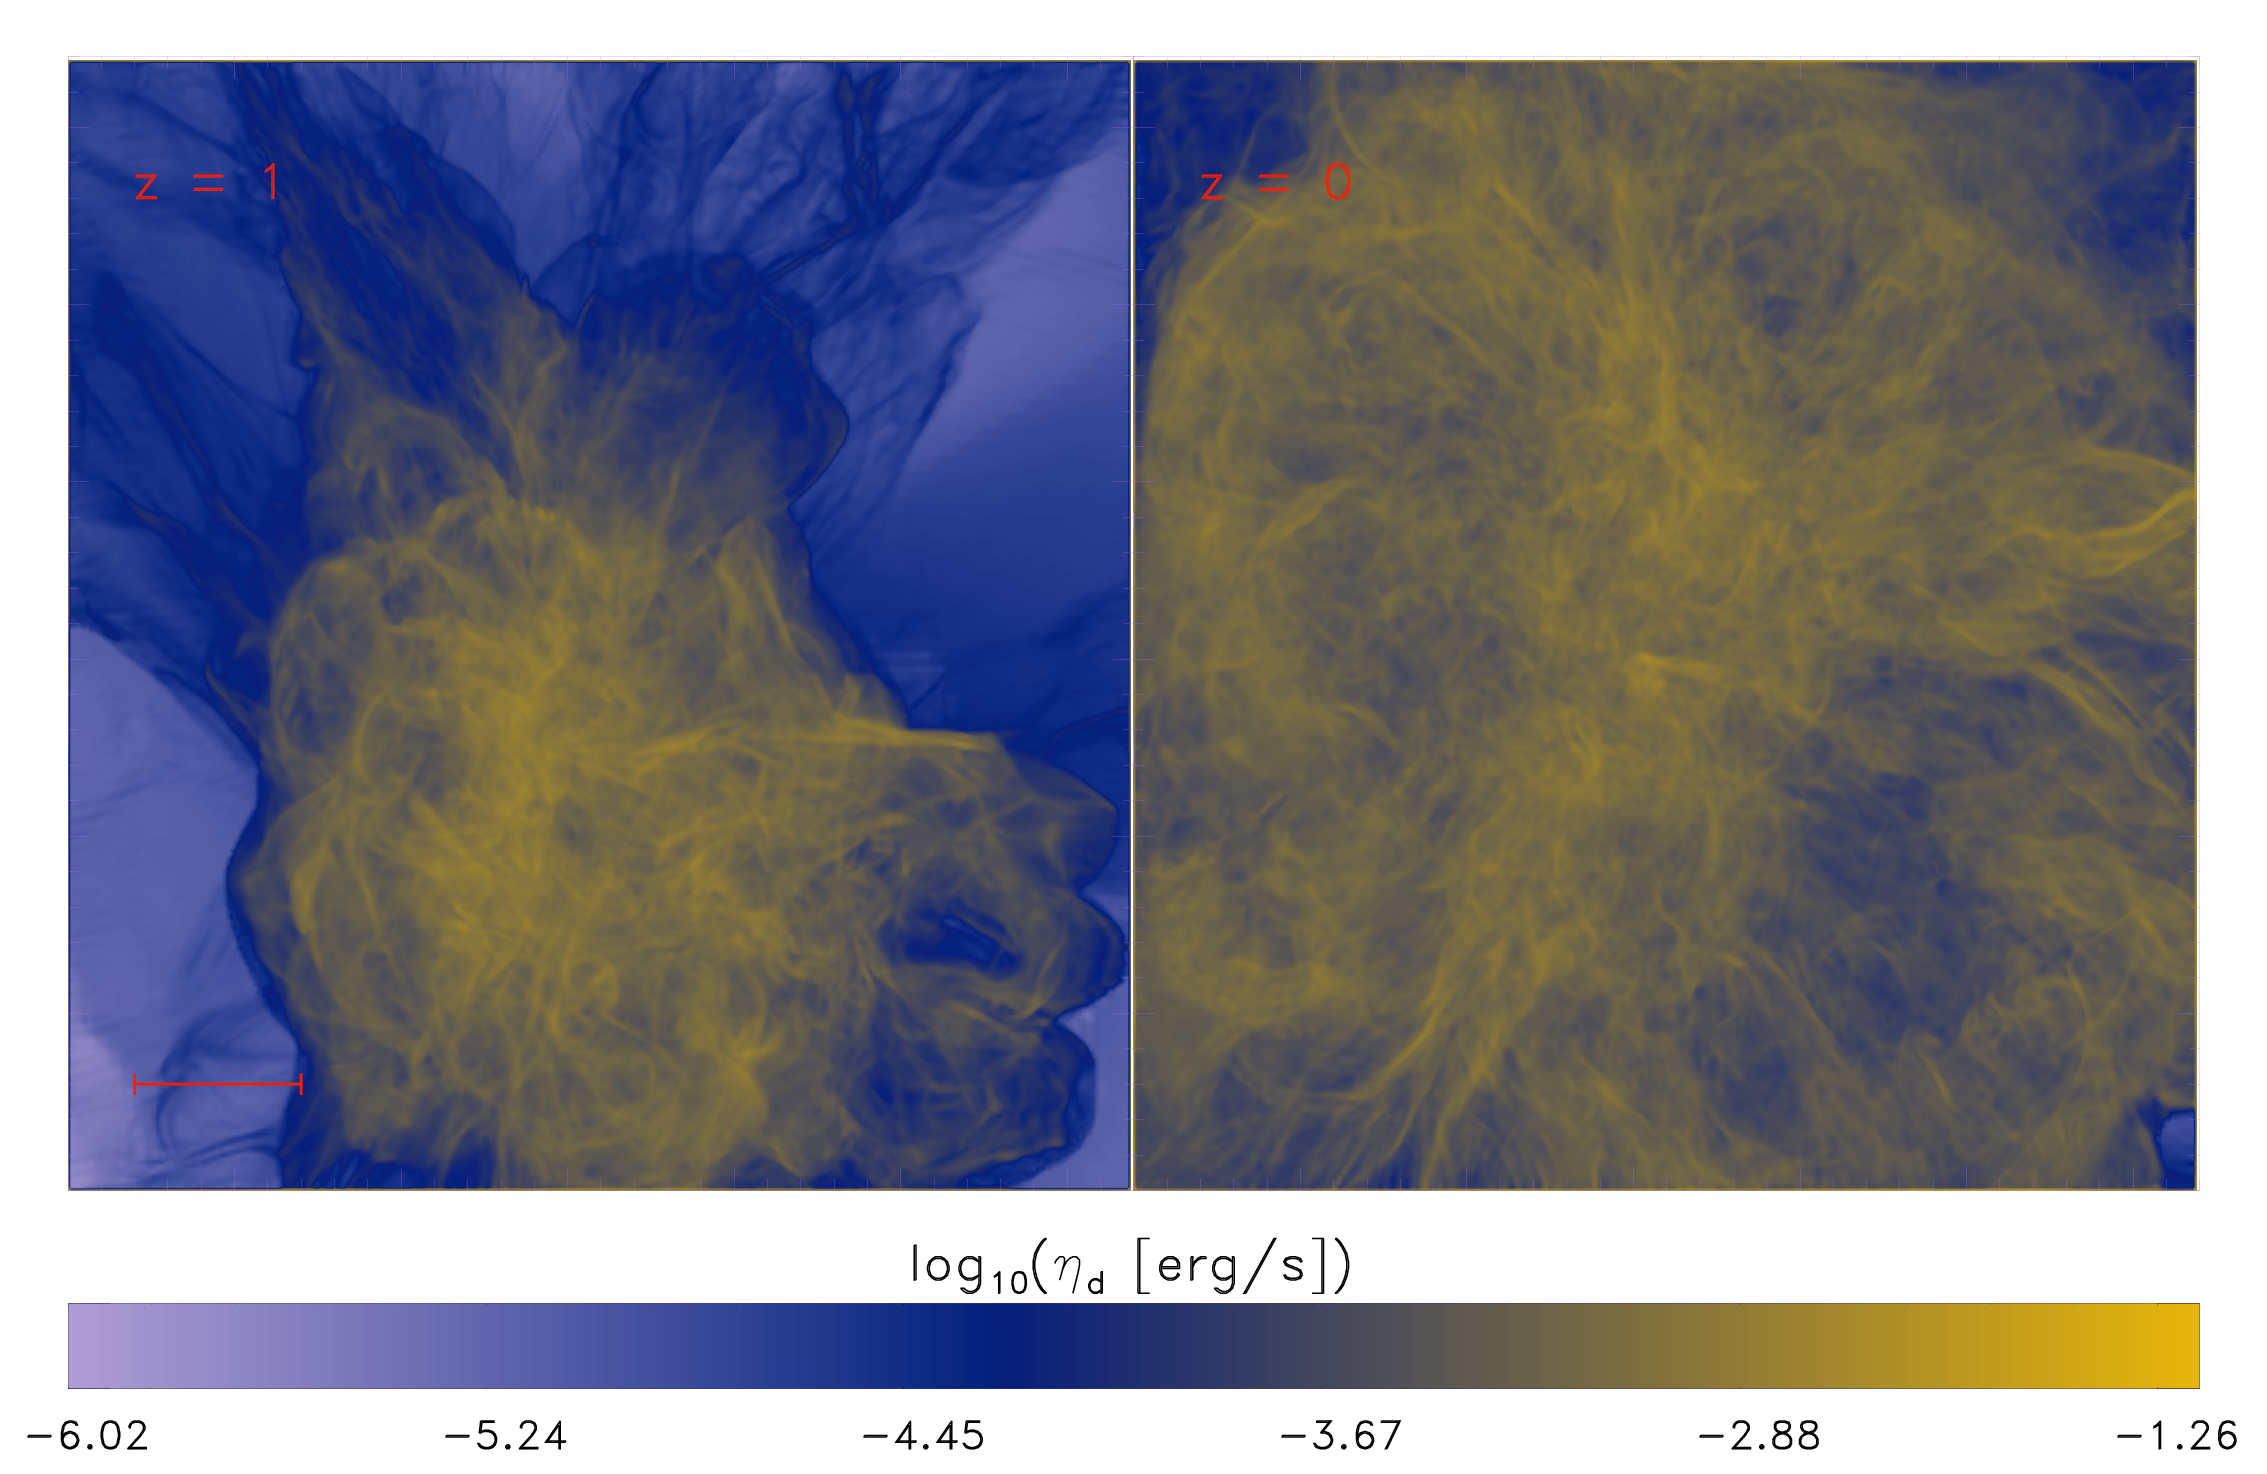
In Fig. 2, we show the projected enstrophy of cluster IT90_3 at redshifts and . At the enstrophy already spans a range of Myr-2 and fine turbulent structures are visible. Even at the earliest output from our simulation , enstrophy is already at the level of about 1 percent of what it is at or .
| ID | major merger | |||||||
|---|---|---|---|---|---|---|---|---|
| IT90_0 | no | |||||||
| IT90_1 | yes | |||||||
| IT90_2 | no | |||||||
| IT90_3 | yes | |||||||
| IT90_4 | no | |||||||
| IT92_0 | yes | |||||||
| IT92_1 | no | |||||||
| IT92_2 | no |
3.2 Evolution of enstrophy
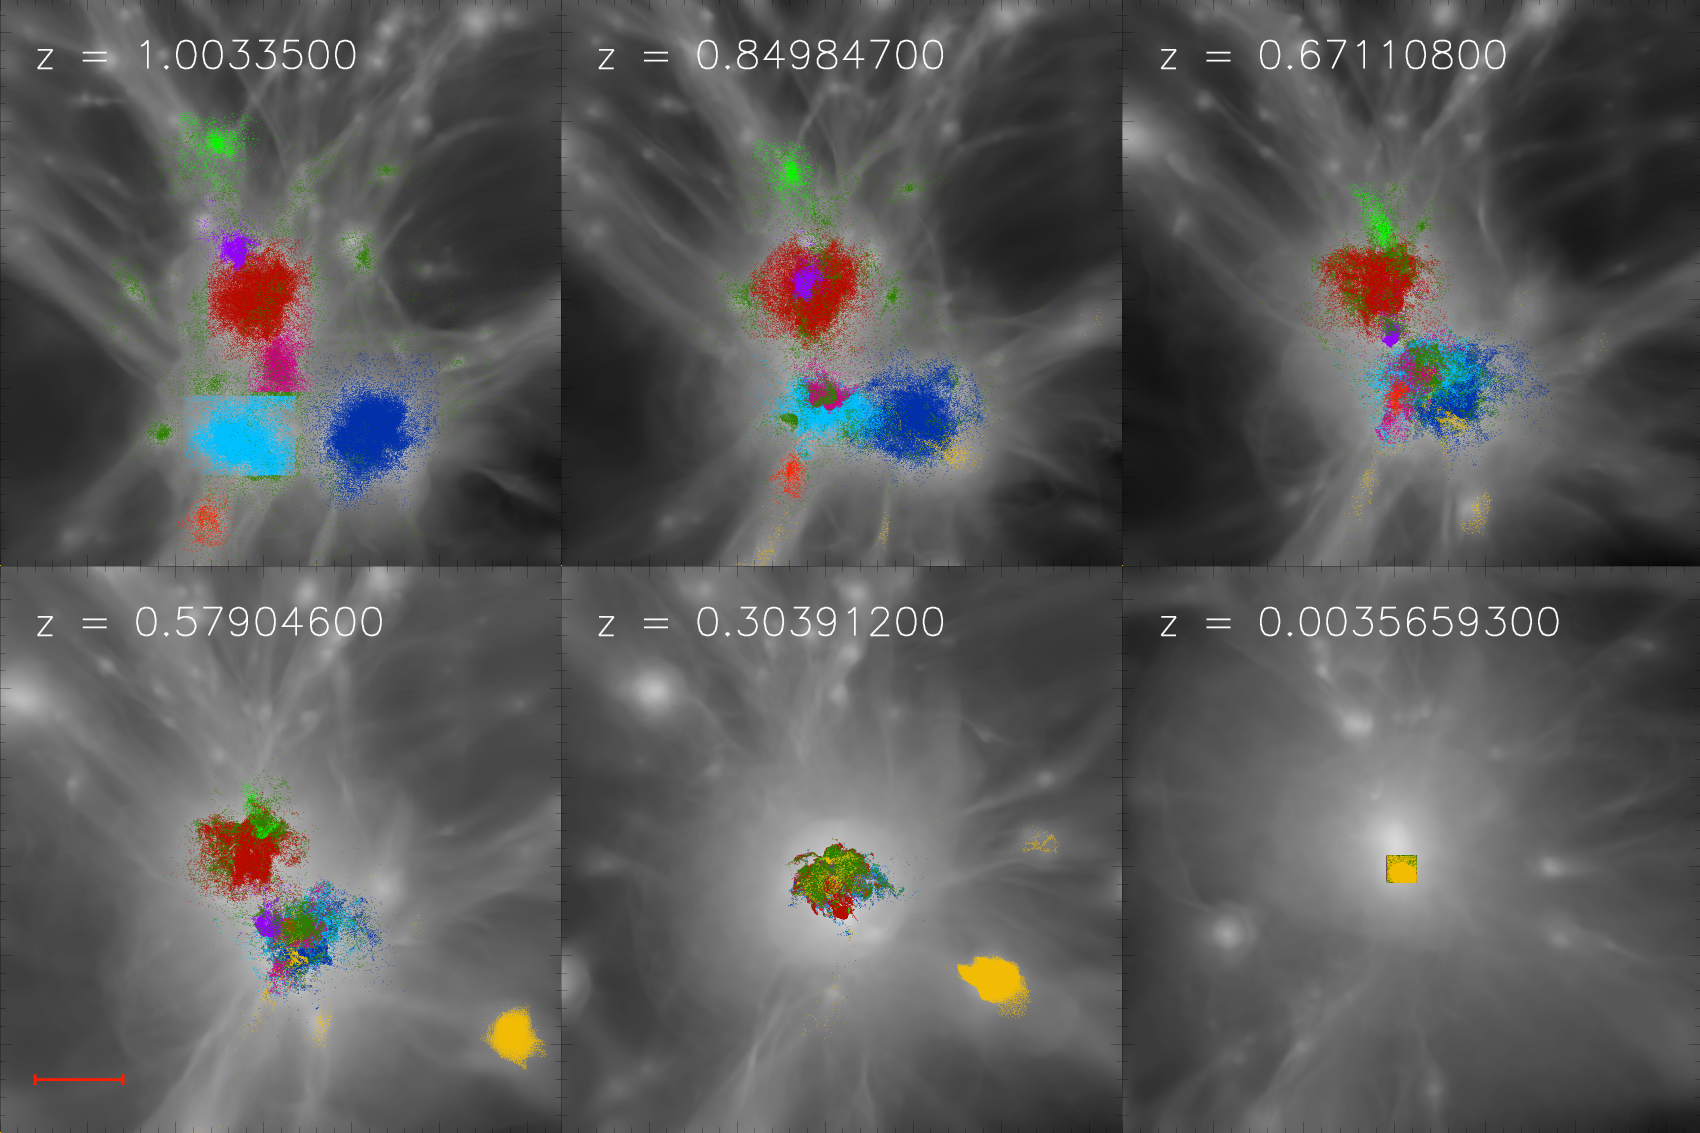
In order to investigate the source of enstrophy, we selected all tracers in the region centred around the peak of enstrophy at (see the yellow box in the last panel in Fig. 3 and red squares in Fig. 1). Then we followed the tracer positions back to their positions at . At that point, most of these tracers are located inside of gas clumps or are entering the high resolution box inside of gas clumps at a later time. Only few tracers cannot be associated with any gas clump (). At we further divided the tracers into different families depending on their position (see the different colours in the first panel in Fig. 3). We selected eight different families of tracers in each cluster, each associated with a gas clump and containing tracers plus one additional family that contains all tracers that were injected at the boundaries by mass inflow into the refined volume after .
This procedure mostly selects the gas component at associated with the densest gas substructures in the ICM, which are mostly associated with single self-gravitating gas clumps555All the clumps have . that are already formed at (see Fig. 3). The total gas masses of these clumps are typically a few , corresponding to total masses (gas and dark matter) of a few before ram pressure stripping and tidal interactions detach their gas and dark matter components (e.g. Tormen et al., 2004).
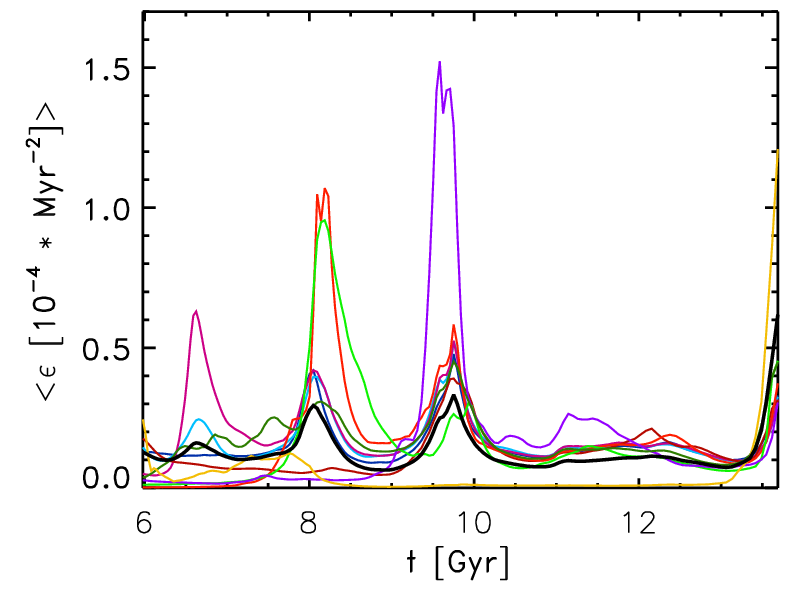
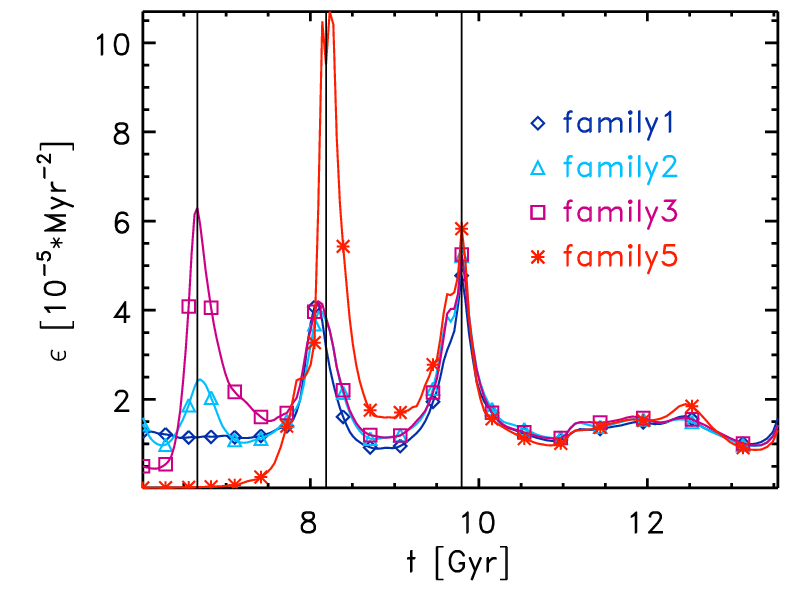
In Fig. 3, we show the advection of the selected tracers across cluster IT90_3. The enstrophy averaged over each individual family of tracers and over all tracers as a function of time is plotted in Fig. 4. The black line shows the results for all tracers, while the colours correspond to the selection from Fig. 3. The mean ensemble enstrophy peaks three times: around and . The times of the first two events correspond to two minor mergers between sub-clumps, while the time of the third event corresponds to the major merger observed in the IT90_3 cluster. Using the tracers we can cleanly isolate the different events. We see that peaks of enstrophy (shown in Fig. 4) always occur when two or more tracer families are colliding. As the tracers are following the gas, these events are connected to the merging of clumps.
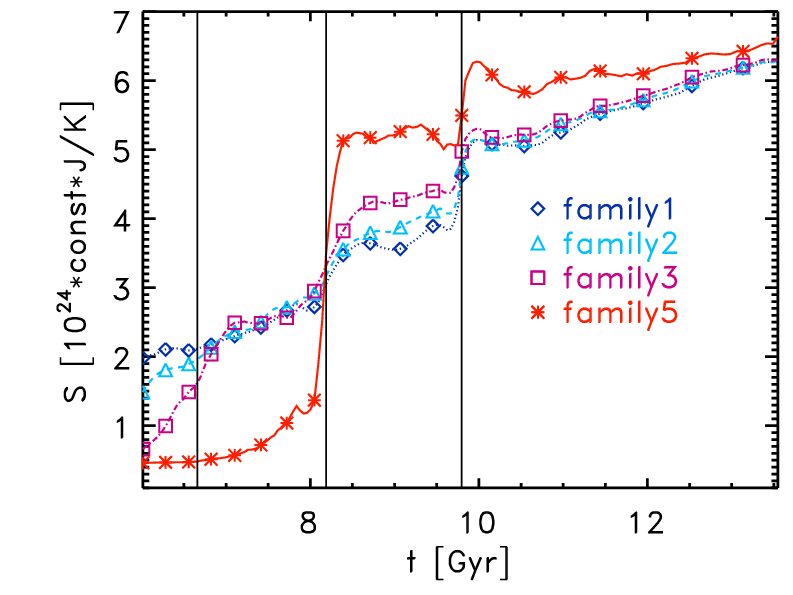
In the following, we will focus on the evolution of four tracer families whose collected enstrophy sharply increases at 666We notice that at the same time the enstrophy of two other families is increased, yet those two families are in a different region at this time and therefore they are related to a different, roughly simultaneous event.. At the four families are spatially separated. We show the evolution of the group enstrophies in Fig. 6. The enstrophy of each group always peaks around the time of merging. After the four clumps have merged, they all show the same evolution in enstrophy. The enstrophy peak at happens during another merger involving these now combined clumps
The thermal entropy777Represented as , where is a constant. (see Fig. 6) increases significantly when the enstrophy peaks, indicating dissipation either by shocks or by numerical dissipation of turbulence888For Kolmogorov turbulence it is easy to show from the Navier-Stokes equations that the local turbulent energy dissipation rate scales as (see Eq. 12) below itself. The apparent correlation between enstrophy and entropy then suggests that the dissipation of turbulent energy is the dominant mechanism for gas heating here. The evolution of Mach numbers shows strong Mach numbers at the jumps of entropy and enstrophy.
This supports the idea that these events happen during the occurrence of shocks.
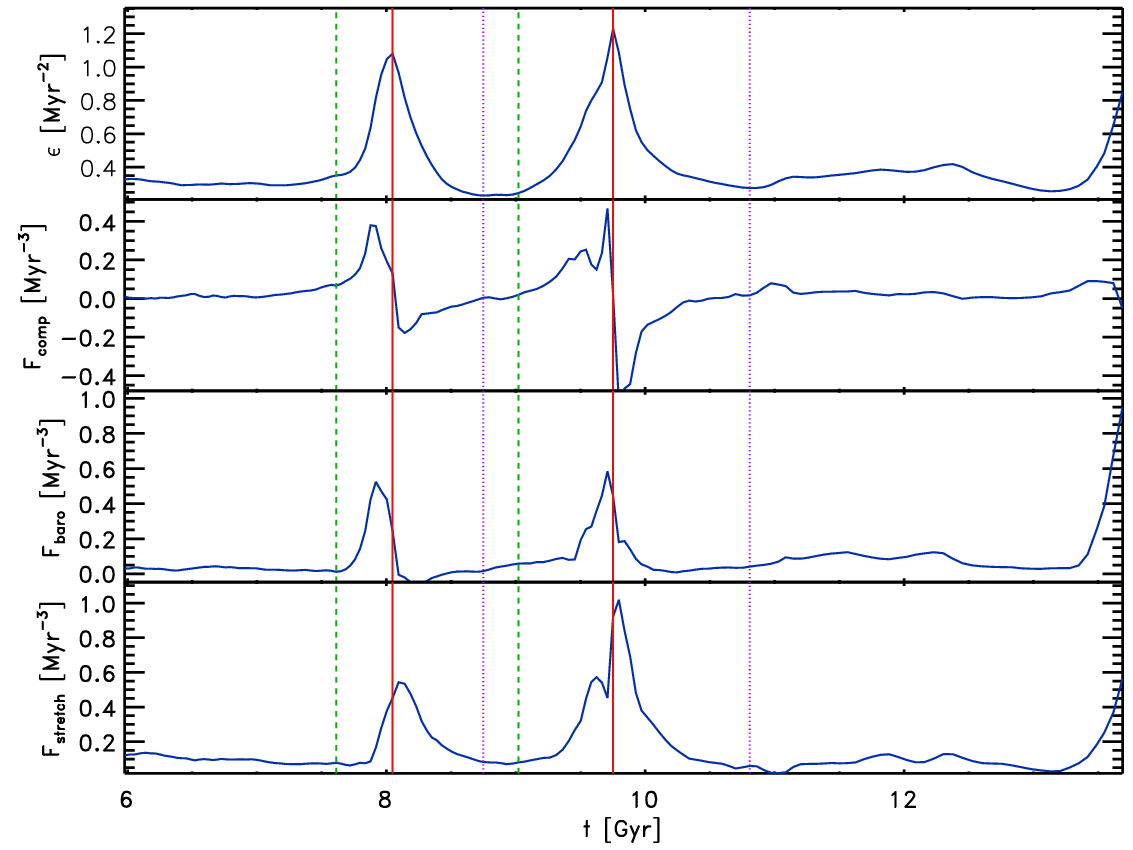
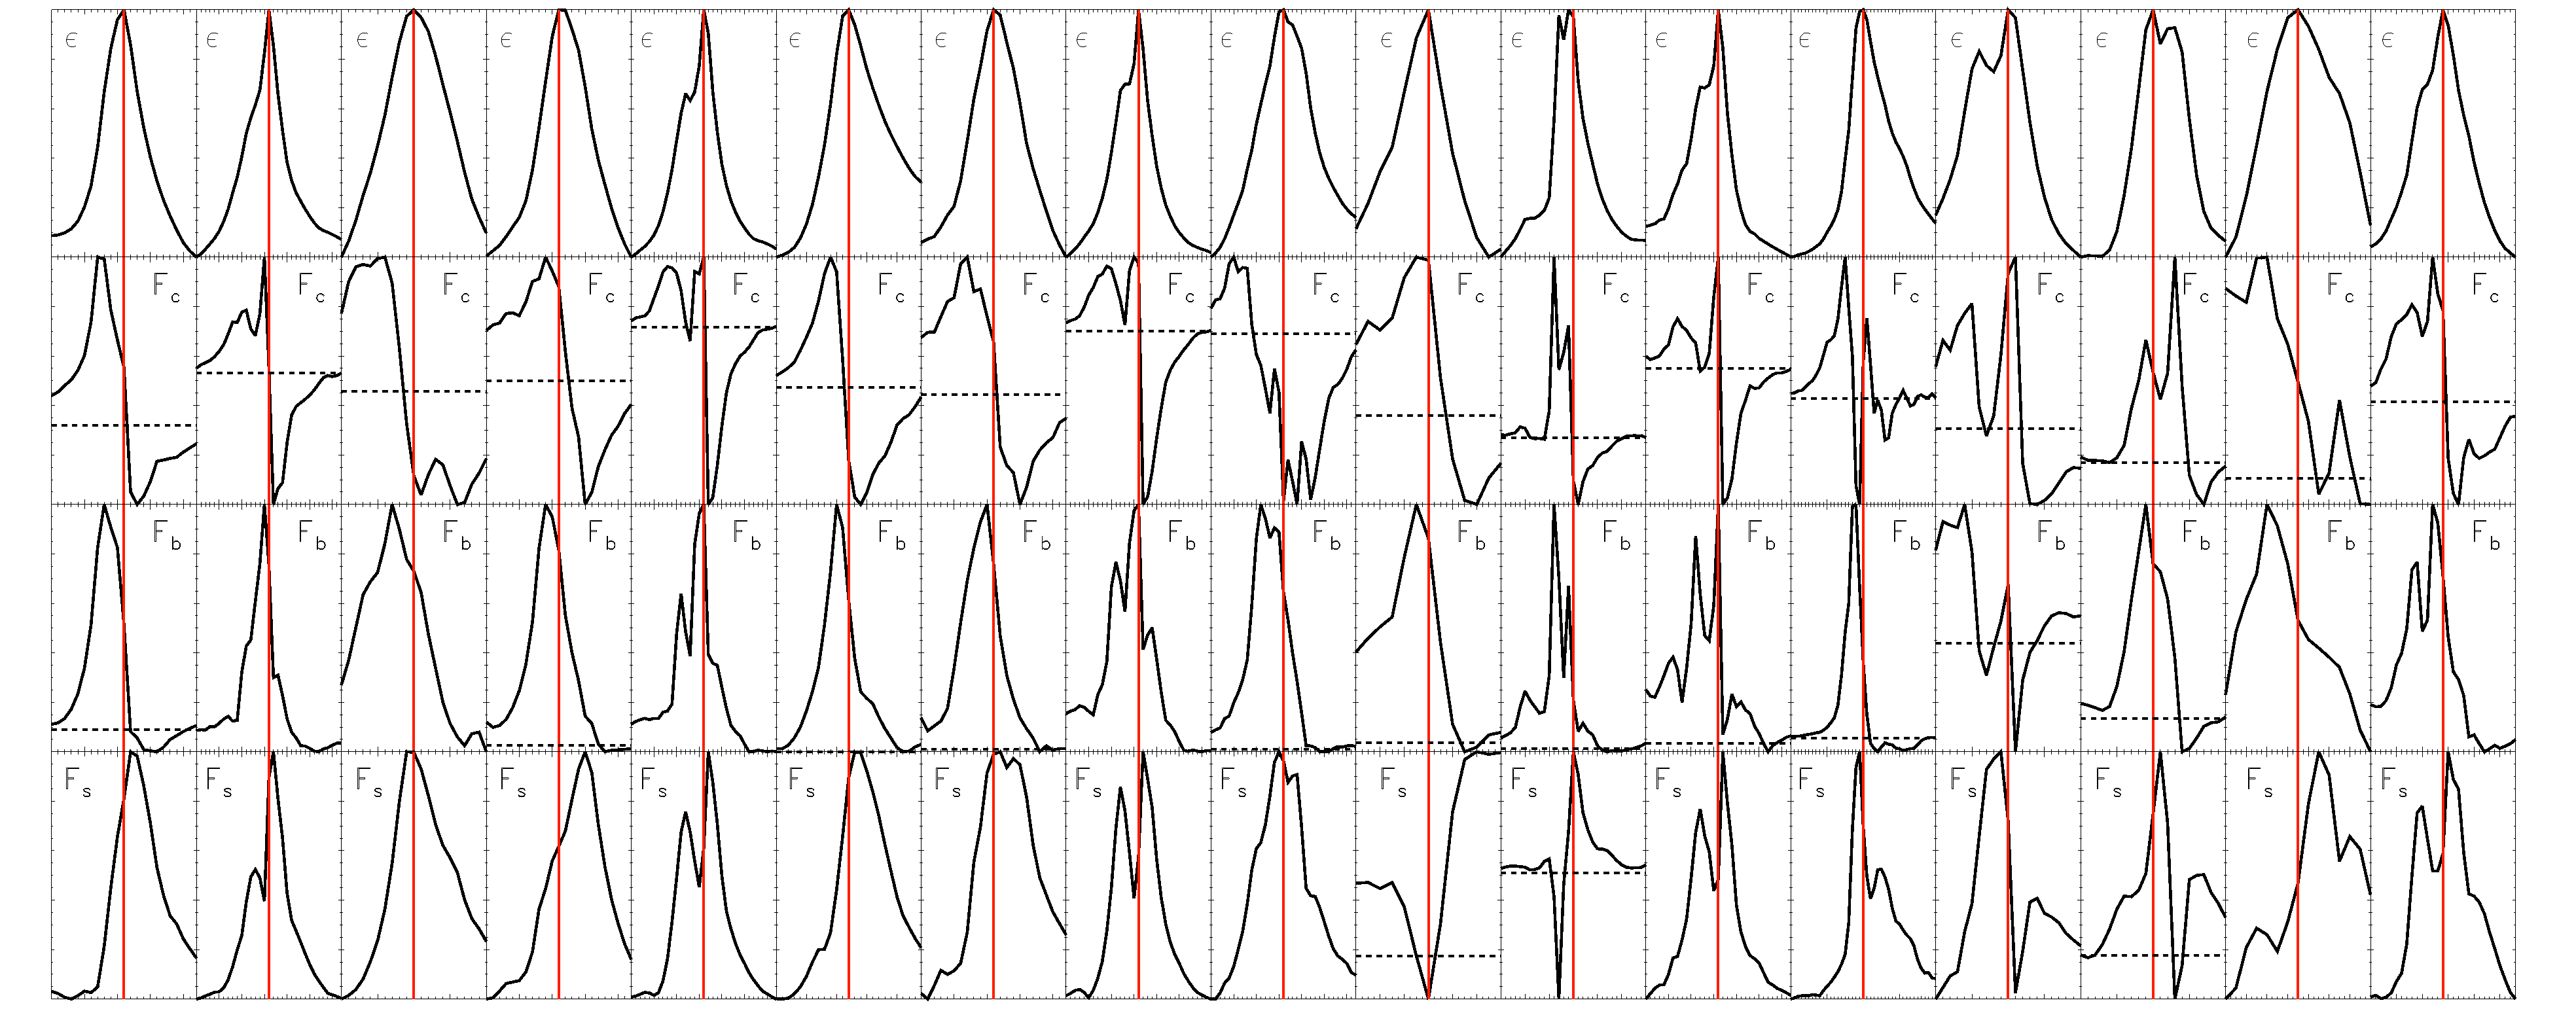
We now examine the individual source terms of the enstrophy (see Eq. 8) for the tracer family displayed in dark blue (see Fig. 7). The enstrophy (top row) shows two maxima at and at , marked by the vertical red lines. The green and purple lines mark the local minima before and after the peak of enstrophy. The compressive and baroclinic source terms (second and third row in Fig. 7) are always the strongest before the enstrophy reaches its maximum. On the other hand, the stretching source term (fourth row in Fig. 7) peaks after the maximum enstrophy. The other selections of tracers in cluster IT90_3 record the same sequence of events when enstrophy is enhanced (see Fig. 8 for all recorded events). The enstrophy and source terms are normalized to a unit time and unit amplitude. We note that the double peaks in some enstrophy lines (e.g., in the 14th column of Fig. 8) are numerical artefacts caused by limited time resolution in the ENZO data.

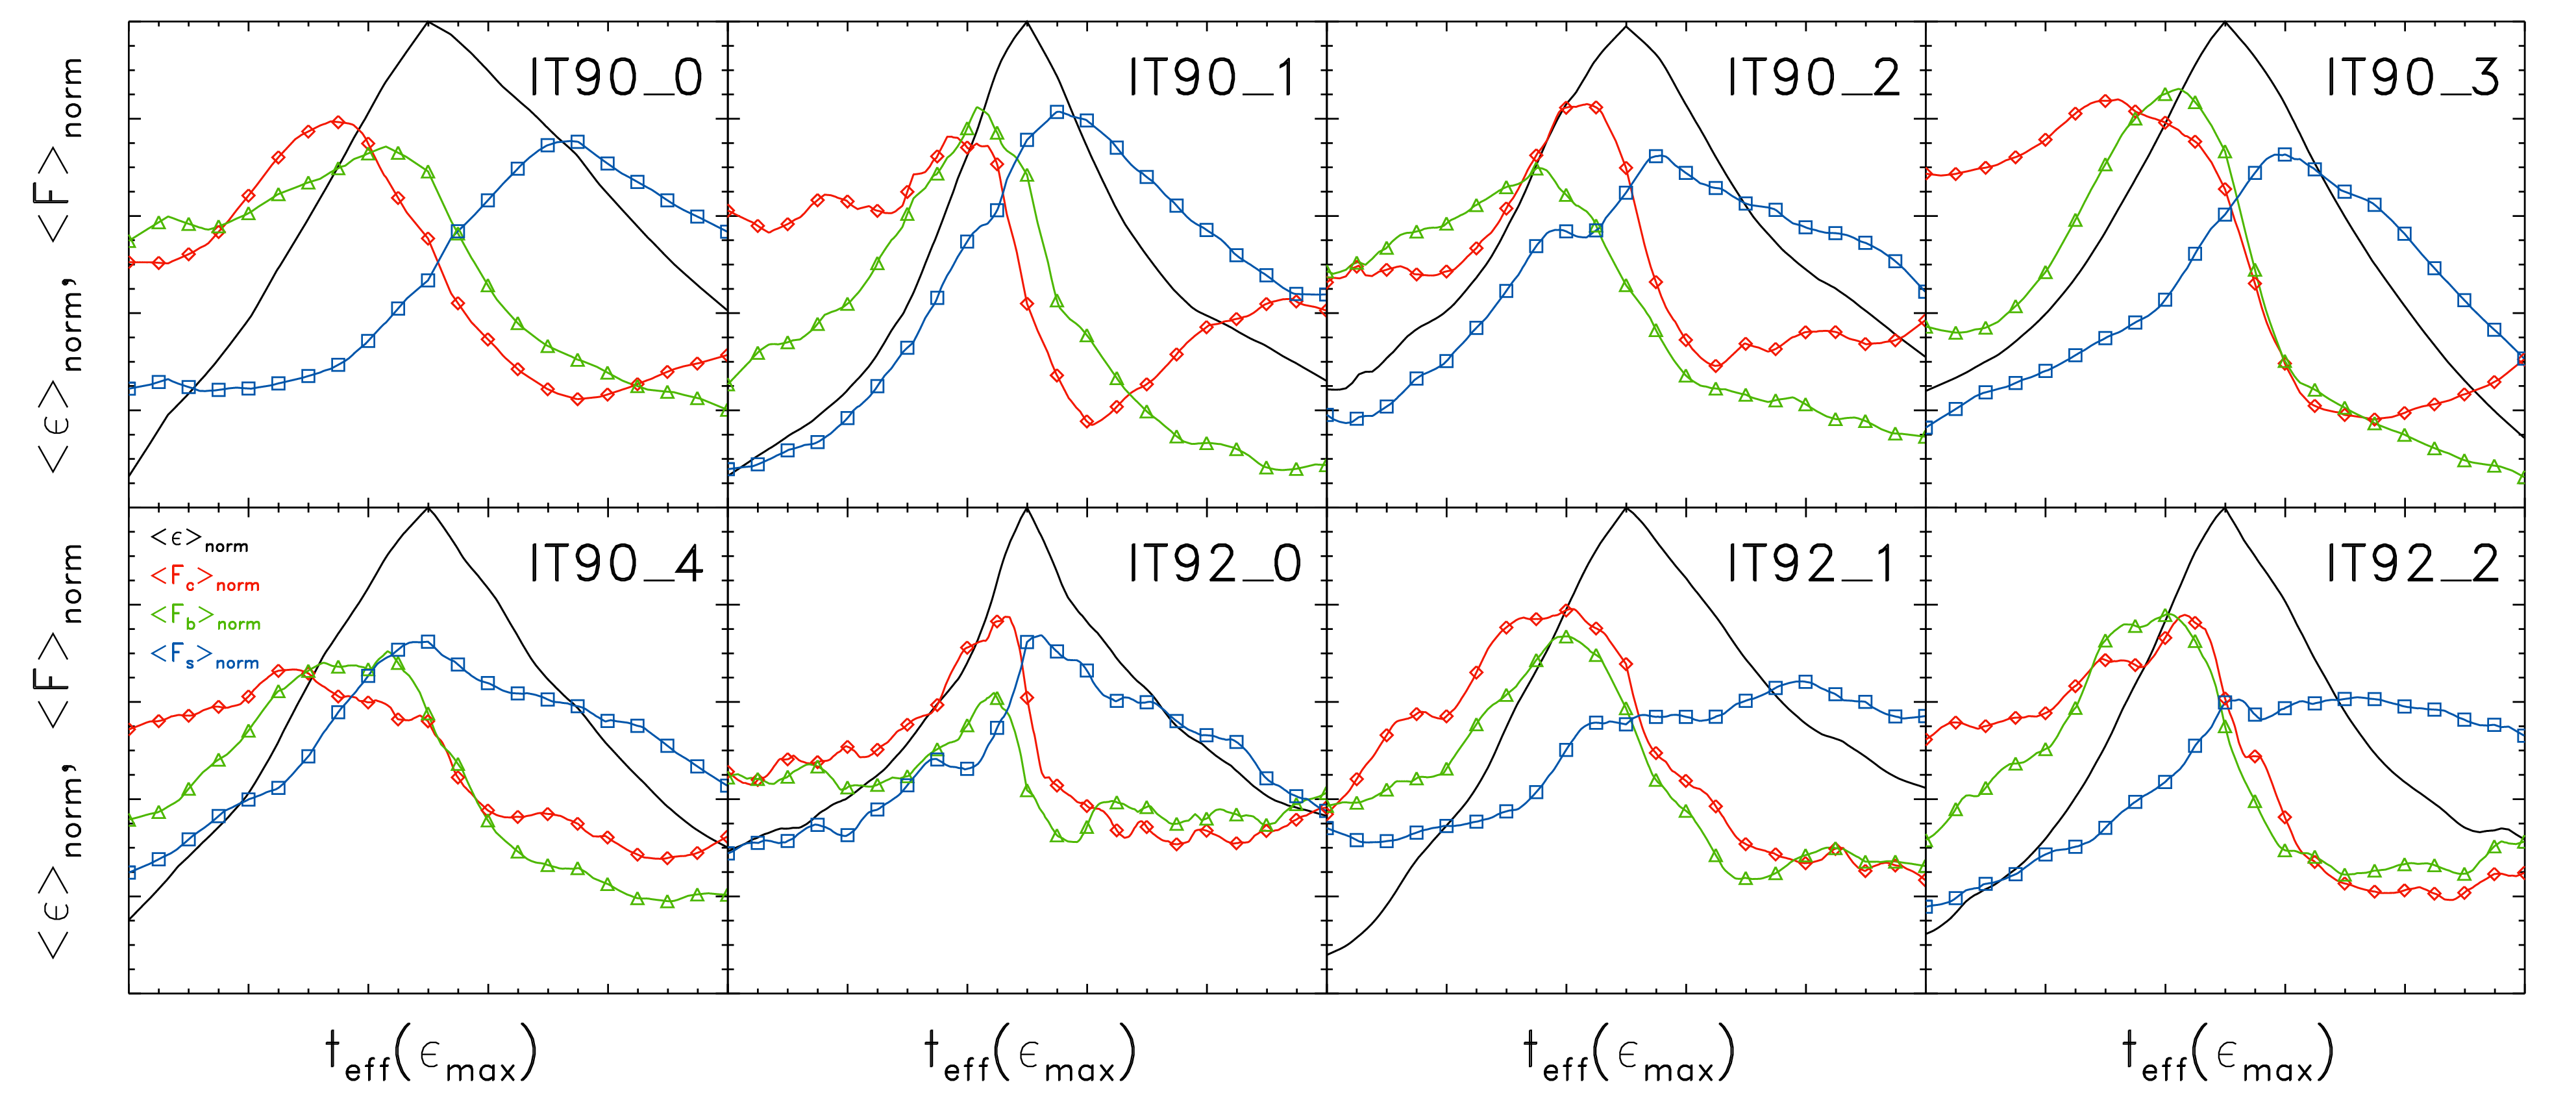
In Fig. 9 we show the mean values of enstrophy and sources terms for IT90_3 and the other clusters. The same analysis on the other seven clusters gives consistent results: on average the compressive and baroclinic motions are the strongest before the peak of enstrophy, while the stretching source is the strongest after the peak of enstrophy. However, some special cases are pointed out in the following:
IT90_0 shows the biggest delay between the maximum of compressive/baroclinic source terms (red and green lines in Fig. 9) and stretching source term (blue line in Fig. 9). As it turns out, the other clusters have much more violent and active histories than IT90_0, which is our most relaxed cluster. The other clusters have been exposed to a higher dynamical activity disturbing their ICMs. Consequent stretching motions occur throughout the lives of those clusters. Accordingly, the smaller time offsets between the source terms and the less distinct peaks in in IT90_2, IT91_1 and IT92_2 compared to IT90_0 are the consequences of cluster-scale evolutionary events rather than events related to local clumps.
In the case of IT90_1, the mean baroclinic source term is significantly stronger than the mean compressive source term. Still the compressive source term peaks before baroclinic source term. This distinction from the other clusters points out that the spatial extent of the compressive source term is much more sensitive to specific structures, e.g. shocks, while the baroclinic source can cover a larger volume since it reflects complex consequences of multiple events in the relatively recent history of the cluster.
3.3 Growth and decay timescales
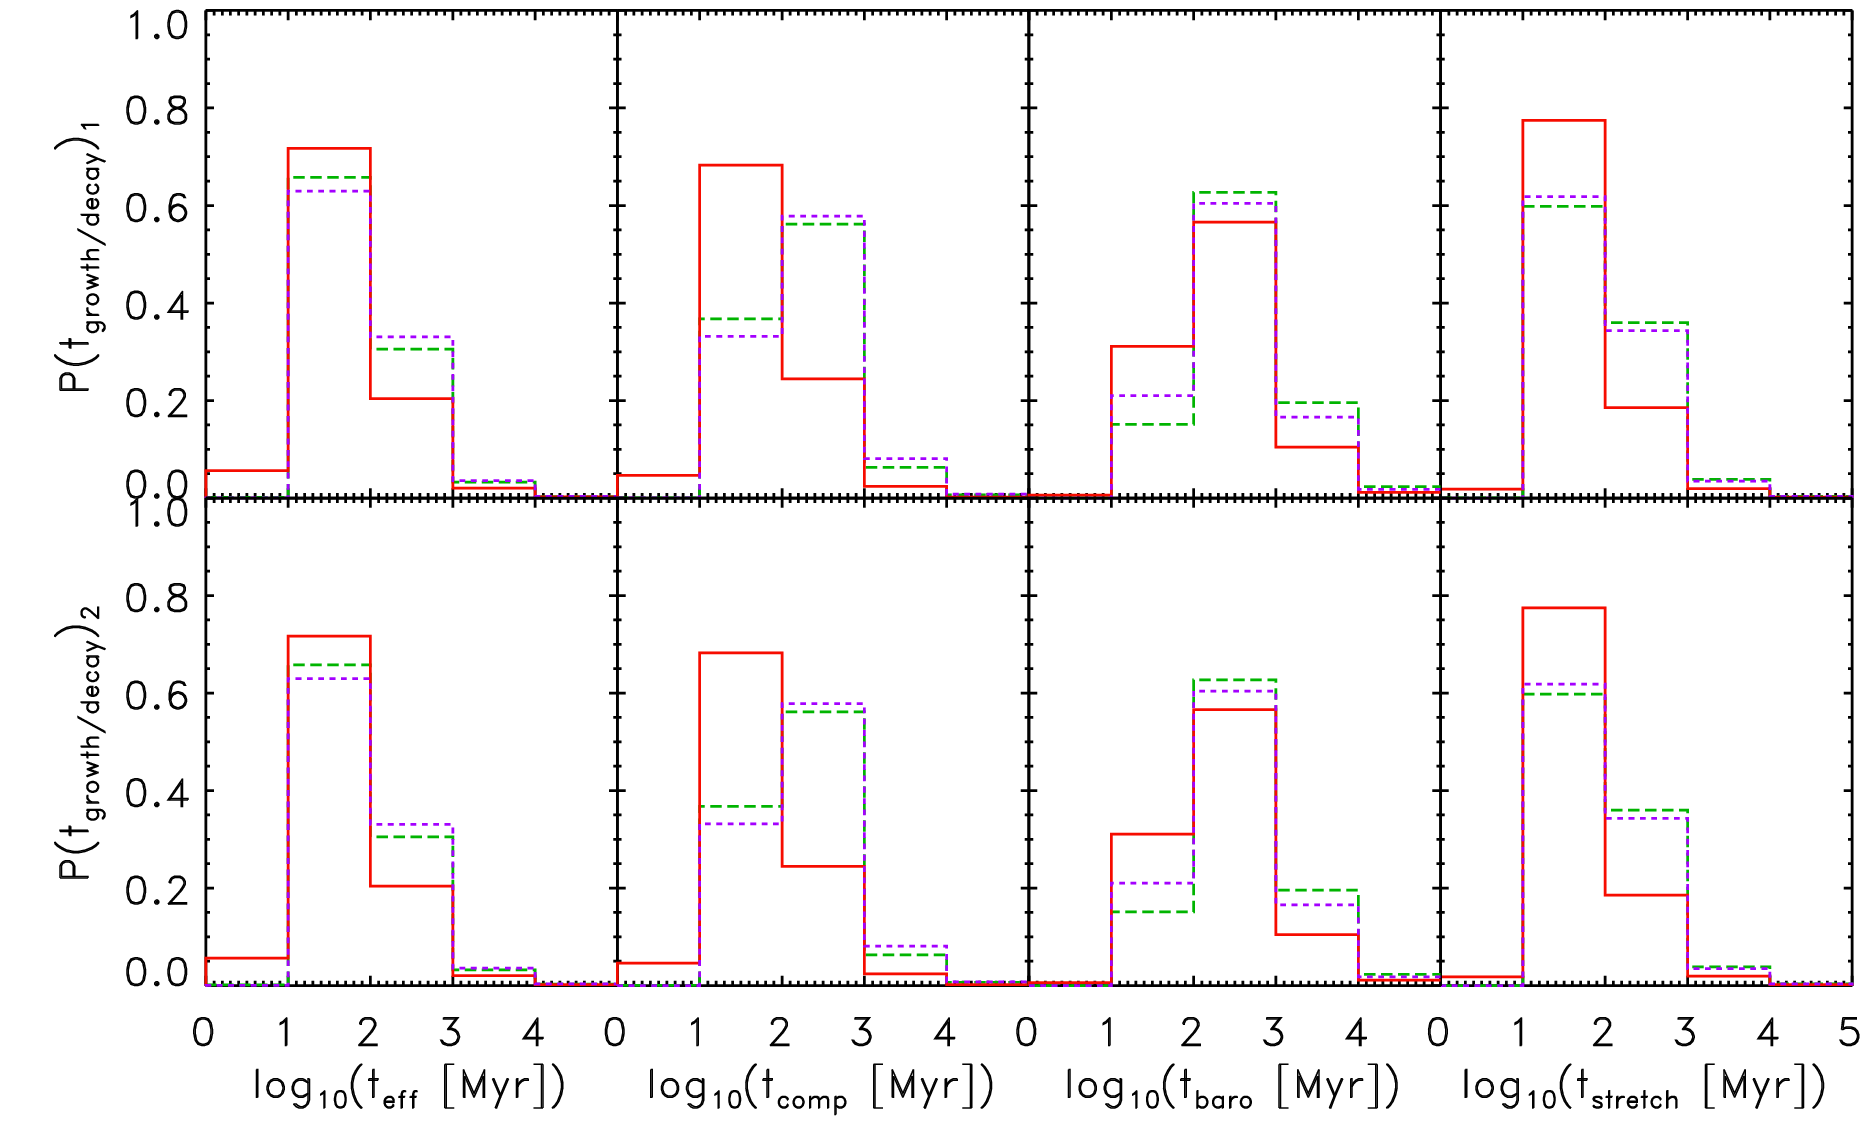
Following Eq. 9 and 10, we estimate the enstrophy growth and decay times999In the following we will refer to these characteristic growth and decay timescales only as evolutionary times., related to the individual source terms and of the effective change of enstrophy, measured by the tracers. We compute the distributions of the different evolutionary times at the six times marked in Fig. 7 (see Fig. 10).
At all times the distributions of the effective evolutionary times (left column in Fig. 10) show the same shape at all times. Most of the tracers recorded an effective evolutionary time in the range of ( of the tracers) or in the range of ( of the tracers). Furthermore we observe that during the events of maximum enstrophy the effective evolutionary times are decreased.
Comparing times for the individual source terms, we notice that is the most variable. At the peak of enstrophy, the compressive time is mostly in the range of while it is in the range of at other times. The evolutionary times of the other source terms remain mostly in a certain time range. The stretching time, , falls in the range and the baroclinic time, , falls in the range .
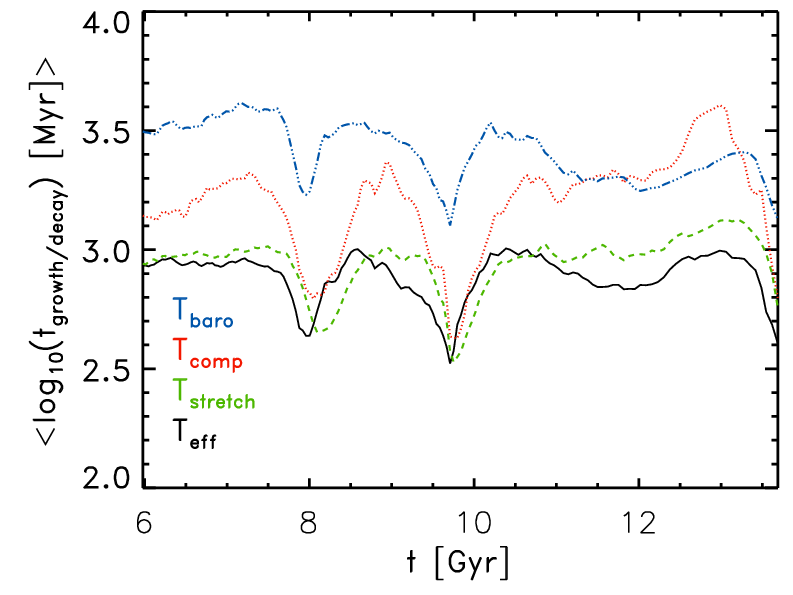
The analysis of the average evolutionary times (see Fig. 11) shows that stretching motions are dynamically most important for the evolution of turbulence within the cluster. The compressive motions are mostly subdominant throughout most of the clusters’ lifetime. Yet, they become important during the shock-related amplification of turbulence. The baroclinic source term on the other hand only has a small dynamical impact. While baroclinicity is an essential source of enstrophy, it is mostly a minor contributor to the net growth of enstrophy in comparison to compression and especially to stretching (see Fig. 11. At very late times, in this cluster the baroclinic source term becomes competitive with the compressive source term for a short amount of time (see in Fig. 11), perhaps because baroclinic contributions are more broadly distributed in that era. This is because baroclinic sources are concentrated in shocks, which are relatively weak after the last merger event. On the other hand, the contribution from the baroclinic source term is negligible in dense environments (as it is always smaller than the solenoidal source term). However, in Vazza et al. (2017) we showed that it gets very important for the enstrophy generation in cluster outskirts, where flows following oblique shocks first inject vorticity in the ICM.
The evolutionary times in the other clusters besides IT90_3 show the same qualitative behaviour. The stretching source term always shows the shortest evolutionary time, in the range of , while the other source terms show a comparable evolutionary time around the major events that amplify enstrophy and they show a larger evolutionary time otherwise. We also notice that the more relaxed clusters, e.g. IT90_0, show large evolutionary times of around .
In summary, our analysis shows that the fastest stage of enstrophy evolution of the densest substructures in the ICM is dominated by compression and shortly followed by stretching of vorticity. The baroclinic generation of vorticity is less important in this density regime, but it produces substantial vorticity at earlier times and across outer accretion shocks.
3.4 Dissipation term and magnetic field amplification
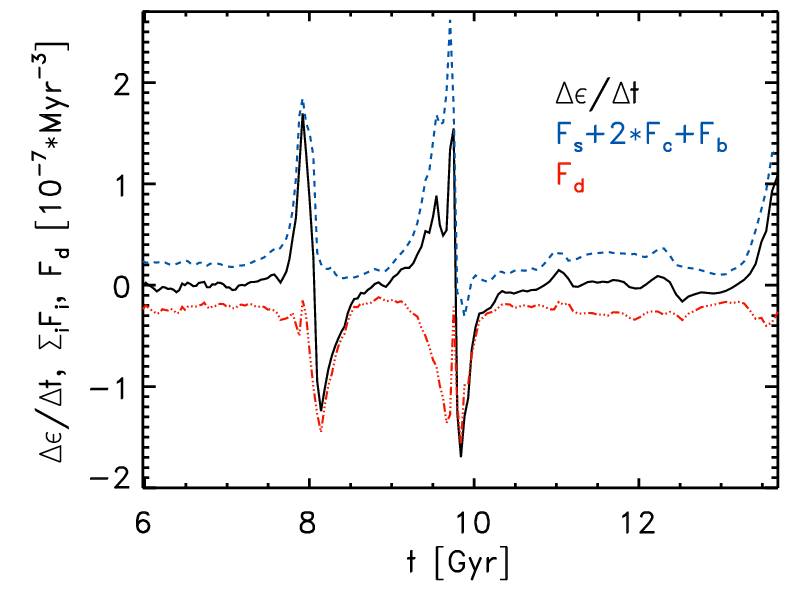
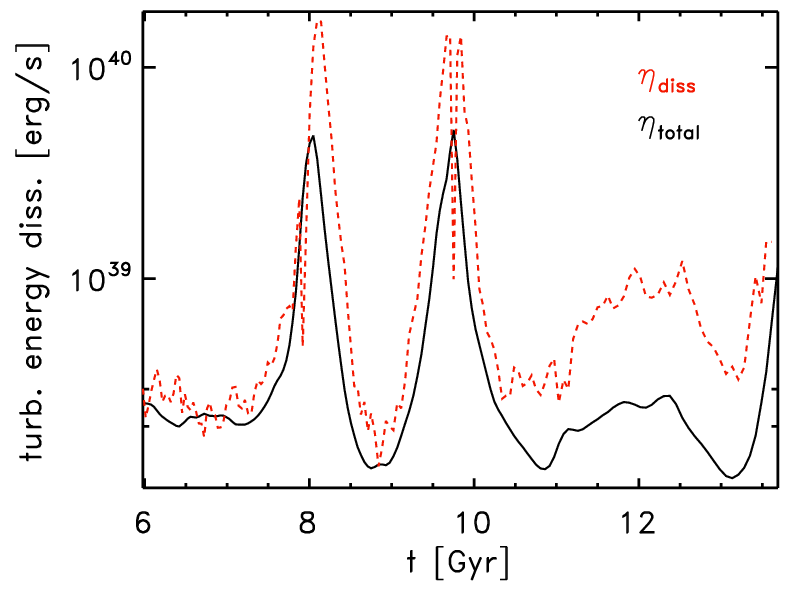
In Eq. 8, we neglected the dissipation term since it is not well-defined in an ideal flow. However, the numerical dissipation of turbulent motions is obviously present, as we are not employing sub-grid modelling of turbulence (e.g. Schmidt et al., 2015). Here we try to empirically constrain its amplitude from the offset between the measured enstrophy change and the summed source terms in Eq. 8. In Fig. 12, we plot the evolution of the right (blue line) and left (black line) hand-side of Eq. 8 computed with the same tracer family that we have studied in detail in the previous sections and that is displayed in Fig. 7. The two evolutions show a non constant offset, which we plausibly ascribe to the effect of dissipation. Especially at and the difference is not constant showing that turbulence is dissipated. Hence we compute the dissipation term as:
| (11) |
The amount of dissipated enstrophy is the time-integrated absolute value of Eq. 11 . In the Navier-Stokes formalism (see App. B) the dissipation rate can be computed without any knowledge on the explicit viscosity. In fact, to a first approximation only a minimum turbulent scale is required (which admittedly depends on the existence of an effective viscosity). In our case, this minimum scale is set by the cell size of our grid cells. Hence, we can compare the results of Eq. 6 with the net effective dissipation. Following the approach of Vazza et al. (2017)101010See also App. B., we compute this as:
| (12) |
using a length scale111111This is the width of the stencil used to compute the vorticity and which also represents an approximation to the minimum scale for the cascade. of and the total amount of enstrophy . In Fig. 12 we compare the mass-integrated values, , of both quantities computed using the tracers. We observe that they are in general agreement (see Fig. 12) and assume that in Eq. 11 is a reasonable proxy for the dissipation rate of the turbulent cascade in our simulations.
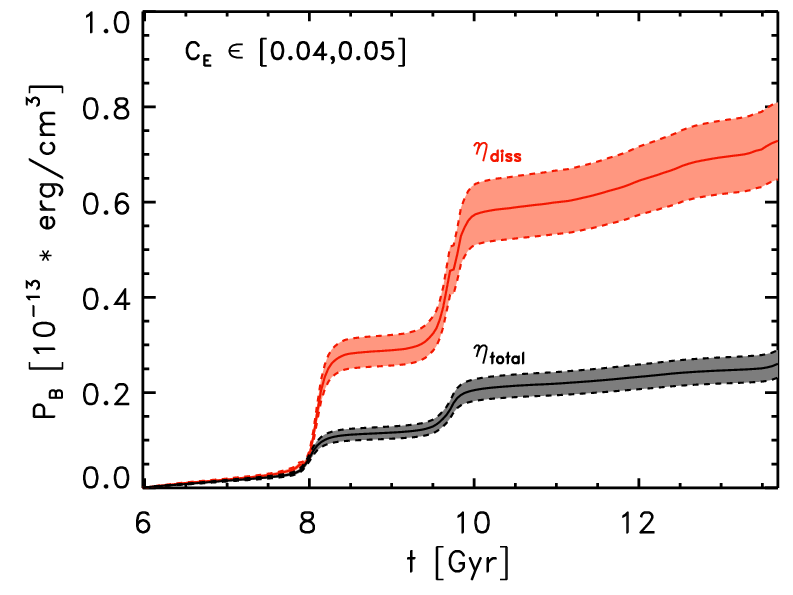
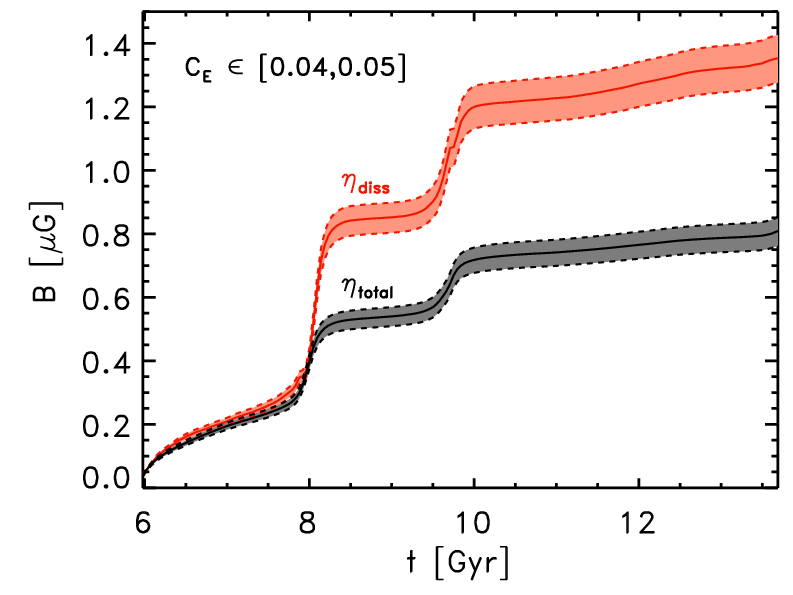
If the ICM is magnetised and the gas flow is turbulent enough to produce a small-scale dynamo, a fraction of the turbulent energy in the ICM is transferred to the intracluster magnetic fields (for recent reviews see e.g. Subramanian et al., 2006; Ryu et al., 2008, 2012). In a predominantly sub-sonic, non stationary and solenoidal turbulence the amplification of ICM magnetic fields can substantially differ from what measured in the simulated ISM (e.g. Pan et al., 2016; Kritsuk et al., 2017). Recently, Miniati & Beresnyak (2015) estimated the efficiency of turbulent energy that is transferred to magnetic fields to be in the range of . Following their approach we compute the evolution of the magnetic energy from the history of turbulent dissipation as (see App. B)
| (13) |
As an example, we estimate the evolution of magnetic energy based on enstrophy evolution by one selection of tracers from IT90_3 in Fig. 13. At the magnetic energy is of the order of erg cm-3 using and of erg cm-3 using . This translates into magnetic fields ranging around and , respectively. The above estimates for the magnetic field strengths were computed using the tracers that reside in the cluster core region at . The values estimated in this way are in good agreement with results from observations (e.g. Govoni et al., 2010). Both, the magnetic field and the magnetic energy are increased stepwise at and tracing the evolution of the dissipation term. The timing of these jumps coincide with the times of the merging events in IT90_3. During the mergers, enstrophy is quickly amplified and is then rapidly dissipated again. Part of this energy will be transferred to the magnetic fields on eddy turnover timescales. The magnetic field growth becomes slower soon after the turbulence subsides. For our estimates on the magnetic field amplification, we neglected magnetic field dissipation that becomes important once the turbulence decays. Therefore, our results are an upper limit.
We observe similar results in the other clusters of our sample. In all clusters, we estimated the mass-integrated values of and to be of the same order, which are both in the range of erg s-1. Application of the above model for transfer of solenoidal turbulent energy into magnetic energy produces magnetic fields, this will produce magnetic fields of the order of a few . In all cases we observe the episodic jumps in the magnetic field growth. These jumps are always connected to some kind of merging activity.
4 Discussion & conclusions
We studied the origin and history of enstrophy of the ICM in galaxy clusters formed in Eulerian grid cosmological simulations. We did this using Lagrangian tracer particles that tracked the evolution of the enstrophy in their associated ICM mass along with the associated enstrophy sources and sinks. This way we could analyse the accretion history of turbulence in eight clusters with different formation histories and with different dynamical states at . In the Lagrangian frame enstrophy sources and sinks can be decomposed into compressive, baroclinic, stretching and dissipative terms derived from the compressible Navier-Stokes equations and as defined in Eq. 8. We used the Lagrangian tracer code CRaTer to follow these different source terms and the relative timings of cluster formation events at the peaks of enstrophy.
Close examination of the gas flow properties early in our simulations revealed that small small amount of enstrophy, and therefore turbulence in gas clumps, has already been generated at an early age of the cluster, . We have not determined the origin of this very early enstrophy, yet we consider that at least some of it may result from baroclinicity in the cosmologically-based simulation initial conditions. Our analysis showed that additional enstrophy is later generated by baroclinic motions resulting from shocks during the cluster evolution. The generated enstrophy is amplified by compressive and stretching motions. Enstrophy, in association with the turbulence, is dissipated on small scales, just as its turbulent kinetic energy. This turbulent energy contribution contributes substantially to heating of the ICM. Our tracer analysis showed that there is a clear sequence of cluster formation events that lead to strong amplification and decay of enstrophy. During merger events we observed first an increase in the compressive source term, indicating that compression that is mostly connected to shocks is amplifying the enstrophy. Around the same time the baroclinic source term is growing as well, supporting the connection to shocks, and additional enstrophy is generated. Following these two developments the enstrophy reaches its maximum and then starts to decay again. From the previous discussion and results in App. B, we see that the enstrophy dissipation rate increases strongly as the enstrophy increases (), so once and , which are the primary solenoidal turbulence drivers, diminish, the dissipation rate overwhelms even a strong source and decays along with the solenoidal turbulent energy.
In order to obtain a more quantitative view of the dynamical importance of each source term over time, we computed the effective and individual evolutionary time of the source terms. Throughout the whole cluster history, the stretching source term has on average the shortest evolutionary (the fastest enstrophy amplification) time with and therefore enstrophy amplification is largely controlled by is controlled by stretching. This seems natural as vortex stretching and energy dissipation are independent of the fluid viscosity, e.g. the dissipative anomaly, in incompressible turbulence. On the other hand, the compressive and baroclinic evolutionary times range between during most of the cluster lifetime making them weak compared to the stretching source term. They only become competitive, when they are during dynamical events when shocks and other compressions are strong, such as during mergers. This is consistent with our results that the stretching motions are dynamically most important for the evolution of turbulence in galaxy clusters. Yet, baroclinic motions are needed to initially generate turbulence and compressive motions are, once they are acting, a strong booster for enstrophy. The above results are consistent for all clusters that we examined.
The enstrophy dissipation rate peaks when the enstrophy peaks, as already noted. This situation also corresponds to the most rapid amplification of ICM magnetic field and, quite possibly, the peak rate of turbulent acceleration of cosmic rays (see Brunetti & Jones, 2014, and references therein). In the case of magnetic fields, using magnetic field behaviors from existing MHD turbulence simulations we estimated peak ICM magnetic field strengths G in our simulated clusters, consistent with estimates from current radio observations (e.g. Govoni et al., 2010).
As a final remark, we notice that the study of the internal dynamics of gas substructure is very relevant to model high-resolution X-ray observations of groups falling onto larger clusters (e.g. Markevitch et al., 2000; Randall et al., 2008; Eckert et al., 2014; Ichinohe et al., 2015; De Grandi et al., 2016) and their implication to understand plasma processes in these environments. More work is also need to investigate the effects of cooling, feedback (e.g. Dolag et al., 2009) and gas viscosity (e.g. Roediger et al., 2015), which were not included in this work.
acknowledgements
We thankfully acknowledge G. Brunetti and D. Eckert for fruitful scientific conversations. DW acknowledges support by the Deutsche Forschungsgemeinschaft (DFG) through grants SFB 676 and BR 2026/17. TWJ acknowledges support from the US NSF through grant AST121159. FV acknowledges personal support from the grant VA 876/3-1 from the DFG, and from the European Union’s Horizon 2020 research and innovation programme under the Marie-Sklodowska-Curie grant agreement no.664931. FV and MB also acknowledge partial support from the grant FOR1254 from DFG. The ENZO-simulations have been carried out in the ITASCA-cluster hosted by the University of Minnesota.
References
- Beresnyak (2011) Beresnyak A., 2011, Physical Review Letters, 106, 075001
- Berrier et al. (2009) Berrier J. C., Stewart K. R., Bullock J. S., Purcell C. W., Barton E. J., Wechsler R. H., 2009, ApJ, 690, 1292
- Brüggen & Vazza (2015) Brüggen M., Vazza F., 2015, in Astrophysics and Space Science Library, Vol. 407, Magnetic Fields in Diffuse Media, Lazarian A., de Gouveia Dal Pino E. M., Melioli C., eds., p. 599
- Brunetti & Jones (2014) Brunetti G., Jones T. W., 2014, International Journal of Modern Physics D, 23, 30007
- Brunetti & Lazarian (2007) Brunetti G., Lazarian A., 2007, MNRAS, 378, 245
- Bryan et al. (2014) Bryan G. L. et al., 2014, ApJS, 211, 19
- Colella & Woodward (1984) Colella P., Woodward P. R., 1984, Journal of Computational Physics, 54, 174
- De Grandi et al. (2016) De Grandi S. et al., 2016, A&A, 592, A154
- Dolag et al. (2009) Dolag K., Borgani S., Murante G., Springel V., 2009, MNRAS, 399, 497
- Eckert et al. (2014) Eckert D. et al., 2014, A&A, 570, A119
- Gotoh et al. (2002) Gotoh T., Fukayama D., Nakano T., 2002, Physics of Fluids, 14, 1065
- Govoni et al. (2010) Govoni F. et al., 2010, A&A, 522, A105
- Ichinohe et al. (2015) Ichinohe Y., Werner N., Simionescu A., Allen S. W., Canning R. E. A., Ehlert S., Mernier F., Takahashi T., 2015, MNRAS, 448, 2971
- Khatri & Gaspari (2016) Khatri R., Gaspari M., 2016, MNRAS, 463, 655
- Komatsu et al. (2011) Komatsu E. et al., 2011, ApJS, 192, 18
- Kritsuk et al. (2017) Kritsuk A. G., Ustyugov S. D., Norman M. L., 2017, New Journal of Physics, 19, 065003
- Landau & Lifshitz (2013) Landau L., Lifshitz E., 2013, Fluid Mechanics No. Bd. 6. Elsevier Science
- Markevitch et al. (2000) Markevitch M. et al., 2000, ApJ, 541, 542
- Mee & Brandenburg (2006) Mee A. J., Brandenburg A., 2006, MNRAS, 370, 415
- Mendygral et al. (2012) Mendygral P. J., Jones T. W., Dolag K., 2012, ApJ, 750, 166
- Miniati (2015) Miniati F., 2015, ApJ, 800, 60
- Miniati & Beresnyak (2015) Miniati F., Beresnyak A., 2015, Nature, 523, 59
- Pan et al. (2016) Pan L., Padoan P., Haugbølle T., Nordlund Å., 2016, ApJ, 825, 30
- Pinto et al. (2015) Pinto C. et al., 2015, A&A, 575, A38
- Porter et al. (2015) Porter D. H., Jones T. W., Ryu D., 2015, ApJ, 810, 93
- Randall et al. (2008) Randall S., Nulsen P., Forman W. R., Jones C., Machacek M., Murray S. S., Maughan B., 2008, ApJ, 688, 208
- Roediger et al. (2015) Roediger E. et al., 2015, ApJ, 806, 104
- Ryu et al. (2008) Ryu D., Kang H., Cho J., Das S., 2008, Science, 320, 909
- Ryu et al. (2012) Ryu D., Schleicher D. R. G., Treumann R. A., Tsagas C. G., Widrow L. M., 2012, Science & Space Review, 166, 1
- Schmidt et al. (2015) Schmidt W., Schulz J., Iapichino L., Vazza F., Almgren A. S., 2015, Astronomy and Computing, 9, 49
- Subramanian et al. (2006) Subramanian K., Shukurov A., Haugen N. E. L., 2006, MNRAS, 366, 1437
- Tormen et al. (2004) Tormen G., Moscardini L., Yoshida N., 2004, MNRAS, 350, 1397
- Vazza et al. (2016a) Vazza F., Brüggen M., Wittor D., Gheller C., Eckert D., Stubbe M., 2016a, MNRAS, 459, 70
- Vazza et al. (2017) Vazza F., Jones T. W., Brüggen M., Brunetti G., Gheller C., Porter D., Ryu D., 2017, MNRAS, 464, 210
- Vazza et al. (2016b) Vazza F., Wittor D., Brüggen M., Gheller C., 2016b, Galaxies, 4, 60
- Wittor et al. (2016) Wittor D., Vazza F., Brüggen M., 2016, Galaxies, 4, 71
- Wittor et al. (2017) Wittor D., Vazza F., Brüggen M., 2017, MNRAS, 464, 4448
- Zhuravleva et al. (2016) Zhuravleva I. et al., 2016, MNRAS, 458, 2902
- ZuHone et al. (2013) ZuHone J. A., Markevitch M., Ruszkowski M., Lee D., 2013, ApJ, 762, 69
Appendix A Cluster dynamics
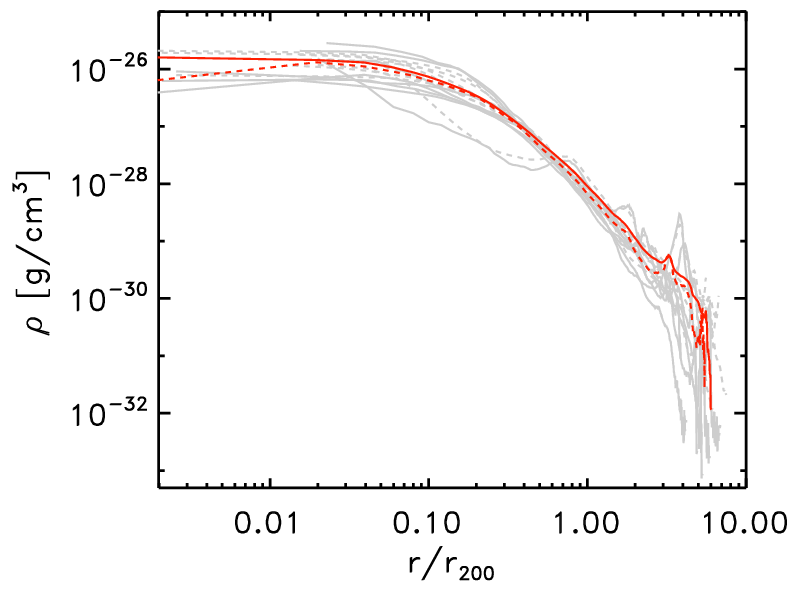
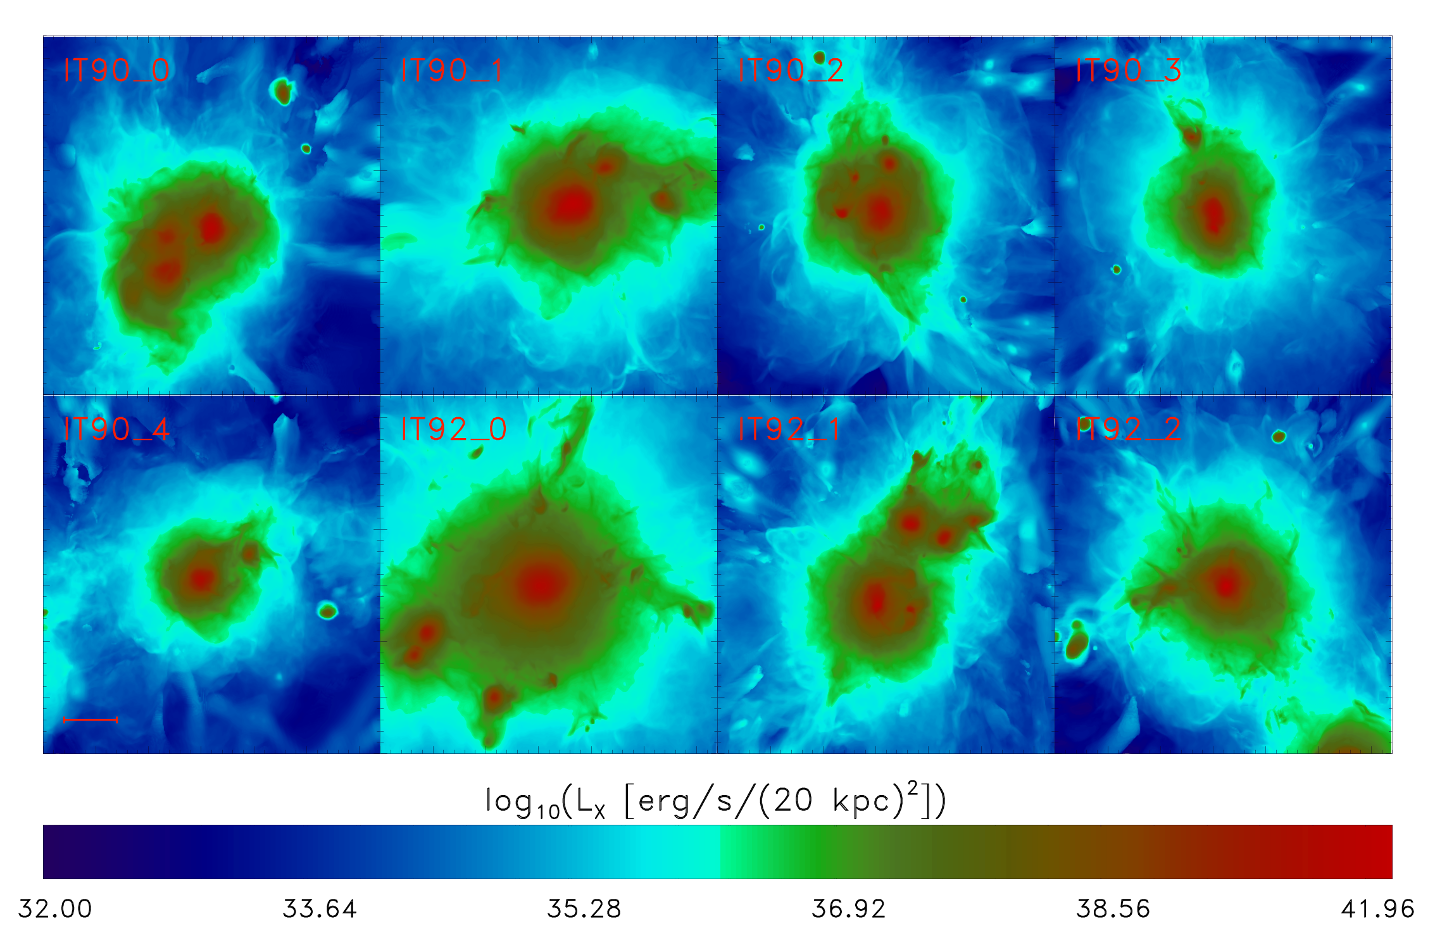
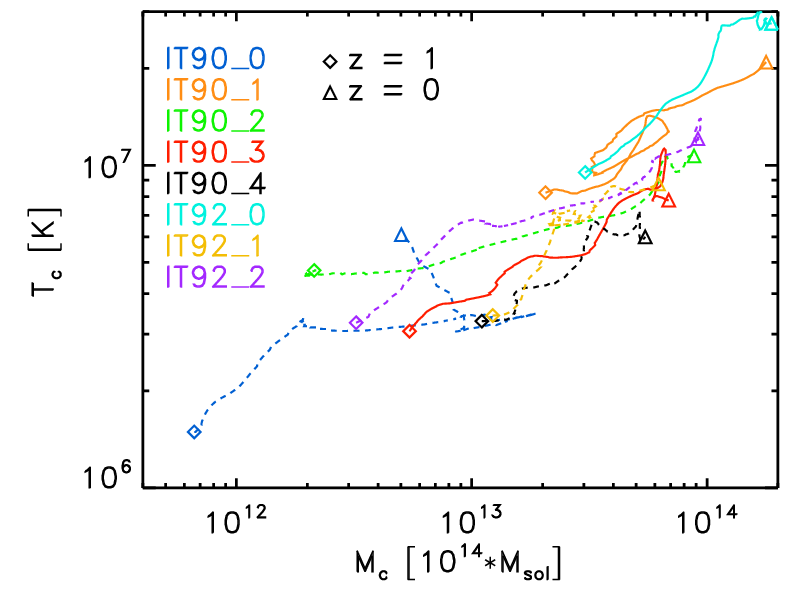
In Fig. 14 we compare the radial density profiles computed with the ENZO and CRaTer data at . In light grey we show the profiles for each cluster, while the red lines show the average of the profiles over all eight clusters. On the whole the tracers are able to retain the shape of the ENZO profile. In Fig. 17 we show the relation of each cluster. The dynamics of the various clusters differ substantially. For example, IT90_3 hosts a major merger at (), while IT90_0 stays very relaxed until the end of the simulation. Some clusters, e.g. at at the end of the simulation IT90_0 or IT92_1 are on the verge of a major merger, thus accreting a lot of mass, while other clusters, e.g. IT90_1 or IT92_0, are only accreting small clumps.
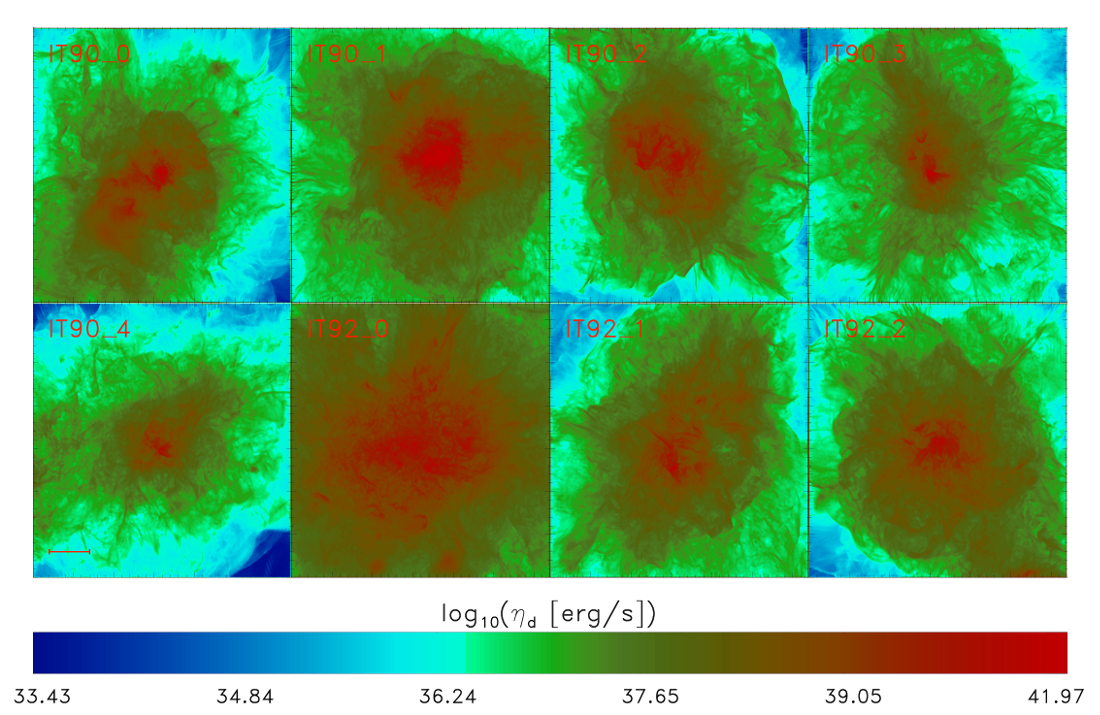
The X-ray surface brightness maps of each cluster are shown in Fig. 15. The cluster centres show a X-ray surface brightness in the range of erg s. We show images of the projected turbulent energy dissipation rate (see Eq. 12) of the clusters in Fig. 16 at () in a volume.
Appendix B Simple models for turbulent dissipation rates
Under the assumption that a turbulent flow with a power law power spectrum can be described as isotropic, solenoidal turbulence, it is possible to express both the kinetic energy dissipation rate, , and the enstrophy dissipation rate, , in forms that do not depend explicitly on the kinematic viscosity, . These provide simple and convenient means to estimate the dissipation of turbulence in our simulations, where the viscosity is not well-defined.
We start from equation 1, which provides an expression for obtained from the curl of the compressible Navier-Stokes equation (Porter et al., 2015). The various physical contributions to ; that is, its source terms, are listed in equations 2 - 6. We focus here on the dissipative source term,
| (14) |
Ignoring the strain tensor element , whose predominant role is inside shocks (Porter et al., 2015), we then look for a simple way to estimate
| (15) |
To obtain estimates of the right hand side of equation (B2) it is useful to utilize the Fourier representation of the turbulent motions. Assuming for simplicity isotropic, Kologorov turbulence in the range [] it has been shown by many authors (e.g., Gotoh et al., 2002; Beresnyak, 2011, and references therein) that the turbulent kinetic energy power spectrum can be be expressed in the Fourier domain as
| (16) |
for , where is the turbulent kinetic energy dissipation rate (per unit mass) and is the so-called Kolmogorov constant. Given that our intent is primarily to establish simple scaling relations, it is not critical whether or not the inner and outer scales in the turbulence are constant across the cluster. The standard expression for viscous kinetic energy dissipation is (e.g., Landau & Lifshitz, 2013)
| (17) |
In terms of the Fourier power spectrum, we can then write
| (18) |
Applying the form for in equation 16 we can then obtain a relation for the viscosity, in terms of quantities defining the turbulent power, namely, , and the range of scales characterizing the turbulence,
| (19) |
Similarly,
| (20) |
where . Using equation 19, equation 20 can be written as
| (21) | |||
In the final expression we assumed . Evidently, the enstrophy dissipation rate is simply , scaled by a factor that is only moderately sensitive to the ratio of the outer and inner turbulent scales, . Our empirical estimate for this relation from the IT903 cluster gives , corresponding to . Combining equations 17 and 19 we can also write the turbulent energy dissipation rate in terms of without explicit reference to the viscosity, ; namely,
| (22) | |||
This is also consistent with our empirical estimate for in the IT903 cluster given in equation 12. Note, further, according to equations 21 and 22 that the ratio with a constant that depends on the ratio of the outer to inner turbulence scales. We note, finally, that even when the turbulence is not truly Kolmogorov, these relations can still provide a useful, if approximate, guide to estimates for the dissipation rates.