HI properties and star formation history of
a fly-by pair of blue compact dwarf galaxies
A fly-by interaction has been suggested to be one of the major explanations for enhanced star formation in blue compact dwarf (BCD) galaxies, yet no direct evidence for this scenario has been found to date. In the Hi Parkes all-sky survey (HIPASS), ESO 435IG 020 and ESO 435 G 016, a BCD pair were found in a common, extended gas envelope of atomic hydrogen, providing an ideal case to test the hypothesis that the starburst in BCDs can be indeed triggered by a fly-by interaction. Using high-resolution data from the Australia Telescope Compact Array (ATCA), we investigated Hi properties and the spectral energy distribution (SED) of the BCD pair to study their interaction and star formation histories. The high-resolution Hi data of both BCDs reveal a number of peculiarities, which are suggestive of tidal perturbation. Meanwhile, 40% of the HIPASS flux is not accounted for in the ATCA observations with no Hi gas bridge found between the two BCDs. Intriguingly, in the residual of the HIPASS and the ATCA data, 10% of the missing flux appears to be located between the two BCDs. While the SED-based age of the most dominant young stellar population is old enough to have originated from the interaction with any neighbors (including the other of the two BCDs), the most recent star formation activity traced by strong H emission in ESO 435IG 020 and the shear motion of gas in ESO 435 G 016, suggest a more recent or current tidal interaction. Based on these and the residual emission between the HIPASS and the ATCA data, we propose an interaction between the two BCDs as the origin of their recently enhanced star formation activity. The shear motion on the gas disk, potentially with re-accretion of the stripped gas, could be responsible for the active star formation in this BCD pair.
Key Words.:
galaxies– individual: ESO 435IG 020, ESO 435 G 016 – galaxies: interactions – galaxies: ISM – galaxies: kinematics and dynamics – galaxies: starbursts1 Introduction
Blue compact dwarf galaxies (BCDs) are low-mass systems characterized by active star formation in compact regions and strong narrow emission lines superposed on a flat stellar continuum (e.g., Salzer, MacAlpine & Boroson, 1989; Kehrig, Telles & Cuisinier, 2004). They were originally considered as either nascent or immature galaxies that had recently undergone intense bursts of star formation (Searle, Sargent & Bagnuolo, 1973). However, it turns out that they also contain stellar populations older than 1 Gyr as shown by a number of optical and near-IR studies (Thuan, 1983; Papaderos et al., 1996; Aloisi, Tosi & Greggio, 1999), implying that BCDs are little galaxy fossils where starbursts have been recently triggered.
The low metallicity of BCDs (; Kunth & Östlin, 2000) also suggests that they have not always maintained their current star formation rate (0.1 yr-1; Hopkins, Schulte-Ladbeck & Drozdovsky, 2002). Indeed, the neutral hydrogen gas mass found in very gas-rich BCDs is typically (Thuan & Martin, 1981), which will require 1 Gyr to be consumed entirely if they keep up with the current star formation rate (Thuan, 1983). Instead, a number of models have shown that dwarf galaxies may go through a “BCD phase” due to the gas infall (e.g., Verbeke et al., 2014), merging with another dwarf galaxy (e.g., Di Matteo et al., 2007; Bekki, 2008; Cloet-Osselaer et al., 2014), or fly-by interaction (e.g., Icke, 1985; Pustilnik et al., 2001).
Those scenarios have been also tested observationally in a wide range of wavelengths from optical through to radio. For example, merging signatures or the presence of companions have been confirmed in H (e.g., Östlin et al., 1999; Mendez & Esteban, 2000; López-Sánchez & Esteban, 2009) and deep optical imaging studies (e.g., Rich et al., 2012). In addition, Hi imaging has been particularly useful in finding the evidence for tidal interactions in BCDs (e.g., van Zee, Skillman & Salzer, 1998; Chengalur et al., 2006; Ekta, Chengalur & Pustilnik, 2006; Lelli et al., 2012; López-Sánchez et al., 2012; Nidever et al., 2013). Approximately 57% of BCDs have been found with gas-rich but optically faint dwarf nearby companions (Taylor, 1997), and the fraction increases up to 80% when BCDs with signatures of tidal interaction including merging are included (Pustilnik et al., 2001). All these observations support the hypothesis that the bursts of star formation in BCDs can be induced externally.
On the other hand, there are cases of BCD pairs with separation larger than a few tens kpc such as UM 461/462 (68 kpc; Taylor et al., 1995), ESO 338-004/004B (72 kpc; Cannon et al., 2004), ESO 400-043/043B (70 kpc; Östlin et al., 1999, 2001), and IRAS 08339+6517/2MASX J08380769+6508579 (56 kpc; Cannon et al., 2004). For those BCD pairs, it is more difficult to prove that the two galaxies are or have been tidally interacting with each other. And even if this is so, how their ”fly-by” interaction could lead to the recent active star formation is still questionable. Considering that there is quite a high fraction of BCD galaxies that are not in the process of merging (60%, Pustilnik et al., 2001; Sung et al., 2002), it is important to show that they can indeed originate from fly-by interactions.
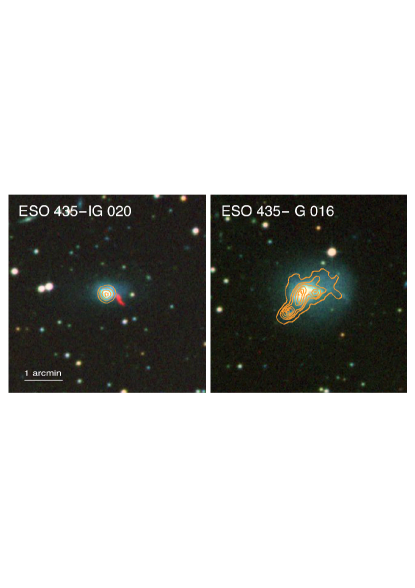
A pair of BCDs, ESO 435IG 020 and ESO 435 G 016, separated by 80 kpc in projection at similar distances (9 Mpc; Kennicutt et al., 2008), is one such example. Based on the fact that both galaxies appear to be highly disturbed (Mendez & Esteban, 2000; Rothberg & Joseph, 2004) in the optical observations, Sung et al. (2002) have classified this pair as “detached interacting BCDs”, proposing that their peculiar optical morphology originates from tidal interaction with each other. Intriguingly, a large neutral hydrogen gas envelope has been revealed in the Hi Parkes all sky survey (HIPASS; Meyer et al., 2004), which is found to be covering both galaxies (see Figure 1). Their optical morphologies and the common Hi envelope make this pair a good candidate for the case of a BCD pair with fly-by interaction origin.
Considering the distance between the two galaxies, however, it is difficult to conclude whether Hi gas associated with individual galaxies simply appears to be connected due to the large HIPASS beam, which is comparable to the separation of the pair on the sky, or whether they are indeed an interacting pair. In order to test the hypothesis that 1) these two dwarfs are going (or have gone) through a fly-by interaction, and 2) their interaction is the cause of their recent star formation activity, we followed up this region in Hi with a higher resolution using the Australia Telescope Compact Array (ATCA). In this work, we probe detailed Hi morphology and kinematics of the ESO 435IG 020/016 pair and their star formation properties to investigate the role of a fly-by interaction as one of the important origins for quite a large fraction of the BCD population including our targets.
This paper is organized as follows. In Section 2, general properties of ESO 435 G 016/020 pair are introduced. In Section 3, the ATCA Hi observation and data reduction are described. In Section 4, the Hi morphology and kinematics of individual galaxies are presented. In Section 5, the presence of intergalactic Hi between the pair is inspected. Also, the star formation and interaction histories of the pair are discussed. In Section 6, we summarize and conclude.

| Galaxy | R.A. | DEC. | Distance | cz | P.A. | ||||
|---|---|---|---|---|---|---|---|---|---|
| (J2000) | (J2000) | Mpc | km s-1 | mag | arcsec | (/)25 | deg | ||
| ESO 435IG 020 | 9.0 | 971 | 0.26 | 49.90 | 0.71 | 91.7 | |||
| ESO 435 G 016 | 9.1 | 980 | 2.34 | 99.60 | 0.68 | 117 |
Notes. Information on the galaxy coordinates (R.A., DEC.) and radial velocities comes from de Vaucouleurs et al. (1991, RC3). band luminosities, stellar masses, optical extents, and distances are taken from Kennicutt et al. (2008), and Fisher & Drory (2011). Distances are corrected for the relative motion to the centroid of the Local Group (Kennicutt et al., 2008).
2 ESO 435IG 020 and ESO 435 G 016
Both galaxies are small (a few kpc in diameter) and faint ( mag) with strong, sharp, and narrow emission lines on a blue continuum, and both are classified as blue compact dwarf (BCD) galaxies (Sung et al., 2002). They are found at a similar redshift (km s-1) with an angular separation of arcmin, which corresponds to 80 kpc, adopting a 9 Mpc distance to the pair (Kennicutt et al., 2008).
ESO 435IG 020 has a compact core surrounded by an asymmetric, elongated stellar envelope. It was classified as an “interacting” system in the ESO atlas, as hinted by the catalog nomenclature (i.e., IG=interacting galaxy or galaxies Holmberg et al., 1974). Doublier et al. (1999) also found its brightness distribution to follow rather than an exponential profile, which is suggestive of (partial) violent relaxation after merging.
ESO 435 G 016 also has a diffuse stellar envelope which is off-center from the bright component. This galaxy has two sharp stellar tails; one inside the diffuse component in the west and a more distinctive tail pointing southeast. Based on these features, Rothberg & Joseph (2004) identified this system as a merger remnant (it is referred to as AM 0956282 in their work), although it was not classified as “interacting” in the ESO catalog (Holmberg et al., 1974). However, this galaxy is distinct from the rest of their sample in size and luminosity. It is the smallest among the sample of Rothberg & Joseph (2004), being less luminous by 1.75 mag compared to the next faint galaxy in their sample, and fainter by 3 mag or more than the rest of the sample. Therefore, even if ESO 435 G 016 is a merger remnant, it is likely to be the result of merging between tiny galaxies like ESO 435IG 020, which is even smaller.
Alternatively, as Sung et al. (2002) suggested, the peculiarities of ESO 435IG 020 and ESO 435 G 016 could be the result of tidal perturbation with each other. Sung et al. (2002) also proposed that fly-by interaction between the two galaxies could be the origin of their recent bursts of star formation; we aim to investigate this possibility in this work. General properties of the pair can be found in Table 1.
3 ATCA observation and data reduction
The Hi observations were conducted on March 27 and 28 2002 with the ATCA in EW367 array configuration (project ID of C1024). The ATCA primary beam is 33.1 arcmin at 1416 MHz, which is comparable to the angular distance between the pair of galaxies of 30.3 arcmin. With a single pointing, the sensitivity at the locations of the galaxies hence drops by a factor of 1.8, and therefore we had two extra pointings centered on each galaxy in order to keep the desired sensitivity toward the pair. The observing frequency was centered on 1416 MHz with a total bandwidth of 8 MHz, which is configured into 512 channels, yielding a channel width of 3.3 km s-1.
We calibrated the data with a software package, Miriad (Sault, Teuben, & Wright, 1995). For flux and bandpass calibration, PKS 1934-638 (14.87 Jy at the observing frequency) was used. As a phase calibrator, we observed PKS 1015-314 every 45 min during our observations. Before making an Hi cube, the continuum was subtracted by applying a linear fit to the data for a range of line free channels at both ends of the band. A final Hi cube was generated using an AIPS111Astronomical Image Processing System, http://www.aips.nrao.edu command IMAGR. In order to maximize the sensitivity while keeping a reasonable synthesized beam size and shape, we set robust=0 in IMAGR, the middle of natural and uniform weighting scheme (Briggs, 1995). Three points were stitched together by FLATN and corrected for the sensitivity loss corresponding to the primary beam shape. The final cube was smoothed to 5 km s-1 of velocity resolution to achieve a higher signal-to-noise ratio.
| Galaxy | ||||||||
|---|---|---|---|---|---|---|---|---|
| – arcsec – | Jy km s-1 | —– km s-1 —– | ||||||
| ESO 435IG 020 | 7 | 16 | 5.710.19 | 1.11 | 100.1 | 63.4 | 973.0 (974.0) | 0.38 |
| ESO 435 G 016 | 5 | 8 | 15.970.10 | 3.12 | 133.9 | 93.7 | 973.2 (974.9) | 0.52 |
Notes. The 2nd and 3rd columns ( and ) indicate the offset between the optical center and the peak of the Hi emission. For Hi mass, the distances in Table 1 have been applied. The Hi velocity defined within the symmetric part of the gas disk is given within the parenthesis.
The total intensity Hi map and the intensity weighted velocity field were produced using the task MOMNT in AIPS. It allows us to create a smoothed mask which helps to maximize the signal-to-noise ratio in the integrated map. For a mask, we adopted Gaussian and Hanning smoothing schemes in the spatial and velocity domains, respectively.
4 Results
4.1 Integrated HI flux
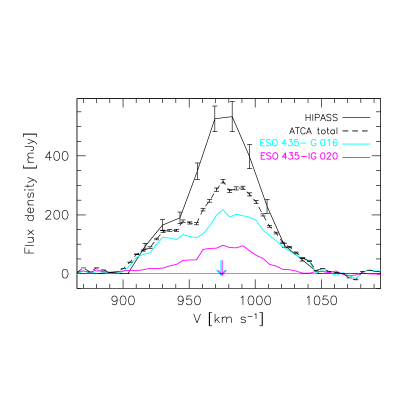
In the ATCA data, the pair is resolved into separate structures with the total Hi flux of () Jy km s-1 and () Jy km s-1 associated with ESO 435 G 016 and ESO 435IG 020, respectively. For ESO 435 G 016, the ATCA flux is only 58% of the previous single-dish measurement ( Jy km s-1, Parkes telescope; Koribalski et al., 2004), while for ESO 435IG 020, we recover all the single-dish flux ( Jy km s-1, Nançay telescope; Theureau et al., 2005). The Hi profiles from our ATCA observations are compared with the HIPASS Hi spectrum in Figure 2. The total ATCA flux of the pair is % of the HIPASS flux ( Jy km s-1).
Indeed, the Hi column density sensitivity of our ATCA observation is not quite comparable to the HIPASS sensitivity (HIPASS versus ATCA cm-2 vs. cm-2 in 3 for km s-1), and hence most faint emission is likely to be missed from the ATCA data. In addition, the largest angular structure detectable using the ATCA EW367 at this wavelength is arcmin or so, while the Hi envelope covering the pair found in the HIPASS image is much larger in extent ( arcmin), and the very extended features could have been resolved out. The presence of intergalactic gas is tested and further discussed in Section 5.
4.2 High resolution HI morphology and kinematics
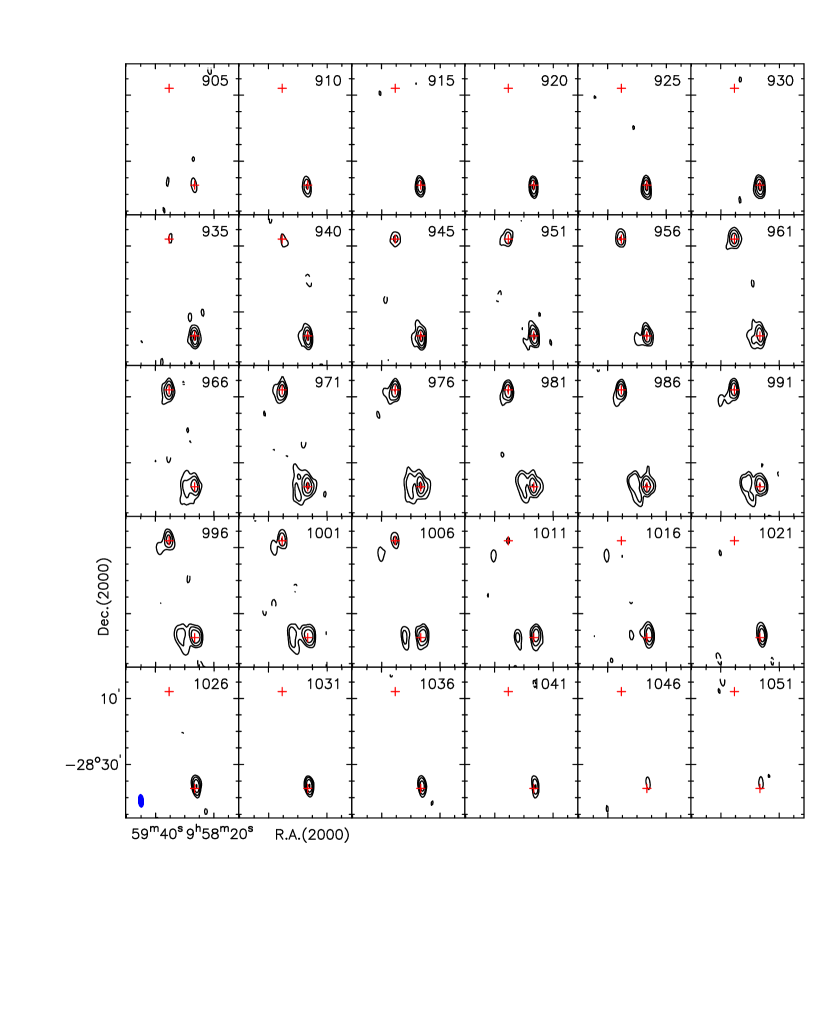
The ATCA Hi channel maps and the intensity maps are shown in Figures 3 and 4. In the high resolution ATCA imaging data, we do not find any continuous Hi gas emission between the pair. However, resolved structures reveal detailed features associated with individual galaxies.
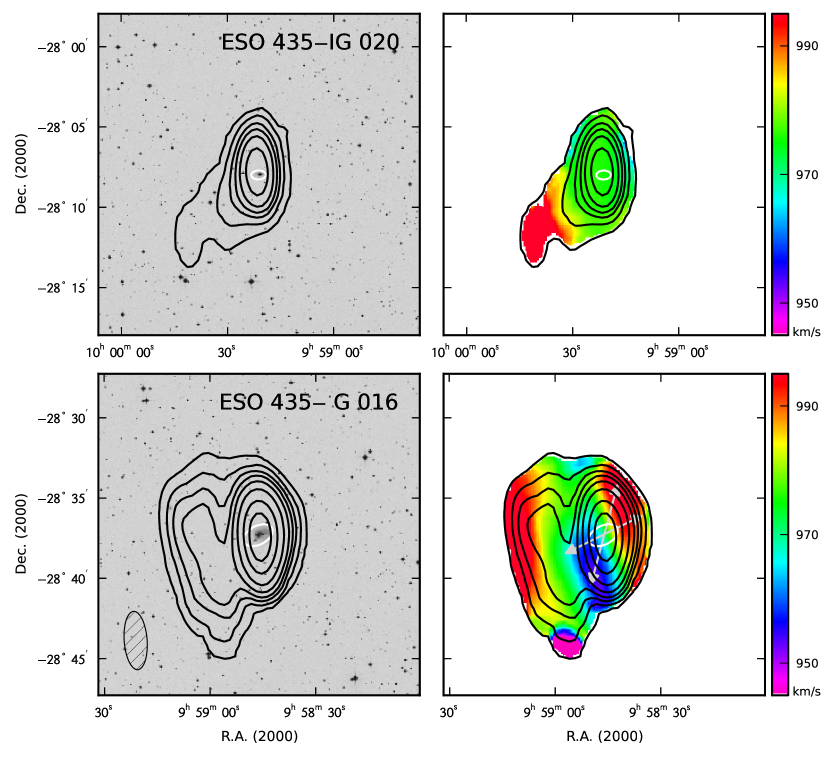
Both galaxies are found with a very extended gas disk. The largest feature is more extended than , where is the optical size measured at 25mag arcsec-2 in band (de Vaucouleurs et al., 1991, RC3). This relative extent is comparable to those of BCDs located in low-density environments (e.g., van Zee, Skillman & Salzer, 1998). The Hi gas is quite symmetric out to a few times of , with the peak coinciding with the optical center within kpc. In the outskirts of the gas disk however, the gas morphology becomes highly irregular and asymmetric. ESO 435IG 020 shows a long gas tail of kpc, pointing to the southeast. The Hi flux along the tail is measured to be % of the total flux of this system. In the case of ESO 435 G 016, a very extended structure is found mostly on the east side of the galaxy, with a projected size of kpc2. The local Hi peak in this feature is cm-2, well below the star formation threshold (Kennicutt, 1998a; Bigiel, 2008). The Hi flux outside the symmetric gas disk is % of the total flux measured from this galaxy.
The total Hi mass of individual systems is calculated using the following expression,
| (1) |
where is the integrated Hi flux in Jy km s-1 and is the distance to the galaxy in Mpc. We adopt a distance of 9.0 Mpc and 9.1 Mpc for ESO 435IG 020 and ESO 435 G 016, respectively (Kennicutt et al., 2008). The total Hi masses measured from the ATCA data are and , yielding of 0.38 and 0.52 for ESO 435IG 020 and ESO 435 G 016. These are comparable to found in the BCD population (Huchtmeier et al., 2007), but larger than normal spirals by a few factors (e.g., for the entire sample of the Hi Nearby Galaxy Survey (THINGS), and smaller when dwarf galaxies are excluded; Walter et al., 2008).
The gas peculiarities of the pair are also seen in their kinematics. At this velocity resolution, the Hi disk of ESO 435IG 020 barely shows rotation across the morphologically symmetric part. Along the gas tail however, the velocity changes quite steeply, exceeding the velocity range found in the main Hi disk as shown in Figure 4. The tail is largely responsible for the linewidth of this galaxy.
Meanwhile, ESO 435 G 016 shows clear rotation across the stellar disk, and out to a few optical radii. Within the stellar disk, the kinematical major axis measured using the tilted ring model is 112 degrees in PA, being more or less consistent with the optically defined major axis (117 degrees) but with the Hi peak offset from the optical center (see Table 2). Beyond the optical disk however, the velocity structure becomes warped, with the outer disk PA deviating from the inner disk by 50 degrees (PA160 degrees). Across the eastern extension, the velocity changes by km s-1, with the same velocity gradient as the receding side as well as the tail of ESO 435IG 020, as seen in Figure 4. Unlike the tail of the other galaxy however, this extension does not exceed the velocity coverage of the main Hi disk. If the gas is on its way out, the stripping may have started recently and the gas has not been accelerated more than the escape velocity of the galaxy. On the other hand, if the gas is of external origin, the accretion might have been going for a while to require a similar velocity range to the main gas disk. Alternatively, the gas which had been stripped from the past interaction might be currently falling back.
The Hi linewidths are measured at the velocities where the Hi flux drops to 20% and 50% of the peak in Hi profile for each galaxy (Figure 2). Neither has a linewidth measured at 50% of the peak larger than 150 km s-1, implying that these galaxies are unlikely to have gone through a major merging recently (Sung et al., 2002). However, this still does not rule out the possibility of minor merging or tidal perturbation, not only by other neighbors but also by each other.
Hi measurements including Hi mass, linewidth, and the velocity can be found in Table 2. The Hi velocity has been measured both across the entire Hi disk, and within the main disk of symmetric morphology.
5 Discussion
5.1 Intergalactic gas between the pair
In spite of a number of morphological and kinematical peculiarities in Hi associated with both galaxies, we do not find any Hi gas emission between the pair in the ATCA data down to cm-2 at the 3 level (assuming the linewidth of 50 km s-1). Then the question is whether the Hi gas bridge revealed by the HIPASS survey is real, or is it simply the HIPASS resolution which makes them appear to be connected. In fact, the total ATCA flux is only 61% of the HIPASS flux, and it is possible that large-scale structures with low density between the pair have been resolved out in the ATCA observations. If the Hi gas between the pair found in the HIPASS data is indeed real rather than the results of an overlap between two unresolved gas blobs, we might be able to extract the intergalactic Hi gas from the HIPASS data.
In order to verify the presence of Hi gas between the pair, and also to assess its flux, we have compared the HIPASS and the ATCA image in the same resolution as the HIPASS data, using the following procedure. First, the ATCA image was convolved to the same resolution as the HIPASS image, from 218 85 arcsec2 to 930 930 arcsec2. Then the convolved ATCA image was re-gridded to the same cell size as the HIPASS image from 20 arcsec to 240 arcsec.
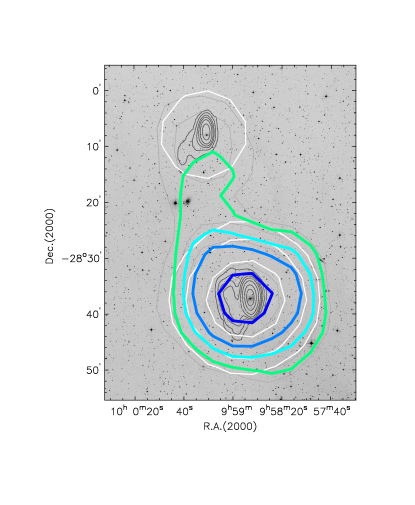
The result is presented in Figure 5. The Hi emission centered on ESO 435IG 020 in the convolved ATCA data is offset by 2.4 arcmin from the nearest local peak around this galaxy in the HIPASS data. Considering that the positional accuracy of the HIPASS survey is 1 arcmin or so (Zwaan et al., 2004), this offset is likely to be real. However, as previously mentioned, the total flux measured from the ATCA data is consistent with the flux from the single-dish measurement, and hence the residual around this galaxy is below 1 of the residual image.
Instead, most of the missing flux is found around ESO 435 G 016, as expected from the comparison of previous single-dish measurements and our ATCA fluxes of individual galaxies (see Section 4.1). The total residual flux that is likely to be associated with this galaxy (i.e., Dec. 28∘ 24′) accounts for 89% of the missing flux. Intriguingly, the remaining 10% is found in the intergalactic space between the lowest contours around the two galaxies (28∘ 24′ Dec. 28∘ 15′). Although the net residual emission around ESO 435IG 020 is insignificant, the offset of the HIPASS peak to the south from that of the ATCA data also supports the possibility that the intergalactic Hi gas between the two galaxies is likely to be real.
5.2 Star formation histories
We study the star formation properties of this pair of BCDs in this section using archival optical, ultraviolet, and infrared observations. The far-ultraviolet (FUV) and near-ultraviolet (NUV) imaging data of our targets are obtained from the Galaxy Evolution Explorer (GALEX) UV satellite telescope’s archive. Fortunately, there exists deep GALEX observations for this pair of galaxies. The integrated colors (corrected for Galactic extinction) for ESO 435 G 016 and ESO 435IG 020 are 0.65 and 0.43 in AB magnitudes, respectively. Mid- and far-infrared measurements are obtained using archival observations from the Spitzer and Akari space telescopes. The multi-wavelength flux density measurements used in this section can be found in Table 3. Figure 6 overlays the FUV observations (orange contours) on the optical 3-color image derived from SuperCOSMOS (Hambly et al., 2001).
| ESO 435IG 020 | ||
| Band | Flux density (Jy) or luminosity | Reference |
| FUV (1515 Å) | 1 | |
| NUV (2273 Å) | 1 | |
| H (luminosity) | (ergs s-1) | 2 |
| 3 | ||
| 3 | ||
| 4 | ||
| 4 | ||
| 4 | ||
| 3.6 m | 5 | |
| 4.5 m | 5 | |
| 5.6 m | 5 | |
| 8.0 m | 5 | |
| 24 m | 5 | |
| 70 m | 5 | |
| 160 m | 5 | |
| ESO 435 G 016 | ||
| FUV (1515 Å) | 1 | |
| NUV (2273 Å) | 1 | |
| 6 | ||
| 6 | ||
| 4 | ||
| 4 | ||
| 4 | ||
| 65 m | 3.79 () | 7 |
| 90 m | 2.13 () | 7 |
| 140 m | 4.55 () | 7 |
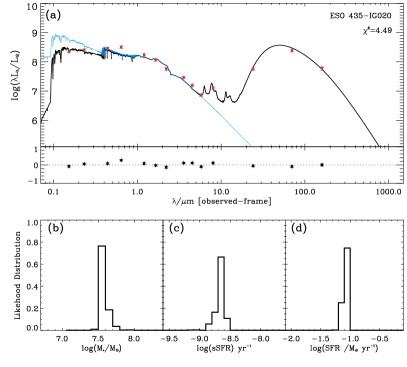
Due to the complex evolutionary history for this pair of BCDs, single stellar population models are insufficient for characterizing the star formation history of such galaxies. As such, we approximate and constrain the star formation history by fitting the observed spectral energy distributions (SED) from the far-ultraviolet to the far-infrared to model star formation histories using the Multi-wavelength Analysis of Galaxy Physical Properties software (MAGPHYS; da Cunha et al., 2008).
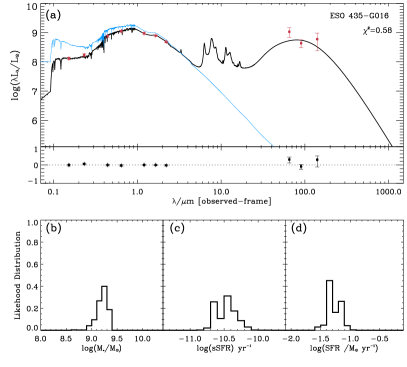
The observed multi-wavelength SEDs of ESO 435IG 020 and ESO 435 G 016 are shown as red points in panels (a) of Figure 7. For ESO 435IG 020, the greatest difference between the observed SED and the model fit occurs in the band. As can be seen on the left of Figure 7, the observed band flux density is greater than that from the model. We attribute this discrepancy in the band to the strong H emission that has been observed in this galaxy. Previous studies (e.g., Kennicutt et al., 2008) find the H luminosity to be 1.2 1040 ergs s-1. According to the best fitting MAGPHYS model, ESO 435IG 020 is consistent with a very low stellar mass dwarf galaxy that is currently forming stars with high efficiency as indicated by the sSFR value of 4.5 10-8 yr-1. For comparison, the average sSFR value for nearby star-forming galaxies is 3.2 10-9 yr-1 (Wong et al., 2016). Therefore, ESO 435IG 020 is more efficient at forming stars by nearly an order of magnitude relative to other star-forming nearby galaxies. The model finds that it has been approximately 1.7 Gyr since the last burst of star formation in this galaxy. Similarly, the Hi-normalized star formation efficiency (/) for ESO 435IG 020 is approximately four times greater than the average found in nearby star-forming galaxies (Wong et al., 2016).
Conversely, the best fit models find that ESO 435 G 016 is likely to be 50 times more massive in stellar mass. ESO 435 G 016 has an average star formation rate over the last 10 Myr and 2 Gyr that are factors of 2.3 and 4.2 less than that for ESO 435IG 020, respectively. The best fit model suggests that it has been 5.3 Gyr since the last burst of star formation ended for ESO 435 G 016. The best fit model finds a median sSFR that is a factor of 2.7 less than the average nearby star-forming galaxy of similar stellar mass. The for ESO 435 G 016 is very similar to the average value found for nearby star-forming galaxies (Wong et al., 2016).
Further constraints on the star formation history on shorter timescales (a few Myr) are possible via the comparison of H to FUV observations. However, archival H observations are not available for ESO 435 G 016. As such, we can only directly confirm that there is a significant population of very young stars (10 Myr) in ESO 435IG 020. This is consistent with the strong “bursty” star formation history that we found for ESO 435IG 020 via SED modeling. Future H observations of ESO 435 G 016 will be useful for estimating its star formation history on shorter timescales. However, we can already tell from the SED modeling and sSFR that it is less bursty and less intense than that of ESO 435IG 020. Nevertheless, what makes ESO 435 G 016 still interesting is its kinematical structures which indicate that this system is currently under the influence of the tidal force - potentially the origin of its recent active star formation, as described in the following section.
5.3 Interaction history
As argued in 5.1, the presence of intergalactic Hi gas between the pair is somewhat likely. Also, as seen in the high-resolution ATCA data, both galaxies reveal a number of peculiarities in their Hi distribution as well as in their optical morphology. All these strongly suggest that they have been tidally disturbed, potentially due to each other but also possibly by other neighbors.
In order to investigate the feasibility of tidal interaction with other neighboring galaxies, we probe the environment around the pair of 0.5 Mpc radius within 300 km s-1, that is, a comparable size and velocity coverage of a typical galaxy group like our own. Within given ranges, there are 12 optically identified galaxies and several galaxy groups. Both ESO 435IG 020 and ESO 435 G 016 are classified as the members of the NGC 3056 triplet, which is located in the outskirts of the NGC 3175 group (Makarov & Karachentsev, 2009, 2011). Among these, we find only two sizeable galaxies that could have tidally perturbed the pair, NGC 3056 and NGC 3113. In band they are brighter than ESO 435 G 016 by 0.9 mag and 1.3 mag, respectivey (Doyle et al., 2005; Springob et al., 2007).
The distances from NGC 3056 and NGC 3113 to the center of the pair are kpc and 196 kpc, assuming the same distance to the pair, that is, 9 Mpc. Adopting 300 km s-1, a typical galaxy speed in groups, the crossing time between the pair and these two relatively massive galaxies is Myr or so. This is shorter than the timescale for the last burst of star formation which is likely to be responsible for the dominant young stellar population in both galaxies ( 1 Gyr). This implies that any of these neighbors is potentially responsible for the last burst of star formation, if it was caused by tidal interaction.
However, for a crossing time between these neighbors and our BCD galaxies to be comparable to the age of the youngest stellar population of ESO 435IG 020 that is traced by H, they should be moving with a relative velocity of an order of km s-1, which is unlikely in this environment. Therefore any of the close neighbors, including the two most massive galaxies, are unlikely to be the most recent active star formation in our BCD galaxies.
Instead, the interaction between the pair seems to be a more feasible scenario. Assuming the same velocity as their neighbors, the crossing time between these two BCD galaxies is 260 Myr, still too large to explain their recent active star formation. If the past encounter between the BCD pair was a fly-by however, its impact might have been just strong enough to pull out the materials from the outer disk, mostly gas, without triggering strong starbursts in the inner region of the galaxies. Since the close approach, some of the tidally stripped gas may have been recaptured (e.g., Duc & Renaud, 2013). Then stars can be actively formed by the reaccreted gas directly funneling into the galaxy than by generating shocks into the halo gas of the host galaxy, which is more likely for low mass systems (e.g., Benson & Bower, 2010).
At the same time, this accretion-induced star formation activity can be aided by the torque and shear on the gas. Indeed, the kinematical structure of ESO 435 G 016’s Hi disk is quite intriguing. While the position angle (PA) of the inner Hi is more or less consistent with the optically defined position angle (PA), the angle connecting the local velocity maxima in the receding and approaching side appears to be tilted counterclockwise from the inner PA. In order to measure the offset more quantitatively, we modeled a cube of a rotating disk using GALMOD, a package implemented in GIPSY222Groningen Image Processing System,
https://www.astro.rug.nl/gipsy/.
As a result, the modeled kinematic structure based on the optical morphology in the inner region of the main Hi disk agrees well with the observed velocity field, as indicated by an ellipse and a gray line along the optical major axis in Figure 4. In the outer disk however, a second rotating component is present along the axis tilted counterclockwise from the inner kinematic axis. The position angle of the second kinematic component measured from the model, PA160∘, well matches the axis connecting the local velocity maxima in the outer Hi disk, as shown by the second gray line in Figure 4.
The offset between the inner and the outer kinematic axes might have been caused by the interaction with ESO 435IG 020, which could induce the shear. The speculation that the outer gas disk is likely to have been tidally dragged counterclockwise is also supported by a recent ALMA (Atacama Large Millimeter Array) observation by Ueda et al. (2014, AM 0956282 in their sample). ESO 435 G 016 is detected in 12CO () in the inner kpc radius. Intriguingly, the CO disk also has two position angles. The outer part of the CO disk, which is composed of the northwest extent and the southeast cloud, is more tilted to the counterclockwise in comparison to the inner CO disk. Especially cool gas components are expected to be influenced more effectively by torque due to their low velocity dispersion and collisional dynamics (e.g., Bournaud, 2011). Hence the fact that the kinematical axis of the outer CO disk is rotated counterclockwise like the outer Hi disk, is strongly suggestive of the presence of such force in this galaxy. Ueda et al. (2014) also propose that the southeast CO cloud is likely to have been ejected from the main molecular gas disk due to the interaction.
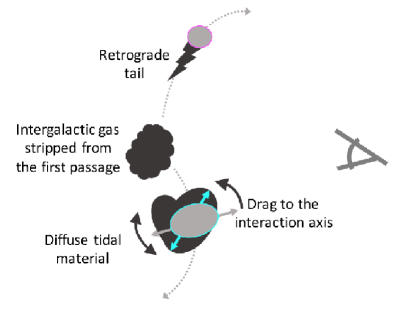
In Figure 8 we illustrate a possible interaction scenario of the pair based on all the observational evidence and the environment of the pair. In this scenario, the pair have gone through a close encounter a while ago ( a few 100 Myr ago assuming typical group environment), which tidally stripped gas from the outer region. The intergalactic Hi hinted at by the HIPASS data must be part of the stripped gas from the first encounter.
It is difficult to judge whether the orbit is closed or not, but if ESO 435IG 020’s tail was formed via fly-by interaction between the pair, its direction suggests that the two galaxies are in situ moving apart based on some simulations where tidal materials are found to form in retrograde after the first encounter in fly-by interactions (e.g., Pawlowski, Kroupa & de Boer, 2011). Likewise it is hard to tell whether the tail of ESO 435IG 020 and ESO 435 G 016’s extension are being stripped or reaccreted. However, accretion is more feasible if the two galaxies are currently moving away, and their recent bursts of star formation can be also more naturally explained.
Even if the two galaxies are moving apart as suggested by ESO 435IG 020’s tail, the velocity shear across the main Hi disk implies that the two galaxies are still under the influence of each other. The CO disk also shows at least two kinematic axes, with the outer position angle rotated in the same direction as the outer Hi kinematic axis, supporting the presence of torque in the gas disk. Although the shear is less visible in ESO 435IG 020 due to its compact structure and its nature that is less rotationally supported compared to ESO 435 G 016, it must be also experiencing the torque as the interaction counterpart of ESO 435 G 016. This shear could be responsible for recent enhanced star formation activity in both galaxies.
Lastly, it is worth mentioning that we cannot completely rule out the merging between gas-rich dwarf galaxies as the origin of the recently enhanced star formation in these BCDs. A nucleated core and diffuse structures do well agree with BCDs originating from the merging of gas-rich galaxies simulated by Bekki (2008). In Bekki (2008)’s simulation, however, only the old stars with an age 1 Gyr and with gas form diffuse low-surface brightness structures, and new stars mostly form in the central region after merging. However, this is not the case of our pair as shown by the FUV image in Figure 6, especially of ESO 435 G 016, where the internal structures can be better seen.
6 Summary and Conclusion
We analyzed the Hi imaging data of a BCD pair, ESO 435IG 020 and ESO 435 G 016, obtained using the ATCA. The goal was to find the evidence for fly-by interaction between the pair as suggested by a large Hi envelope covering both that is found by the HIPASS, and to investigate the role of tidal interaction in triggering recent active star formation in the pair.
From high resolution Hi imaging data, we find clear indications that both galaxies have been tidally disturbed. However, intergalactic Hi gas is not detected with the sensitivity limit of the ATCA observaions, which has recovered only 61% of the HIPASS Hi flux. Considering typical galaxy speeds in groups, there are only two candidates which are massive enough to gravitationally perturb the pair in their neighborhood. The crossing time between the BCD pair and the neighbors within a radius of a comparable size to typical galaxy groups is short enough to explain the mean age of the dominant young stellar population ( 1 Gyr), while it is still too large to be responsible for the most recent active star formation event in our BCDs.
Intriguingly, the residual emission between the HIPASS and the ATCA Hi data is mainly found between the two galaxies. In addition, we found kinematical evidence for the shear on the gas disk. The second kinematic axis underlying the main Hi disk of ESO 435 G 016 indicates that the gas component is under the influence of torque, which is also supported by the kinematics of its 12CO () gas disk.
Based on our analysis, we conclude that the interaction between the two galaxies is responsible for their Hi and optical peculiarities as well as the recent star formation activities. During the most recent encounter, the pair could have lost Hi gas from the outer disk. Enhancements in recent star formation on timescales of 10 Myr might have been triggered by the reaccretion of the gas that had been stripped during the past encounter and/or the shear on the disk caused by each other.
In this study of a BCD pair, we have provided observational evidence that star formation can be enhanced by fly-by interaction between galaxies without merging. If this well-separated pair of BCDs are representative of BCDs, we propose that fly-by interactions could be one of the most important origins of BCDs. Our suggestion can explain the observation that a high fraction of BCDs are not in the merging process (60%, e.g., Sung et al., 2002).
Acknowledgements.
We are grateful to the anonymous referee for his/her valuable comments and useful suggestions. Support for this work was provided by the National Research Foundation of Korea to the Center for Galaxy Evolution Research (No. 2010-0027910) and Science Fellowship of POSCO TJ Park Foundation. This work has been also supported by NRF grant No. 2015R1D1A1A01060516. Parts of this research were conducted by the Australian Research Council Centre of Excellence for All-sky Astrophysics (CAASTRO), through project number CE110001020. We are grateful to Brbel Koribalski for her useful suggestions and comments. The Australia Telescope Compact Array is part of the Australia Telescope National Facility which is funded by the Australian Government for operation as a National Facility managed by CSIRO. This work has made use of the NASA/IPAC Extragalactic Database (NED) which is operated by the Jet Propulsion Laboratory, California Institute of Technology, under contract with the National Aeronautics and Space Administration. We thank Elisabete da Cunha and Simon Driver for their helpful guidance with MAGPHYS.References
- Aloisi, Tosi & Greggio (1999) Aloisi, A., Tosi, M., & Greggio, L. 1999, AJ, 118, 302
- Bekki (2008) Bekki, K. 2008, MNRAS, 388, L10
- Bell (2003) Bell, E., ApJ, 586, 794
- Benson & Bower (2010) Benson, A. J., & Bower, R. 2010, arXiv:1004.1162
- Bigiel (2008) Bigiel, F., Leroy, A., Walter, F., Brinks, E., de Blok, W. J. G., Madore, B., & Thornley, M. D. 2008, AJ, 136, 2846
- Bournaud (2011) Bournaud, F. 2011, EAS Publ. Ser., 51, 107
- Briggs (1995) Briggs, D. S. 1995, PhD thesis , New Mexico Institute of Mining and Technology, Socorro, NM
- Cannon et al. (2004) Cannon, J. M., Skillman, D., Kunth, D., Mas-Hesse, M., Östlin, G., & Petrosian, A. 2004, ApJ, 608, 768
- Chengalur et al. (2006) Chengalur, J. N., Pustilnik, S. A., Martin, J. -M., & Kniazev, A.Y. 2006, MNRAS, 371, 1849
- Cloet-Osselaer et al. (2014) Cloet-Osselaer, A., De Rijcke, S., Vandenbroucke, B., Schroyen, J., Koleva, M., & Verbeke, R. 2014, MNRAS, 442, 2909
- Condon, Cotton & Broderick (2002) Condon, J. J., Cotton, W. D., & Broderick, J. J. 2002, AJ, 124, 675
- Cornwell (1988) Cornwell, T. J. 1988, A&A, 202, 316
- da Cunha et al. (2008) da Cunha, E., Charlot, S., & Elbaz, D. 2008, MNRAS, 388, 1595
- de Vaucouleurs et al. (1991) de Vaucouleurs, G., de Vaucouleurs, A., Corwin, H. G., Buta, R. J., Paturel, G., & Fouque, P. 1991, Third Reference Catalogue of Bright Galaxies. Springer-Verlag, New York (RC3)
- Di Matteo et al. (2007) Di Matteo, P., Combes, F., Melchior, A.-L., & Semelin, B. 2007, A&A, 468, 61
- Doublier et al. (1999) Doublier, V., Caulet, A., & Comte, G. 1999, A&AS, 138, 213
- Doyle et al. (2005) Doyle, M. T., & et al. 2005, MNRAS, 361, 34
- Duc & Renaud (2013) Duc P.-A., & Renaud F. 2013, in Souchay J., Mathis S., Tokieda T., eds, Lecture Notes in Physics, Berlin Springer Verlag Vol. 861, p. 327
- Engelbracht et al. (2008) Engelbracht, C. W., Rieke, G. H., Gordon, K. D., Smith, J.-D. T., Werner, M. W., Moustakas, J. Willmer, C. N. A., & Vanzi, L. 2008, ApJ, 678, 804
- Ekta, Chengalur & Pustilnik (2006) Ekta, B., Chengalur, J. N., & Pustilnik, S. A. 2006, MNRAS, 372, 853
- Fisher & Drory (2011) Fisher, D. B., & Drory, N. 2011, ApJ, 733, L47
- Gil de Paz, Madore & Pevunova (2003) Gil de Paz, A., Madore, B. F., & Pevunova, O. 2003, ApJS, 147, 29
- Hambly et al. (2001) Hambly, N. C., & et al. 2001, MNRAS, 326, 1279
- Holmberg et al. (1974) Holmeberg, E. B., Lauberts, A., Schuster, H.-E., & West R. M. 1974, A&AS, 18, 463
- Hopkins, Schulte-Ladbeck & Drozdovsky (2002) Hopkins, A. M., Schulte-Ladbeck, R. E., & Drozdovsky, I. O. 2002, AJ, 124, 862
- Hopkins et al. (2003) Hopkins, A. M. et al. 2003, ApJ, 599, 971
- Huchtmeier et al. (2007) Huchtmeier, W. K., Petrosian, A., Gopal-Krishna, & Kunth, G. 2007, A&A, 462, 919
- Icke (1985) Icke, V. 1985, A&A, 114, 115
- Kehrig, Telles & Cuisinier (2004) Kehrig, C., Telles E., & Cuisinier, F. 2004, AJ, 128, 1141
- Kennicutt (1998a) Kennicutt, R. C. 1998a, ApJ, 498,541
- Kennicutt (1998b) Kennicutt, R. C. 1998b, ARA&A, 36, 189
- Kennicutt et al. (2008) Kennicutt, R. C., Lee, J. C., Funes, J. G., J. S., Sakai, S., & Akiyama, S. 2008, ApJS, 178, 247
- Koribalski et al. (2004) Koribalski, B. S., & et al. 2004, AJ, 128, 16
- Kunth & Östlin (2000) Kunth, D., & Östlin, G. 2000, A&ARv, 10, 1
- Lauberts & Valentijn (1989) Lauberts, A., & Valentijn, E. A. 1989, The surface photometry catalogue of the ESO-Uppsala galaxies (Garching: European Southern Observatory)
- Lee et al. (2009) Lee, J.C., Kennicutt, R. C., Funes, J. G., J. S., Sakai, S., & Akiyama, S. 2009, ApJ, 692, 1305
- Lelli et al. (2012) Lelli, F., Verheijen, M., Fraternali, F., & Sancisi, R. 2012, A&A, 537, A72
- López-Sánchez & Esteban (2009) López-Sánchez, Á. R., & Esteban, C. 2009, A&A, 508, 615
- López-Sánchez et al. (2012) López-Sánchez, Á R., Koribalski, B. S., van Eymeren, J., Esteban, C., Kirby, E., Jerjen, H., & Lonsdale, N. 2012, MNRAS, 419, 1051
- Makarov & Karachentsev (2009) Makarov, D., & Karachentsev, I. D. 2009, Astrophys. Bull., 64, 24
- Makarov & Karachentsev (2011) Makarov, D., & Karachentsev, I. D. 2011, MNRAS, 412, 2498
- Mendez & Esteban (2000) Mendez, D. I., & Esteban, C. 2000, A&A, 359, 493
- Meyer et al. (2004) Meyer, M. J. et al. 2004, MNRAS, 350, 1195
- Nidever et al. (2013) Nidever, D. L. et al. 2013, ApJL, 779, L15
- Östlin et al. (1999) Östlin, G., Amram, P., Masegosa, J., Bergvall, N., & Boulesteix, J. 1999, A&AS, 137, 419
- Östlin et al. (2001) Östlin, G., Amram, P., Bergvall, N., Masegosa, J., Boulesteix, J., & Márquez, I. 2001, A&A, 374, 800
- Papaderos et al. (1996) Papaderos, P., Loose, H.-H., Fricke, K. J., & Thuan, T. X. 1996, A&A, 314, 59
- Pawlowski, Kroupa & de Boer (2011) Pawlowski, M. S., Kroupa, P., & de Boer, K. S. 2011, A&A, 532, 118
- Peacock et al. (2016) Peacock, J. A., Hambly, N. C., Bilicki, M., MacGillivray, H. T., Miller, L., Read, M. A., & Tritton, S. B. 2016, MNRAS, 462, 2085
- Pollo et al. (2010) Pollo, A., Rybka, P., & Takeuchi, T. T. 2010, A&A, 514, 3
- Pustilnik et al. (2001) Pustilnik, S. A., Kniazev, A. Y., Lipovetsky, V. A., & Ugryumov, A. V. 2001, A&A, 373, 24
- Rothberg & Joseph (2004) Rothberg, B., & Joseph, R. D. 2004, AJ, 128, 2098
- Rich et al. (2012) Rich, R. M., Collins, M. L. M., Black, C. M., Longstaff, F. A., Koch, A., Benson, A., & Reitzel, D. B. 2012, Nature, 482, 192
- Salzer, MacAlpine & Boroson (1989) Salzer, J. J., MacAlpine, G. M., & Boroson, T. A. 1989, ApJS, 70, 447
- Sault, Teuben, & Wright (1995) Sault, R. J., Teuben, P. J., & Wright, M. C. H. 1995, in Shaw, R., Payne, H. E., Hayes, J. J. E., eds, ASP Conf. Ser. Vol. 77, Astronomical Data Analysis Software and Systems IV. Astron. Soc. Pac., San Francisco, p. 433
- Schlafly & Finkbeiner (2011) Schlafly, E. F. & Finkbeiner, D. P. 2011, ApJ, 737, 103
- Searle, Sargent & Bagnuolo (1973) Searle, L., Sargent, W. L. W., & Bagnuolo, W. G. 1973, ApJ, 179, 427
- Skrutskie et al. (2003) Skrutskie, M. F., Cutri, R. M., Stiening, R., et al. 2003, VizieR Online Data Catalog: VII/233
- Springob et al. (2007) Springob, C. M., Masters, K. L., Haynes, M. P., Giovanelli, M. P., & Marinoni, C. 2007, ApJS, 172, 599
- Sung et al. (2002) Sung, E.-C., Chun, M.-S., Freeman, K. C., & Chaboyer, B. 2002, in The Dynamcs, Structure & History of Galaxies : A Workshop in Honour of Professor Ken Freeman, eds. G. S. Da Costa, E. M. Sadler, & H. Jerjen, ASP Conf. Ser., 273, 341
- Taylor et al. (1995) Taylor, C. L, Brinks, E., Grashuis, R. M, & Skillman, E. D. 1995, ApJS, 99, 427
- Taylor (1997) Taylor, C. L 1997, ApJ, 480, 524
- Theureau et al. (2005) Theureau, G. Coudreau, N., Hallet, N., Hanski, M., Alsac, L., Bottinelli, L., Gouguenheim, L., Martin, J.-M., & Paturel, G. 2005, A&A, 430, 373
- Thuan (1983) Thuan, T. X. 1983, ApJ, 268, 667
- Thuan & Martin (1981) Thuan, T. X., & Martin, G. E. 1981, ApJ, 247, 823
- Ueda et al. (2014) Ueda, J., & et al. 2014, ApJS, 214, 1
- van Zee, Skillman & Salzer (1998) van Zee, L., Skillman, E. D., & Salzer, J. J. 1998, AJ, 116, 1186
- Verbeke et al. (2014) Verbeke, R., De Rijcke, S., Koleva, M., Cloet-Osselaer, A., Vandenbroucke, B., & Schroyen, J. 2014, MNRAS, 442, 1830
- Walter et al. (2008) Walter, F., Brinks, E., de Blok, W. J. G., Bigiel, F., Kennicutt Jr., R. C., Thornley, M. D., & Leroy, A. 2008, AJ, 136, 2563
- Wong et al. (2016) Wong, O. I., Meurer, G. R., Zheng, Z., Heckman, T. M., Thilker, D. A., & Zwaan, M. A. 2016, MNRAS, 460, 1106
- Zwaan et al. (2004) Zwaan, M. A., & et al. 2004, MNRAS, 350, 1210