Formation of surface nanodroplets under controlled flow conditions
Abstract
Nanodroplets on a solid surface (i.e. surface nanodroplets) have practical implications for high-throughput chemical and biological analysis, lubrications, lab-on-chip devices, and near-field imaging techniques. Oil nanodroplets can be produced on a solid-liquid interface in a simple step of solvent exchange in which a good solvent of oil is displaced by a poor solvent. In this work, we experimentally and theoretically investigate the formation of nanodroplets by the solvent exchange process under well-controlled flow conditions. We find that the contact angle of the nanodroplets is independent of the flow condition. However, there are significant effects from the flow rate and the flow geometry on the droplet size. We develop a theoretical framework to account for these effects. The main idea is that the droplet nuclei are exposed to an oil oversaturation pulse during the exchange process. The analysis gives that the volume of the nanodroplets increases with the Peclet number of the flow as , which is in good agreement with our experimental results. In addition, at fixed flow rate and thus fixed Peclet number, larger and less homogeneously distributed droplets formed at less narrow channels, due to convection effects originating from the density difference between the two solutions of the solvent exchange. The understanding from this work provides valuable guidelines for producing surface nanodroplets with desired sizes by controlling the flow conditions.
School of Civil, Environmental and Chemical Engineering, RMIT University, Melbourne, VIC 3001, Australia,
Physics of Fluids Group, MESA+ Institute, and J. M. Burgers Centre for Fluid Dynamics, University of Twente, 7500 AE Enschede, The Netherlands,
Centre for Biodiscovery and Molecular Development of Therapeutics, College of Science, Technology Engineering, James Cook University, Townsville City QLD 4811, Australia,
Nanoscale droplets on a substrate are an essential element for a wide range of applications, namely lab-on-chip devices, simple and highly-efficient miniaturised reactors for concentrating products, high-throughput single-bacteria or single-biomolecular analysis, and high-resolution imaging techniques, amongst others [1, 2, 3, 4]. Quite some effort has been devoted to produce a large amount of nanodroplets in a controlled way. The current techniques include trapping by microcavities, emulsion direct adsorption, microprinting and others [5]. The solvent exchange process is a simple and generic approach for producing droplets or bubbles at solid-liquid interfaces that are only several tens to hundreds nanometers in height, or a few femtoliter in volume [6, 7, 8, 9, 10]. It has attractive advantages, such as its capability of producing a large number of nanodroplets in one simple step, and its generality in chemical composition of the droplet liquid, and flexibility in aspect ratio of the droplets and spatial structure or size of the substrate [8, 11].
For the formation of surface nanodroplets by solvent exchange, a hydrophobic substrate is exposed sequentially to two miscible solutions of oil, where the second solvent has a lower solubility of oil than the first. Such solubility difference leads to supersaturation of the liquid with oil during the solvent exchange and consequently to the nucleation of nanodroplets on the substrate. The analogue technique in a bulk system is called solvent shifting or nanoprecipitaion through the Ouzo effect [12], which has been increasingly applied to obtain nanodroplets in a surfactant-free emulsion [13], monodispersed polymeric nanoparticles with precisely-controlled sizes [14, 15, 11, 16], or assemble colloidal particles on a microscale [17].
Although the chemical composition of the solutions has been used to adjust the average size of the droplets [11], the flow properties dramatically complicate the formation of nanodroplets by the solvent exchange. The reason is that the mixing of the two liquids strongly depends on the flow conditions [18, 19]. Inspired by the pattern formation of mineral aggregates from liquid displacement under a quasi-2D flow conditions [20, 21], we may be able to control the droplet nucleation and growth by the flow conditions in a well-defined flow system. In this work, we theoretically and experimentally investigate the effects of the flow conditions on the formation of surface nanodroplets. We find that the averaged volume of surface nanodroplets increases with the Peclet number as , in good agreement with the experiments. As far as we know, this work is the first attempt to quantitatively understand the effects of the flow conditions during the solvent exchange on the formation of surface nanodroplets.
Results and discussion
0.1 Droplet volume dependence on the flow rate
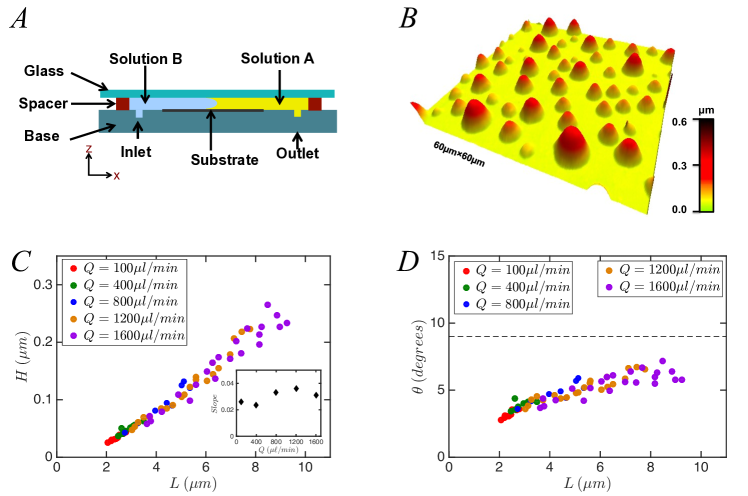
The geometry of the solvent exchange channel and process is shown in schematic drawings in Figure 1(a). Three fluid channels with different heights were used and their dimensions are listed in Table 1. During the solvent exchange process, solution A (50% ethanol aqueous solution saturated with polymerisable oil, with high oil solubility) was displaced by solution B (oil-saturated water, with low oil solubility). The injection of solution B was performed at a constant flow rate controlled by a syringe pump. Once the solvent exchange was completed, the nanodroplets on the substrate were cured by photopolymerization.
Figure 1(b) show a representative AFM image of the polymerised nanodroplets. The polymerised droplets are spherical caps with a certain size distribution. The plot in Figure 1(c) shows that the droplet height increases monotonically from 10 nm to 300 nm as the lateral size increases from 2 m up to 10 m, in consistency with the previous reports [8]. The contact angles of those polymerised droplets lie mainly between the macroscopic receding () and advancing () contact angles of the system111Strictly speaking, the contact angle of a liquid droplet before the polymerisation is about larger than that of its polymerised counterpart due to curing shrinkage. . Clearly, the flow rate does not influence the contact angle of the surface nanodroplets.
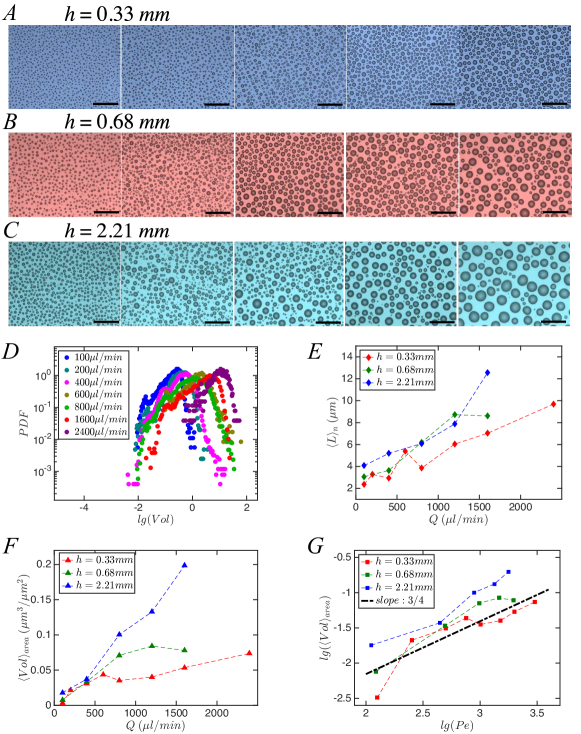
The droplet volume is calculated from its lateral diameter in the optical images of the polymerised droplets in Figure 2, and the corresponding contact angle in Figure 1. Figure 2(d) shows the probability distribution function (PDF) of the droplet volume at different flow rates in the narrowest channel, where the distribution of the droplet volume became wider at a faster flow rate. To further examine effects of the flow rate on the droplet size, we measured the lateral diameter of droplets that were produced from different flow rates at all three channels. The averaged lateral diameter of the droplets versus the flow rate is plotted in Figure 2(e), which shows a fast increase of the droplet size with an increase in the flow rate for all three channel heights. For instance, in the narrow channel the spatially averaged droplet diameter increased from 2 m to 10 m (20 nm to 300 nm in height) as the flow rate increased from 100 l/min to 2400 l/min. It shows the same trend for the two less narrow channels, but the absolute values are larger on average.
We analysed all droplet volumes over a surface area of 0.35 mm2 and obtained the averaged droplet volume per unit area of m2. The plot in Figure 2(f) shows a sharp increase of the averaged droplet volume with increasing flow rate. The same data are shown in Figure 2(g) (in a log-log plot) versus the Peclet number
| (1) |
of the flow, where is the diffusion constant. The data can be described with the scaling law . Later we will show that this scaling law between the droplet volume and the number is in a good agreement with the theoretical prediction.
It is crucial to identify the formation mechanism of the droplets before we develop a theoretical model to understand the effect of the flow rate. In our tertiary system of ethanol-oil-water, surface nanodroplets may nucleate on the surface, or through the standard “ouzo effect”, namely nucleate in the bulk liquid [12, 22, 23, 24, 16], and only later adsorb onto the surface. We analysed the droplet volume and the surrounding area of droplet-depleted zone, following the modified Voronoï tessellation method in our previous work [25]. In Supporting Figure 1, we show the relation between the depleted area and the area of the corresponding footprint of nanodroplets produced at different flow rates. For the relatively large nanodroplets, the depleted area is proportional to the droplet footprint area. This correlation clearly suggests that surface nanodroplets are not from random adsorption of emulsion droplets, but from heterogenous nucleation and subsequent diffusion-driven growth. In this process, the oil dissolved in the bulk is consumed by the growth of the droplets, leading to the droplet-depleted area in the surrounding region. The same diffusion-driven mechanism and the same correlation between the depleted area and the footprint area was also observed (and derived) for the spatial arrangement of surface nanobubbles formed by the solvent exchange method [25].
A simple theoretical model
0.2 Mathematical description of the solvent exchange process
As shown in the schematic drawings of Figure 1, the flow cell consists of a channel with height and channel width . The maximal flow velocity is , and mean flow velocity . The resulting flow rate is , its Reynolds number . For the theory we will focus on laminar flow, i.e. , which, as seen from Table 1, is justified for all channels. Furthermore, we will neglect the density contrast between the ethanol solution and the water (factor about 0.9), which, as we will see below, strictly speaking is only justified for the narrow channel case mm.
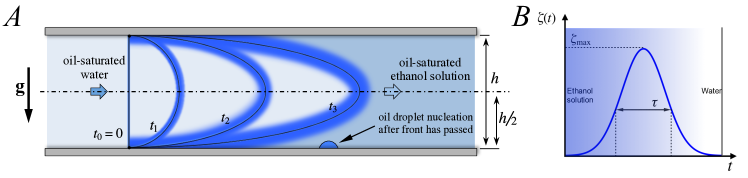
In principle, the solvent exchange process is described by the advection diffusion equations for the ethanol solution and water and the oil dissolved in it, with the no-slip boundary conditions on all walls. The initial conditions are such that in the left part of the channel there is no ethanol dissolved in the water, but oil up to its saturation concentration in water. In the right part of the channel we have ethanol solution with dissolved oil at saturation concentration . At time the interface between the two parts of the flow is assumed to be sharp. From on, the flow is driven by a pump such that the flow rate is constant. The interface will then develop a parabolic shape, corresponding to the laminar flow situation. It will smoothen out with advancing time, see the sketch Figure 3(a). Note that downstream in the region which was initially filled with ethanol solution the front will hit the surface nearly parallel to the surface, due to the no-slip boundary condition. The width of the front is given by the diffusion process of oil (and ethanol) towards the water and water towards the ethanol. The boundary conditions for the oil are no flux boundary conditions at the top and bottom wall. Once there is oil droplet nucleation, the oil concentration equals at the droplet-water interface.
For nucleating and growing oil droplets the most relevant quantity is the oil oversaturation
| (2) |
As the liquid is saturated in the ethanol phase, there we have and thus . The same holds in the water oil phase, and thus also . However, in the broadening front around the interface we have oversaturation , as oil diffuses from the ethanol-rich phase towards the water-rich phase, in which it is less soluble. The maximum oversaturation is
| (3) |
At fixed position downstream (what initially is the ethanol phase) we first have no oversaturation, . Then the front is passing by during which so that oil droplets can nucleate and grow. In the end the ethanol is basically fully replaced by the oil-saturated water and then again . This front is characterised by the maximum and by some temporal width , see Figure 3(b). One may be tempted to argue that this temporal width depends on the flow velocity. However, note that independent of the flow velocity the nucleating droplets on the surface are horizontally hit by the mixing front, given a no-slip boundary condition. We therefore argue that in our laminar flow cell is independent of and purely given by the diffusion process, suggesting . For mm as in the narrow channel experiments and we get .
0.3 Growth of a nucleated droplet
Once the oversaturation front passes, droplets nucleate and grow. Here we focus on an individual droplet. We assume that there is no pinning and that the contact angle is thus constant. The size of the droplet is characterised by its lateral extension . Alternatively, we can use the radius of curvature of the oil-water interface as a characterisation of the droplet size, which we will do here. Then for the droplet volume, as is constant. Assuming different growth modes as stick-slip or stick-jump [26] would only change prefactors, but not the essence of below derivation.
Strictly speaking, for the droplet growth no symmetry holds: The axial symmetry, which is obeyed for a drop diffusively growing in still liquid, is broken by the flow direction. Nonetheless, to obtain the scaling relations we can still assume the diffusive growth equation even in spherical symmetry,
| (4) |
In this laminar flow situation the concentration gradient at the interface is given by the oil concentration difference between the oil concentration in the flow and at the interface and by the thickness of the concentration boundary layer, for which we assume a Prandtl-Blasius Pohlhausen’s type behavior [27, 28] as appropriate for laminar flow. Then . I.e., we have
| (5) |
Plugging this into equation (4) we obtain a simple ODE for , namely
| (6) |
which can easily be integrated respectively from 0 to the final radius or from 0 to , giving
| (7) |
Here we have used . Using our prior assumptions (in particular that it is flow rate independent) and equation (3) on we obtain
| (8) |
for the final volume of the droplet after the solvent exchange. The scaling of our theoretical model is in good agreement with the experimental data shown in Figure 2(g), given that the droplet number density is flow rate independent.
Buoyance driven convection effects for the less narrow channels
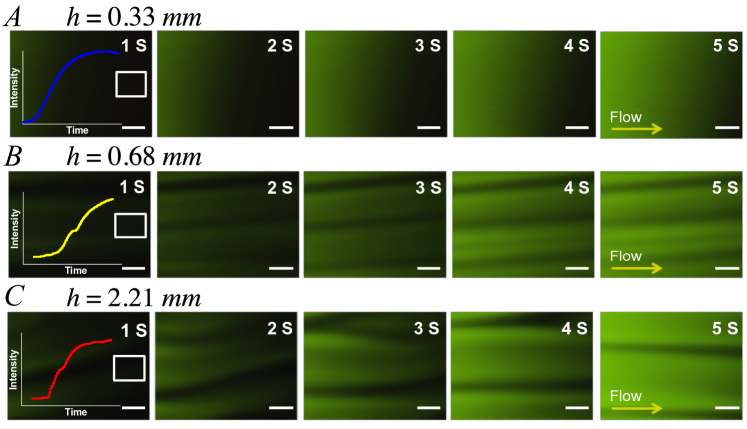
We now examine the effect of the channel height on the droplet formation. First of all we characterised the flow in the channels by using fluorescent microscopy, while water was dyed green to assist the visualisation. Top-view videos of the entire exchange process are provided in the Supporting Videos. The snapshots in Figure 4(a) show that in the narrowest channel the water displaced the ethanol solution in a smooth and continuous manner. The fluorescent intensity on a specific location increased with time smoothly, as the concentration of water increased in the liquid phase. The top-view snapshots in Figure 4(b) and Figure 4(c) show the flow patterns for the two less narrow channels at the same mean flow velocity of of 0.36 mm/s. Straight and regular fingers were clearly visible in the channel with mm, while the flow already developed whirling patterns for mm. The time evolution of the fluorescent intensity of the dye in water shows some deflections and jumps in the intensity, indicating the abrupt change in water contents due to the non-uniform mixing. Such flow features are in contrast to the smooth flow in the narrow channel at mm. Note that in all three cases the flow is still laminar, see Table 1.
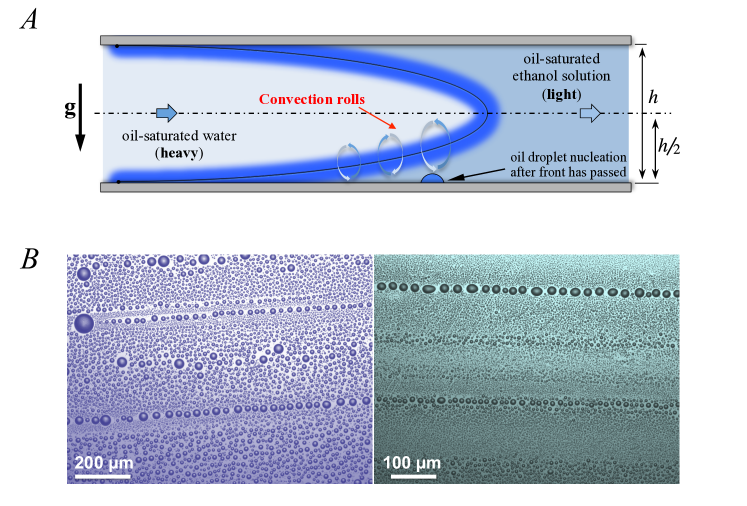
The reason for the different flow patterns in the less narrow channels is that for them we must consider the density difference between the two miscible liquids [29, 30]. The density of water is 1 g/ml while the density of the ethanol aqueous solution is 0.90 g/ml. At solvent exchange, at the bottom side of the channel above the plate, the lighter ethanol will be pushed below the entraining heavier water, potentially leading to some buoyancy driven convection rolls. To estimate when these convection rolls set in, we can define a “Rayleigh number”
| (9) |
where the density difference is g/ml, the gravitational acceleration is 9.8m/s2, is the dynamic viscosity of ethanol solution, and the mass diffusion coefficient of ethanol and water at 300K is m2/s. Convection only occurs at the lower half of the channel where heavy liquid (water) is above light liquid (ethanol), see Figure 5(a). Therefore we take as vertical length-scale in equation (9). The resulting estimated Rayleigh numbers are , , and for the channel heights of mm, mm and mm, respectively. So the convection rolls (in the top view seen as stripes) only occur in the two less narrow channels, where the Rayleigh number is larger than the critical Rayleigh number 1708 [31]. The existence of convection rolls for the two less narrow channels also explain why for fixed flow rate and thus fixed Peclet number, the average droplet size depends on the channel height, in particular for high flow rates, as seen in Figure 2(a)(b)(c). The convection rolls lead to a better mixing between ethanol and water, and thus better transport of oil towards the substrate and consequently to larger oil droplets.
The development of the secondary flow at a high flow rate may lead to some patterns of the droplets. Indeed, we observed that some of the droplets produced in the least narrow channel line up along the flow direction as shown in Figure 5(b). Such lines of droplets also formed at larger flow rate in the channel with mm. They form when the convection rolls hit the surface, bringing down oil rich liquid. All these features do not develop when we turn the channel by (see Supporting Figure 2), through which we eliminate buoyancy effects.
Conclusions
In summary, we theoretically and experimentally investigate the formation of surface nanodroplets by solvent exchange under well-controlled flow conditions. We found that although the contact angle of surface nanodroplets is independent of flow conditions, the flow rate and flow geometry have significant effects on the droplet size. We developed a theoretical framework for the solvent exchange process, whose result is in good agreement with the experimental results, namely that the droplet volume increases with . Increasing the channel height (for given flow rate and thus given ) can induce convection driven by the density difference between water and ethanol, leading to larger droplets and an inhomogeneous droplet nucleation pattern, which reflects the convection rolls. The results presented in this work provides valuable guideline for the device design to generate surface nanodroplets with some desired sizes.
Experimental section
0.4 Substrate and solutions
A stock solution containing monomer and initiator was prepared by mixing 1, 6-hexanediol di-acrylate (HDODA) (80 %, Sigma-Aldrich) with 2-hydroxy-2-methylpropiophenone ( 97 %, Sigma-Aldrich) in the ratio of 10:1. This solution of monomer precursors served as oil phase. 4 ml of the monomer solution was added into 100 ml ethanol/water (50 v%: 50 v%) solution, and the bottom phase of the liquid was the solution A. Solution B was water saturated with HDODA. The hydrophobic substrate of OTS-Si was prepared and cleaned by following the protocol reported in previous work [8]. Before use, the OTS-Si was cleaned with chloroform, sonicated in ethanol, and dried with nitrogen. The advancing and receding contact angles of water were and , respectively.
0.5 Preparation, polymerisation and characterisation of nanodroplets
The experimental setup is shown in the schematic drawing Figure 1(a). A flow cell was constructed by assembling a glass plate, a spacer and a base together, forming a channel where the OTS-Si was put in. The channel height between the OTS-Si substrate and glass plate was adjusted by the thickness of the spacer. 5 ml solution A was first injected into the flow cell, followed by the injection of 10 ml solution B with a constant flow rate controlled by a syringe pump. After the formation of the nanodroplets, the flow cell was illuminated under an UV lamp (20 W, 365 nm) for 15 min, allowing the polymerization of the monomer droplets. The substrate was then washed with ethanol and dried by a gentle stream of nitrogen. Images of the polymerised microdroplets were acquired using a reflection-mode optical microscopy. High resolution images of the polymerised microdroplets were also obtained from normal contact mode AFM imaging in air (Asylum Research, Santa Barbara, CA).
We thank Andrea Prosperetti for making us aware of the possible occurrence of convection rolls in this system and for very stimulating discussions, and Shuhua Peng for assisting in the experiments. X.H.Z. acknowledges the support from Australian Research Council (FT120100473, DP140100805), L.B. from Endeavour Research Fellowship. D.L. gratefully acknowledges the support from an ERC-Advanced Grant and MCEC.
The authors declare that they have no competing financial interests.
d.lohse@utwente.nl.
Reference
References
- [1] Antonio Mendez-Vilas and Ana Belen Jodar-Reyes and Maria Luisa Gonzalez-Martin, Ultrasmall Liquid Droplets on Solid Surfaces: Production, Imaging, and Relevance for Current Wetting Research, Small, 5(2009), pp. 1366–1390.
- [2] Chiu, Daniel T. and Lorenz, Robert M., Chemistry and Biology in Femtoliter and Picoliter Volume Droplets, Chemistry and Biology in Femtoliter and Picoliter Volume Droplets, 42(2009), pp. 649–658.
- [3] Shemesh, Jonathan and Ben Arye, Tom and Avesar, Jonathan and Kang, Joo H. and Fine, Amir and Super, Michael and Meller, Amit and Ingber, Donald E. and Levenberg, Shulamit, Stationary nanoliter droplet array with a substrate of choice for single adherent/nonadherent cell incubation and analysis, P.N.A.S., 111(2014), pp. 11293–11298.
- [4] Meckenstock, Rainer U. and von Netzer, Frederick and Stumpp, Christine and Lueders, Tillmann and Himmelberg, Anne M. and Hertkorn, Norbert and Schmitt-Kopplin, Philipp and Harir, Mourad and Hosein, Riad and Haque, Shirin and Schulze-Makuch, Dirk, Water droplets in oil are microhabitats for microbial life, Science, 345(2014), pp. 673–676.
- [5] Day, P. and Manz, A. and Zhang, Yonghao, Microdroplet technology principles and emerging applications in biology and chemistry (Integrated analytical systems), NY: Springer, 2012.
- [6] S.-T. Lou and Z.-Q. Ouyang and Y. Zhang and X.-J. Li and J. Hu and M.-Q. Li and F.-J. Yang, Nanobubbles on solid surface imaged by atomic force microscopy, J. Vac. Sci. Technol. B, 18(2000), pp. 2573–2575.
- [7] Zhang, Xuehua and Ducker, William, Formation of interfacial nanodroplets through changes in solvent quality, Langmuir, 23(2007), pp. 12478–12480.
- [8] X. H. Zhang and J. M. Ren and H. J. Yang and Y. H. He and J. F. Tan and G. G. Qiao, From Transient Nanodroplets to Permanent Nanolenses, Soft Matter, 8(2012), pp. 4314–4317.
- [9] Belova, Valentina and Krasowska, Marta and Wang, Dayang and Ralston, John and Shchukin, Dmitry G. and Moehwald, Helmuth, Influence of adsorbed gas at liquid/solid interfaces on heterogeneous cavitation, Chem. Sci., 4(2013), pp. 248–256.
- [10] V. S. J. Craig, Very small bubbles at surfaces – the nanobubble puzzle, Soft Matter, 7(2011), pp. 40–48.
- [11] Yang, Haijun and Peng, Shuhua and Hao, Xiaotao and Smith, Trevor A. and Qiao, Greg G. and Zhang, Xuehua, Surfactant-mediated formation of polymeric microlenses from interfacial microdroplets, Soft Matter, (2014), pp. 957–964.
- [12] Vitale, SA and Katz, JL, Liquid droplet dispersions formed by homogeneous liquid-liquid nucleation: “The ouzo effect”, Langmuir, 19(2003), pp. 4105–4110.
- [13] Ma, Aijing and Xu, Jie and Xu, Haolan, Impact of Spontaneously Adsorbed Hydroxide Ions on Emulsification via Solvent Shifting, J. Phys. Chem. C, 118(2014), pp. 23175–23180.
- [14] Aubry, Julien and Ganachaud, Francois and Addad, Jean-Pierre Cohen and Cabane, Bernard, Nanoprecipitation of Polymethylmethacrylate by Solvent Shifting: 1. Boundaries, Langmuir, 25(2009), pp. 1970–1979.
- [15] Elise Lepeltier and Claudie Bourgaux and Patrick Couvreur, Nanoprecipitation and the “Ouzo effect”: Application to drug delivery devices, Adv. Drug Deliv. Rev., 71(2014), pp. 86 - 97.
- [16] Stepanyan, R and Lebouille, JGJL and Slot, JJM and Tuinier, R and Stuart, MA Cohen, Controlled nanoparticle formation by diffusion limited coalescence, Physical review letters, 109(2012), pp. 138301.
- [17] Graužinytė, Miglė and Forth, Joe and Rumble, Katherine A. and Clegg, Paul S., Particle-Stabilized Water Droplets that Sprout Millimeter-Scale Tubes, Angewandte Chemie International Edition, 54(2015), pp. 1456–1460.
- [18] Stroock, Abraham D. and Dertinger, Stephan K. W. and Ajdari, Armand and Mezi, Igor and Stone, Howard A. and Whitesides, George M., Chaotic Mixer for Microchannels, Science, 295(2002), pp. 647–651.
- [19] Al-Housseiny, Talal T. and Tsai, Peichun A. and Stone, Howard A., Control of interfacial instabilities using flow geometry, Nat Phys, 8(2012), pp. 747–750.
- [20] Haudin, Florence and Cartwright, Julyan H. E. and Brau, Fabian and De Wit, A., Spiral precipitation patterns in confined chemical gardens, P.N.A.S., 111(2014), pp. 17363–17367.
- [21] Steinbock, Oliver, Complexity from precipitation reactions, P.N.A.S., 111(2014), pp. 17346–17347.
- [22] Zhang, Xue Hua and Ducker, William, Interfacial oil droplets, Langmuir, 24(2008), pp. 110–115.
- [23] Schubert, Stephanie and Delaney, Jr, Joseph T. and Schubert, Ulrich S., Nanoprecipitation and nanoformulation of polymers: from history to powerful possibilities beyond poly(lactic acid), Soft Matter, 7(2011), pp. 1581–1588.
- [24] Yan, Xibo and Delgado, Marco and Fu, Amy and Alcouffe, Pierre and Gouin, Sébastien G. and Fleury, Etienne and Katz, Joseph L. and Ganachaud, François and Bernard, Julien, Simple but Precise Engineering of Functional Nanocapsules through Nanoprecipitation, Angew. Chem. Int. Ed., (2014), pp. 7030–7033.
- [25] H. Lhuissier and D. Lohse and Xuehua Zhang, Spatial organization of surface nanobubbles and implications on their formation process, Soft Matter, 10(2014), pp. 942–946.
- [26] Xuehua Zhang and Jun Wang and Lei Bao and Erik Dietrich and Roeland C. A. van der Veen and Shuhua Peng and James Friend and Harold J. W. Zandvliet and Leslie Yeo and Detlef Lohse, Mixed mode of dissolving immersed microdroplets at a solid-water interface, Soft Matter, 11(2015), pp. 1889–1900.
- [27] H. Schlichting and K. Gersten, Boundary layer theory 8th, Springer Verlag, (2000).
- [28] S. Grossmann and D. Lohse, Fluctuations in turbulent Rayleigh-Bénard convection: The role of plumes, Phys. Fluids, 16(2004), pp. 4462–4472.
- [29] Lajeunesse, E. and Martin, J. and Rakotomalala, N. and Salin, D., 3D Instability of Miscible Displacements in a Hele-Shaw Cell, Phys. Rev. Lett., 79(1997), pp. 5254–5257.
- [30] Bischofberger, Irmgard and Ramachandran, Radha and Nagel, Sidney R., Fingering versus stability in the limit of zero interfacial tension, Nat Commun, 5(2014), pp. 5265.
- [31] Faber, Tom E, Fluid dynamics for physicists, Cambridge University Press, (1995).
| Q (l/min) | Re | Pe | (mm/s) | ||
|---|---|---|---|---|---|
| h=0.33mm | h=0.68mm | h=2.21mm | |||
| 100 | 0.04 | 119 | 0.36 | 0.18 | 0.05 |
| 200 | 0.09 | 238 | 0.72 | 0.35 | 0.11 |
| 400 | 0.18 | 476 | 1.44 | 0.70 | 0.22 |
| 600 | 0.27 | 714 | 2.16 | 1.05 | 0.32 |
| 800 | 0.35 | 952 | 2.88 | 1.40 | 0.43 |
| 1200 | 0.53 | 1429 | 4.32 | 2.10 | 0.65 |
| 1600 | 0.71 | 1905 | 5.77 | 2.80 | 0.86 |
| 2400 | 1.06 | 2857 | 8.66 | 4.20 | 1.29 |