Powerful outflows in the central parsecs of the low-luminosity Active Galactic Nucleus NGC 1386
Abstract
Low-luminosity Active Galactic Nuclei, i.e. Lbol/L constitute the bulk population of Active Galactic Nuclei (AGNs). Powerful jets, common in these objects, are a crucial source of feedback energy driving mass outflows into the host galaxy and the intergalactic medium. This paper reports the first direct measurement of powerful mass outflows traced by the forbidden high ionization gas in the low luminosity AGN NGC 1386 at scales of a few parsecs from the central engine. The high angular resolution of the data allows us to directly measure the location, morphology and kinematic of the outflow. This has the form of two symmetrical expanding hot gas shells moving in opposite directions along the line of sight. The co-spatiality of the gas shells with radio emission seen at the same parsec scales and with X-rays indicates that this is a shock-driven outflow presumably induced by an incipient core-jet. With a minimum number of assumptions, we derive a mass outflow rate of 11 M⊙ yr-1, comparable to those of powerful AGN. The result has strong implications in the global accounting of feedback mass and energy driven by a low-luminosity AGN into the medium and the corresponding galaxy evolution.
keywords:
Galaxies: seyfert – Infrared: galaxies – Galaxies: individual: NGC 13861 Introduction
Galactic mass outflows are relatively well collimated flows of gas material emerging out of the plane of a galaxy either from the central regions of starburst galaxies or from the centre of an active galactic nucleus (AGN). They are seen in all gas phases molecular, neutral and ionized and are identified from the relatively large velocities they reach, varying from a few hundreds up to thousands of km s-1. The energy deposited by these outflows in their host galaxy, or in the intergalactic medium if powerful enough, is a major feedback source in galaxy formation theories. It is currently accepted that these outflows play a major role in the evolution of galaxies, stir metals in the Interstellar Medium (ISM), control the common grow of bulges and supermassive black holes, and possibly halt the star formation in early type galaxies.
AGN induced outflows are driven by the nuclear radiation, thermal-pressure, and/or by jets and are so far rather modest in terms of the amount of mass dumped into the medium few solar masses per year as compared with hundred to thousand solar masses per year derived form starburst super winds (e.g., Heckman et al., 2002; Veilleux et al., 2005). Unambiguous evidence for AGN outflows comes from the detection of blueshifted gas traced in absorption and close to the nucleus. That is the case with the reported X-ray, UV and H i absorbers (e.g., Crenshaw & Kraemer, 2005; Veilleux et al., 2005; Morganti et al., 2005). Still, key parameters to infer the mass outflow rates, such as density, volume, location and filling factor rely on models, either of the gas ionization state and/or the outflow morphology.
Photoionization models are used in the case of the UV/X-rays absorbers to infer their location. The results have placed these absorbers at a few tens of parsecs from the AGN, possibly in the innermost clouds of the narrow line region (NLR, Crenshaw & Kraemer, 2005). H i absorbers in radio-loud galaxies are traced at kiloparsecs of distance, possibly also associated with the NLR and thus thought to be nuclear outflows (Morganti et al., 2005). The solid angle subtended at those distances implies a very large mass volume, and thus the mass outflow rates derived by these authors are accordingly among the largest driven by AGN, of several tens of solar masses.
The use of the high ionization coronal line emitting spectrum as a signature of energetic AGN-driven outflows at scales of few pc from the centre allowed Rodríguez-Ardila et al. (2006) to open a new window to explore this subject. Because of their high-ionization potential (100 eV), these lines are genuine tracers of the presence of an AGN (Penston 1984; Marconi et al. 1994). Their results show that extended coronal line emission should inevitably involve the presence of outflowing gas, ionized by the combined effect of radiation from the central source and shocks formed in the interface of the expanding gas and the ISM. Later, Müller-Sánchez et al. (2011) employed subarcsec resolution data from adaptive-optics (AO) assisted observations from SINFONI (Eisenhauer et al., 2003), to model the 2D kinematic field of the prominent [Si vi] 1.96m coronal line in some of the nearest, best known Seyfert galaxies. They found outflow mass rates substantially higher than those derived in previous estimates, of a few tens to hundred solar masses per year. These values depend chiefly on the volume of gas involved, which is inferred from the model.
Among the closest AGNs displaying a remarkable coronal line spectrum is NGC 1386 (Reunanen et al., 2002; Rodríguez-Ardila et al., 2006). This source is, instead of a powerful AGN, in the borderline between the high luminous Seyfert type and the low luminosity AGN (LLAGN) class, as inferred from its low nuclear bolometric luminosity, erg s-1 (Fernández-Ontiveros et al., 2012). Its LLAGN nature is further supported by the low-Eddington ratio, (Fernández-Ontiveros et al., 2012). According to Ho (2008), low luminosity AGN display times the Eddington rate. Very few studies, indeed, have focused on the high-ionization lines in these type of objects. It is not clear if the mechanisms leading to the formation of these lines also apply to LLAGN. It is then of paramount importance to explore the role of such nuclear outflows in low-luminosity AGN in order to get a clearer picture on the mechanisms powering the high-ionization lines in them.
Located at 15.3 Mpc, pc (Jensen et al., 2003), NGC 1386 is at comparable distance as the prototype NGC 1068. Radio observations at different angular resolutions and frequencies confirm that most of the radio emission in this galaxy comes from an unresolved source at the centre (e.g., Sadler et al., 1995; Condon et al., 1998). The highest angular resolution map available from Mundell et al. (2009) at shows that the radio emission consists of a compact core with an extended jet-like emission at PA = 170 South of the nucleus. A strong H2O megamaser has also been detected in the nuclear region (Braatz et al., 1996).
The nucleus of NGC 1386 shows a wide range of high ionization optical and IR narrow emission-lines. In the optical, H+[N ii] Å and [O iii] 5007 Å extend rather collimated along the NorthSouth direction up to 6 from the nucleus, as seen in Ferruit et al. (2000) Hubble Space Telescope (HST) narrow-band images. Rossa et al. (2000) resolve the optical line emission in 9 individual components (5 redshifted and 4 blueshifted from the systemic velocity). The optical spectra presented in Phillips & Frogel (1980); Schulz & Henkel (2003) and Lena et al. (2015) show the predominance of [N ii] over H, [N ii]/H = 1.5, which is in line with a LINER-type (Low-ionization Nuclear Emission Line Region). The nucleus, though, is classified as a Seyfert 2 type. Spatially resolved emission of [Fe vii] 6087 Å, [Fe x] 6374 Å, and [Fe xi] 7889 Å, North and South of the nucleus, are reported by Rodríguez-Ardila et al. (2006). In the 2m range, NGC 1386 shows very strong [Si vi] m, [Ca viii] m and [Si vii] m lines (Reunanen et al. 2002). These lines are spatially resolved within the central 1 region.
The H2 2.121 m molecular line emission also extends in the North-South direction, up to about 4.5 North, 3.5 South of the nucleus (Reunanen et al. 2002; Mezcua et al. 2015; this work). Diffraction-limited images at 10 m and 20 m reveal that the thermal continuum is extended in two well distinct emission blobs located at about 0.2 North and South from the nucleus (Reunanen et al. 2010).
The most accurate estimate of the power of NGC 1386 comes from the bolometric luminosity integrated from the high angular resolution SED by Fernández-Ontiveros et al. (2012) down to scales of few tens of parsec from UV to radio. The SED is dominated by the IR bump, and its integration yields a L erg s-1, about a factor four larger than the previous values. Due to the high angular resolution used, this value probably provides the best accounting of the purely reprocessed accretion-disc emission by the central dust and put the nucleus in the low-luminosity AGN rank (LLAGN).
The present work analyzes, for the first time in the literature, the central 2 line emitting properties of NGC 1386 tracing the molecular H2, the ionized Br and the coronal line gas on spatial scales of 0.1 ( pc). We give special attention to the kinematic modeling of the molecular and high-ionization gas as well as to the morphology and extension of the coronal gas and the physical mechanisms leading to this emission. To this purpose, this paper is structured as follows. In Section 2 we describe the observations and data reduction as well as the most conspicuous features found in the Integral Field Unit (IFU) data. Section 3 shows the stellar component and its kinematics. The analysis of the molecular gas is detailed in Sect. 4. The high-ionization gas, its kinematics, emission line properties and the energetics of the outflowing coronal gas component are presented in Section 5. A discussion of the overall physical picture emerging from the observations is in Section 6. A brief overview of the main results are in Section 7.
2 Observations and data reduction
Very Large Telescope (VLT)/SINFONI integral-field unit observations of NGC 1386 were taken as part of the more extensive PARSEC program111http://www.iac.es/proyecto/parsec/main/group.php, which is a multiwavelength study of the central parsecs of the brightest AGN in the near universe. The VLT/SINFONI data are integral part of the ESO observing program 86.B-0484 (PI F. M’́uller-Sánchez) that was executed in May, 2010. The observations were obtained with AO at a spectral resolution of R, equivalent to km s-1 in the K-band, and with a pixel scale of . Science frames were interspersed with sky frames using the sequence Object-Sky-Object to facilitate background subtraction. The data reduction was performed using the SINFONI pipeline provided by ESO and includes: correction for bad pixels, flat-field, geometric distortions, wavelength calibration, reconstruction of the data cube from the image spectral slices, background subtraction using sky frames and flux calibration using a telluric standard star, also used for correction for telluric atmospheric features. Finally, the combined cube was resampled to a pixel scale of .
The SINFONI IFU data is complemented with a multiwavelength, high-spatial resolution dataset covering the radio, optical, infrared (IR) and X-ray ranges, collected and aligned by Fernández-Ontiveros et al. (2012). The dataset includes the near-IR VLT/NaCo adaptive optics data in the K-band (Prieto et al., 2014). In the optical range, high-spatial resolution imaging from the HST scientific archive was taken, including the broad-band F547M and F814W filters, plus the narrow-band F502N and F658N images centred in the [O iii] 5007 Å emission line and the H+[N ii] 6548, 6584 Å blend, respectively. Line images were obtained from the narrow-band filters by subtracting the continuum level based on adjacent broad-band filters, i.e. the [O iii] continuum was obtained from F547M and the H+[N ii] continuum from a linear interpolation between F547M and F814W (as described in Prieto et al., 2014).
The Chandra X-ray data were extracted from the scientific archive, and analyzed using the Chandra Interactive Analysis of Observations (ciao) software. The soft X-ray (–) image was created using the csmooth task within ciao using a minimum significance S/N level of 3. This corresponds to the same soft X-ray image presented in Mezcua et al. (2015). Only a point-like source associated to the nucleus was detected in the hard X-ray band (–).
In radio wavelengths, Very Large Array (VLA) measurements at were also included. These observations correspond to the same dataset presented in Mundell et al. (2009), but were processed and reanalyzed by M. Orienti as part of the PARSEC project (Orienti & Prieto, 2010). The radio data were reduced following the standard procedures for the VLA implemented in the NRAO AIPS package and tapered to filter the contribution of the longest baselines. The final image was produced with a circular beam of , following the procedure in Mundell et al. (2009). The radio and the X-ray nuclear unresolved sources are assumed to be coincident with the position of the K-band nucleus, since this is the only counterpart found in the FoV.
Prieto et al. (2014) showed that the nucleus of this galaxy has been mistakenly identified with a bright HST-[O iii] 5007 Å emission region pertaining to the NLR. As already indicated, the true nucleus is hidden behind a dust filament of . It is only visible longward of 2 m as an outstanding point-like source. The position of the nucleus is 17 pc North from the optical peak location thought to be the nucleus, or 0.23 North as measured from the comparison of IR Adaptive Optics and optical HST images used in Prieto et al. (2014). The nucleus new location is close to the kinematical centre determined by Schultz and Henkel (2003), 0.6 North East from the optical peak. The larger nuclear shift found by these authors is presumably due to the poor angular resolution of their data, . The identification of the true nucleus affects previous modeling and interpretation of the NLR kinematics and nuclear excitation. In this work, we use as a reference the true nucleus location identified with the K-band continuum peak.
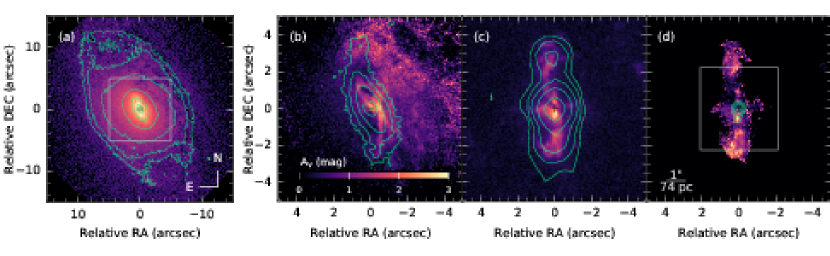
Fig. 1 shows a panchromatic view of NGC 1386: In 1(a) a wide field of view (FOV) image in the F814W filter from HST together with contours for the NaCo K-band continuum (the dust distribution suggests that the nearest side of the galaxy is in the North-West, while the far side is in the South-East, in an elliptical geometry); 1(b) shows the extinction map derived from the K/F814W colour map together with the H2 narrow-band image from NaCo by Mezcua et al. (2015); 1(c) shows the H+[N ii] narrow-band image from HST and the soft X-rays image from Chandra in contours, showing an extended emission up to in both North and South directions; 1(d) shows the [O iii]/(H+[N ii]) excitation ratio plus the radio emission at in contours. In further Sections, the radio map is shown after subtraction of a point-like Gaussian component (FWHM = ) centred in the nucleus, in order to reveal the morphology of the extended radio emission.
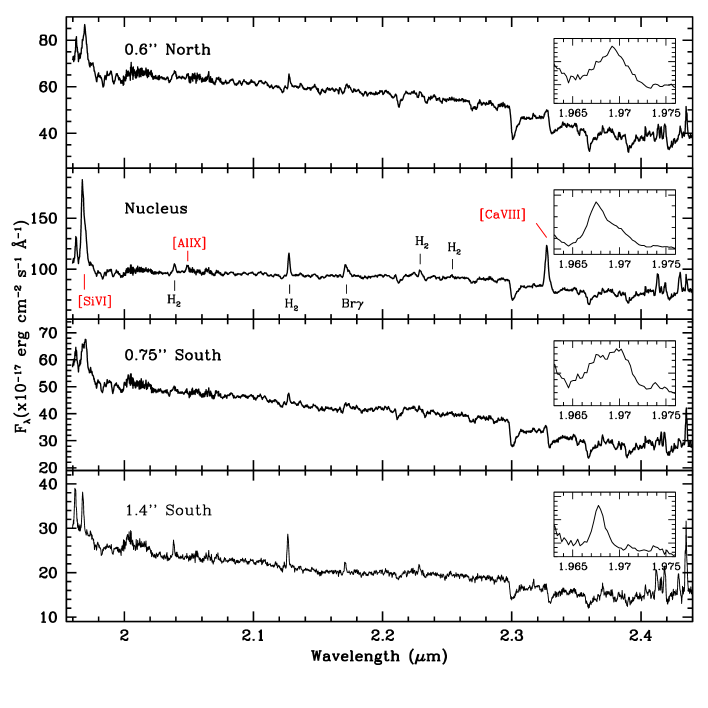
The high angular resolution K-band spectrum of NGC 1386 shows remarkable coronal lines (see Figure 2), with strong [Si vi] 1.963m and [Ca viii] 2.321 m. [Al ix] 2.040 m is also detected at the nucleus although it is rather faint. The former two dominate over other more common lines in the K-band spectrum of AGN such as Br and the H2 molecular emission. The spectra also show strong CO band head absorptions. Outside the nuclear region, the silicon and calcium coronal lines remain strong and extended over more than 150 pc distance from the centre. Figure 2 shows the K-band spectrum at various locations, the nucleus and the extended coronal line region. The angular resolution achieved in our K-band SINFONI spectrum is at Full Width at Half Maximum (FWHM), that translates into a spatial scale of 14 pc. We have no suitable point-like source in SINFONI field-of-view (FOV), hence we estimate an upper limit to the resolution taking as a reference the size of the unresolved emission components seen in the [Si vi] gas (see below).
3 The stellar kinematics
An inspection of the spectra plotted in Fig. 2 reveals prominent CO absorption bands at 2.3 m not only at the nucleus but also in the extended emission. These features imply the presence of a strong underlying stellar continuum that needs to be removed in order to obtain a clean emission line spectrum. This is particularly relevant for [Ca viii] 2.321 m, which sits on the edge of one of these bands. In order to properly characterize it as well as other emission lines, a clean subtraction of the stellar component should be carried out. The stellar absorption features also provide a tool to characterize the velocity field of the cold galaxy component.
In order to construct the radial velocity map for the stellar component of NGC 1386 we used the penalized Pixel-Fitting (pPXF) method of Cappellari & Emsellem (2004) to fit the stellar continuum. The code provides the line-of-sight velocity distribution (LOSVD) of the stars by fitting the stellar absorption features in the interval 2.1–2.37 m. The regions where the emission lines due to H2, Br and [Ca viii] are located were masked. The pPXF outputs the radial velocity (V∗), stellar velocity dispersion (), and higher order Gauss-Hermite moments ( and ), as well as the uncertainties for each parameter. As stellar templates we used the spectra of 6 late-type stars observed using the same instrumental configuration as the galaxy.
As our main purpose here is to obtain a good representation of the stellar spectrum rather than extract information about the stellar population itself, the continuum fit done by pPXF allow us to subtract this component. The result is a pure emission line spectra that will be used in the following sections.
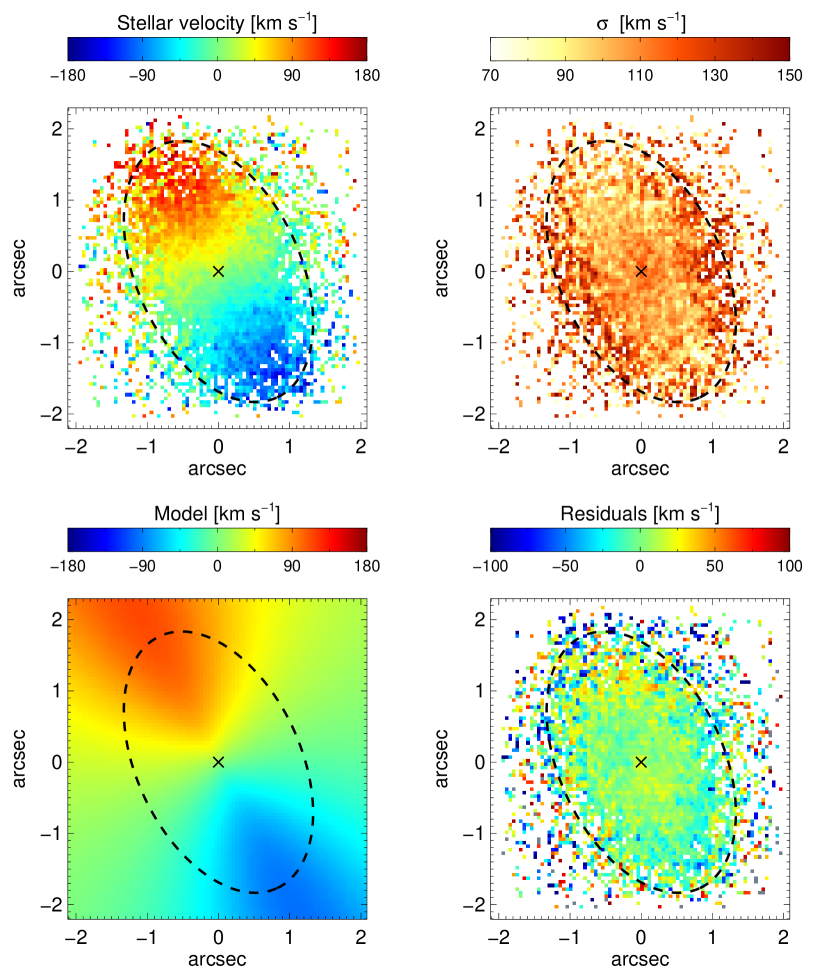
Figure 3 shows the velocity map derived for the stellar component in NGC 1386 (top left panel) as well as the stellar velocity dispersion (, top right panel). It can be seen that the stellar component displays a clear rotation pattern in the SINFONI field of view, with the North-East side receding from us and the South-West side approaching to us.
We fit an exponential thin disk model to the points that lie inside the ellipse drawn in dashed line in the top left panel of Figure 3. The resulting rotation model and the residuals after subtracting the model from the observations are shown in the bottom left and right panels of Figure 3, respectively. The small residuals ( km s-1) indicate that the stellar component is dominated by rotation, with a maximum amplitude of 130 km s-1.
The values of the disk inclination and position angle (PA) of the major axis found from the fit are and , respectively, in very good agreement to the band photometry of Xanthopoulos (1996). This suggests that the observed circumnuclear disk is very likely aligned with the major axis of the kpc-scale galaxy disk.
Our values of in the nuclear region (130 km s-1, see Figure 3) are in very good agreement to those found by Nelson & Whittle (1995) and García-Rissmann et al. (2005) obtained by means of long-slit spectroscopy. The former reported = km s-1 while the latter found = km s-1 and = km s-1 using two different methods.
4 The molecular gas in NGC 1386
4.1 Morphology and kinematics
The fit done by the pPXF and described in Sect. 3 allowed us to remove the underlying stellar continuum to better map the ionic and molecular emission line gas. We will examine here the transition H2 2.121 m 1-0S(1), the brightest molecular line detected in the spectral range covered by the SINFONI data.
In order to extract the emission line flux and kinematics of the molecular gas we used a Markov chain Monte Carlo (MCMC) technique to fit a Gaussian function to the H2 2.121 m line. From the central wavelength and width of the Gaussian function we derived the velocity and velocity dispersion () of the gas in each spatial bin (0.05 pixel).
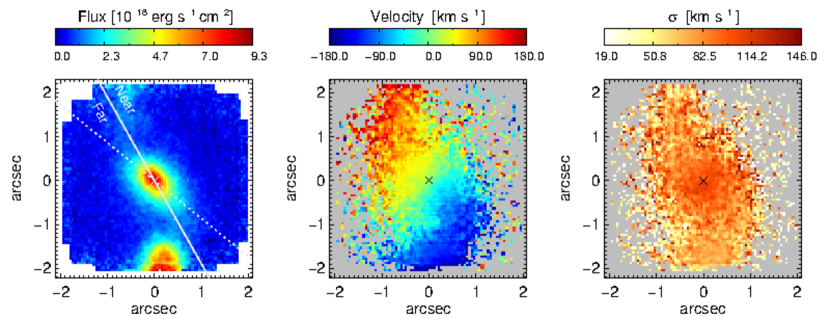
The dust distribution in the central 10 x 10 is shown in the extinction map of Fig. 1b, presented by Mezcua et al. (2015) overlaid to the flux distribution of the molecular hydrogen line. We also indicate in the plot the position angle of the major photometric axis of the galaxy (full gray line). The dotted line represents the position angle (PA) of the central molecular disk ( = , PA = 40 see below). It can be seen that the H2 emission is asymmetric, with two bright peaks observed. One, coincident with the nucleus of the AGN and another at south of the nucleus. Both regions seem to be connected by a tenuous lane of molecular gas, very prominent in the dust map distribution. It is also evident in the map an excess of molecular emission towards the NE, connected to the nucleus by another lane of dust and molecular gas.
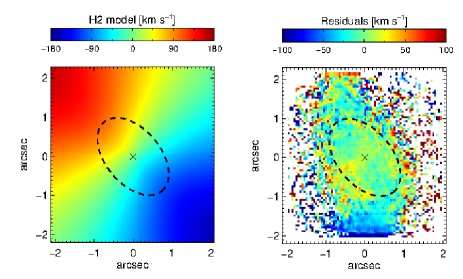
The central panel of Figure 4 displays the velocity map for the H2 2.121 m. It can be seen that the molecular gas displays a global regular rotation pattern across the field, with the NE portion of the galaxy rotating away from us and the SW portion approaching us. The largest velocity measured is 150 km s-1.
The right panel of Figure 4 shows the velocity dispersion of the 2.121 m line across the SINFONI field, already corrected for instrumental broadening, subtracting = 35 km s-1 in quadrature. Regions with very low emission-line fluxes were masked out in the kinematic maps due to the high uncertainty in the line properties. These rejected regions, characterized by an emission-line amplitude smaller than five times the scatter of the continuum, are shown in grey in the 2D maps. The measured ranges from 40 km s-1 to 140 km s-1, with the highest values in and around the nucleus, within a region of approximate circular morphology with radius . The velocity dispersion of the blob at south of the nucleus is low, with typical values close to 65 km s-1. To the north, the molecular gas is dominated by of 90 km s-1.
Uncertainties for the kinematic parameters were derived by subtracting continua equal to the original continuum value 1 times the continuum noise level. This method is more realistic than simply calculating the variance within the MCMC samples. The estimated accuracy of the measurements are 5 km s-1 in the case of the velocity of the gas and of 15 km s-1 for the velocity dispersion.
In order to characterize the rotating velocity field of the molecular gas, we fitted a rotating exponential thin-disc model to the observed velocity map following the procedure described in Mazzalay et al. (2014). The points considered in the fit were those located along and within the ellipse drawn in dashed line in Fig. 5. The resulting velocity field is shown in the middle panel of Fig. 5. The model that best describes the observations is a disk at an inclination of = 50 with the line of nodes at PA = 40 (dotted line in the left panel of Fig. 5).
The results above show that the model that best describes the kinematics of the molecular gas component slightly diverges from the one derived from the stellar population (see Sect. 3). Although, within errors, the disk inclination agrees to that of the stellar population, the position angle of both disks vary by more than 10. This indicates that both components may be misaligned in the central few tens of parsec of this object. The kinematical decoupling of both disks is interpreted in the literature as evidence of a bar, a nuclear spiral or a stochastic inflow due to external accretion into the central kiloparsec of a galaxy (Davies et al., 2014). In order to distinguish between these scenarios, observations with better S/N in the H2 line is necessary.
The subtraction of the rotation model to the data (see the right panel in Fig. 5) shows that the bulk of the molecular gas is rotation-dominated. Residuals as high as 40 km s-1 both in blueshift and redshift are observed at some positions. Our results here overall agree with those presented by Hicks et al. (2013), who shows that the kinematics of the molecular gas in Seyfert galaxies is dominated by rotation rather than bulk outflow and is thus a reasonable tracer of the cool ISM.
4.2 Excitation of the molecular gas
The detection of four rotation-vibrational transitions of the H2 molecule in the SINFONI spectrum (Fig. 2) allows us to study the origin of the molecular gas excitation. H2 emitting gas can be excited by three mechanisms: (i) fluorescent excitation through absorption of soft-UV photons in the Lyman and Werner bands (Black & van Dishoeck, 1987); (ii) collisional excitation due to the heating of the gas by the interaction of a radio jet with the interstellar medium (Hollenbach & McKee, 1989); or (iii) X-ray illumination, where X-ray photons penetrate deep into molecular clouds, warming up the interior to temperatures suitable to produce warm H2 emission. Which of these mechanisms dominate can be studied through the flux ratio of the H2 2-1 S(1) 2.247 m and 1-0 S(1) 2.121 m lines in the K-band (Reunanen et al., 2002; Rodríguez-Ardila et al., 2004; Dors et al., 2012).
The line fluxes for 2-1 S(1) and 1-0 S(1) transitions were extracted using apertures centred on the nucleus and on the southern extension. In order to estimate the continuum and background contributions, a measurement with the same aperture radius was extracted from an offset position within the SINFONI FOV, in a region without line emission. The latter was subtracted from the nuclear and southern extension measurements, to provide the final flux values.
In our case, the ratio of the 2-1 S(1) 2.247 m and 1-0 S(1) 2.121 m lines is 0.14 for the nuclear region and 0.12 for the southern extension. The values obtained for the 1-0 S(2) 2.033 m and 1-0 S(0) 2.223 m ratio were 1.95 and 1.97, respectively. According to the diagnostic diagrams presented by Dors et al. (2012), these line ratios suggest X-ray illumination as the main excitation mechanism for the molecular gas emission. This result agrees with that of Maloney et al. (1996), Dors et al. (2012) and Mezcua et al. (2015), who found that heating by X-ray emission seems to be the most important mechanism of H2 gas excitation in active galaxies. Note that the models do not distinguish the source of X-rays. In the case of an AGN, it is natural to consider the central engine as the main souce of high-ionization radiation. However, shocks between the radio-jet and the ISM can also produce extended X-ray emission and drive the observed molecular emission.
Figures 1(b) and (c) show the distribution of the molecular gas traced by H2 2.121 m emission and the soft 0.5–2 keV X-rays image taken from Chandra, respectively. In this case, the NaCo dataset was used because of its larger FOV, thus the whole extent of the molecular gas and the X-rays can be covered. The X-rays, the ionized gas traced by H+[N ii], and the molecular gas are completely co-spatial, although the molecular gas shows a warped morphology, possibly due to the rotation. The similar morphology of these extended components further supports the H2 being due to X-ray heating. In Sect. 5.3, we argue that shock excitation is necessary to explain the ionization of [Si vi] seen at pc from this AGN. Shock velocities greater than 200 km s-1 produce strong free-free X-ray emission and thus can be the cause of the observed extended X-rays and, in turn, additionally contribute to the H2 excitation.
5 The coronal-line gas
Previous works in the optical range have already shown that NGC 1386 displays strong coronal lines of [Fe vii] 5721 Å, [Fe vii] 6087 Å and [Fe x] 6374 Å (Rossa et al., 2000; Bennert et al., 2006; Rodríguez-Ardila et al., 2006). Moreover, evidence of an extended coronal emission was reported by Rossa et al. (2000) and Rodríguez-Ardila et al. (2006), who found that [Fe vii] 6087 Å is emitted in a region of 100 pc in radius from the the centre. Rodríguez-Ardila et al. (2006) also report that [Fe vii] displays a double-peaked profile, with the red peak stronger than the blue one. This result was interpreted in terms of an outflow of high-ionization gas, with the blue and red peaks representing the approaching and receding components, of the outflow, respectively. This scenario was confirmed recently by Lena et al. (2015) by means of GEMINI/GMOS IFU spectra (see below).
5.1 Morphology and kinematics
The excellent signal-to-noise (S/N) of the VLT/SINFONI datacube and wavelength coverage of the K-band spectra allow us to map, for the first time in the literature for this AGN, the morphology and kinematics of the coronal lines [Si vi] 1.963 m, [Ca viii] 2.32 m and [Al ix] 2.04 m. Figure. 6 shows the flux map constructed for the former line in the central 4 of NGC 1386. It can be seen that [Si vi] is not symmetrically distributed across the FOV, displaying two prominent regions of emission. One, characterized by a blob of in radius, centred at the AGN and slightly elongated in the NS direction. The brightest region of this component is highly elongated in the NS direction, with a size of . A second region of emission is visible to the south, starting from the southern rim of the blob and extending up to 2, very close to the southern edge of the FOV.
[Ca viii] is dominated by the blob already seen in [Si vi], with similar size and morphology found in the later. For this reason, it will not be shown here. The strong tail of emission detected in silicon, though, is not observed in calcium. [Al ix] is highly concentrated, covering a region of size .
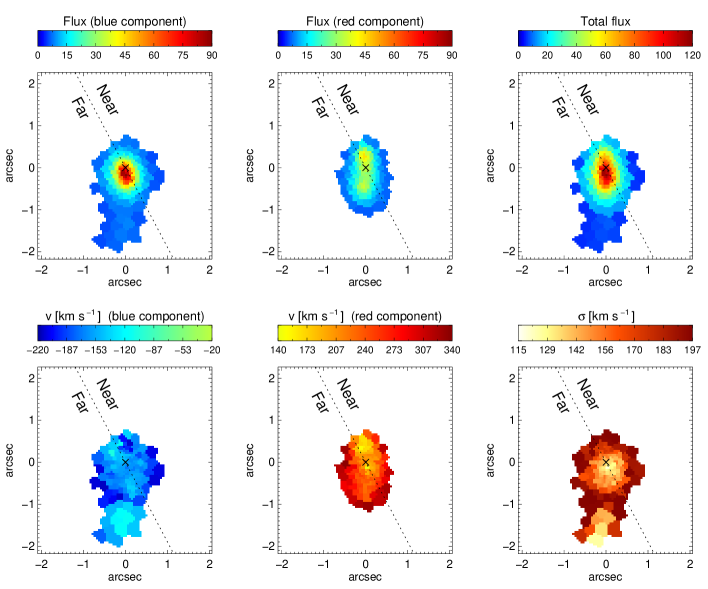
An inspection to the coronal line profiles observed in the central blob of emission reveals complex features, with most emission lines splitted in at least two components. This is illustrated in Fig. 6, which show the decomposition into blue and red components carried out to the [Si vi] line. The upper panels show the flux distribution of the blue component (left), red component (centre) and total flux (right). The gas that contributes most to the blue component is located in the central circular blob and along the extended emission to the south (seen only in [Si vi]). The region emitting the redshifted component is clearly elongated in the NS direction and spatially restricted to the blob. No hint of this emission is observed at distances larger than 1.1 to the south in none of these two lines. In [Si vi], the inner portion of the region emitting the red component has two bright spots. The strongest one is centred at 0.3 north of the nucleus while the secondary spot is at 0.45 to the south, both connected by a faint bridge of gas emission.
The central blob of emission seen in [Si vi] and [Ca viii] is very similar in size and morphology to the one seen in the [Fe vii] 6087 Å (Lena et al., 2015). They also report splitted lines, with the blue and red components distributed in a region of circular shape. Because of the higher angular resolution in SINFONI observations, we are able to disentangle physical structures not shown in their maps. Note that the extended emission to the south, seen in the blue peak of [Si vi] is not visible at all in the [Fe vii] 6087 Å map.
The velocity distribution of the blue and red components of the [Si vi] line, shown in the left and central bottom panels of Figure 6, indicate that the relative shift between the red and blue peaks remains nearly constant along the region where they are detected. On average, a separation of 350 km s-1 is measured, with random variations of 30 km s-1 at some positions. That separation in velocity is very similar to the one observed in the blue and red peaks in the [Fe vii] line (Lena et al., 2015). It suggest that the gas emitting the NIR coronal lines is co-spatial to that producing the optical iron lines.
The gas velocity dispersion for [Si vi] (bottom right panel of Figure 6) shows a minimum at the nuclear region, with km s-1. The velocity increases radially with distance, reaching values close to km s-1 at the outermost border of the central blob. This same effect is also seen in [Ca viii] in spite of the lower S/N of this line. In [Si vi], the tail to the south is characterized by low velocities, of km s-1.
In order to better visualize the relative strength, relative peak separation and velocity dispersion of the different ionic lines detected in NGC 1386, we have extracted 1-D spectra at steps of 0.2 along a pseudo-slit of 0.2 wide, crossing the AGN and oriented in the NS direction. The results are plotted in Fig. 7. North is to the right and south to the left of the position marked as “zero”, which coincides with the position of the true nucleus. In the upper panel we see the integrated flux of [Si vi] (circles), [Ca viii] (squares) and Br (triangles). For the silicon line, the blue and red curves represent the blue and red components, respectively. It can be seen that the flux distribution of each component is different, with the former being rather cuspy, displaying a nearly symmetrical distribution in the inner 1. The flux distribution of the red component has a shallow shape along the region where it is detected. In the inner 1, a small intensity gradient in flux, increasing from south to north, is apparent.
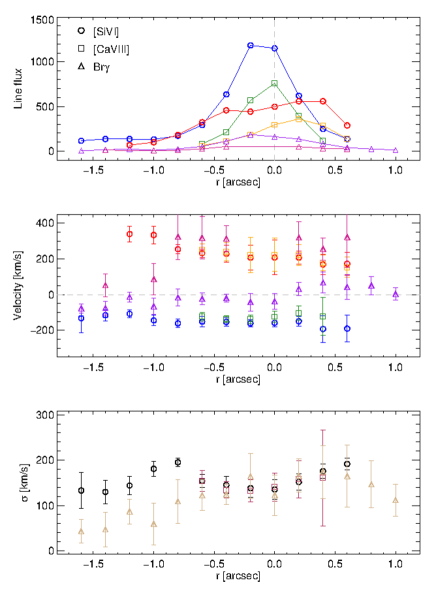
The light profile of the blue and red components of [Ca viii] (green and orange curves, respectively) follow very closely their counterparts in the [Si vi] line except for the lack of extended emission to the south, as already mentioned. Br, in contrast, behaves rather different, with a shallow light profile both in the redshifted and blueshifted components.
The second panel of Fig. 7 displays the velocity curve obtained from the blue and red components of [Si vi], [Ca viii] and Br. Two results are evident after inspection of this plot. First, the coronal gas in NGC 1386 is not rotation-dominated, in contrast to what is observed for the stellar and molecular gas, in agreement with what is often found for the kinematics of coronal line gas (Mazzalay et al., 2010, 2013; Müller-Sánchez et al., 2011). Second, the high-ionization gas lies predominantly out of the plane defined by the the molecular gas. Moreover, the constant velocity shift with distance between the approaching and receding components of the silicon and calcium lines suggests shells of gas expanding in opposite directions, with the main axis of expansion nearly aligned with the line-of-sight to the observer.
Our results strongly contrast to that found by Lena et al. (2015) for the emission gas, represented by the [N ii] 6584 Å line, the strongest emission line they analyzed. The velocity map presented for that line shows the characteristic pattern of a rotating disk upon which other components are superposed. They also found, from the velocity dispersion map, that the strongest line broadening occurs in the nuclear region and is roughly centered on the nucleus. Figs. 6 and 7 show exactly the opposite: in the nuclear region, the coronal gas displays the narrowest profiles while the broadest lines are found at from the AGN. Note, however, that Br shows a different trend to that of the coronal gas but yet different to that of [N ii]. Overall, the line profiles broaden when going from south to north, with a local minimum coincident with the location of the AGN. Further to the north after crossing the nucleus, the gas velocity dispersion behaves randomly. Note that the error bars are large, though.
5.2 Channel maps Coronal lines and low-ionization gas
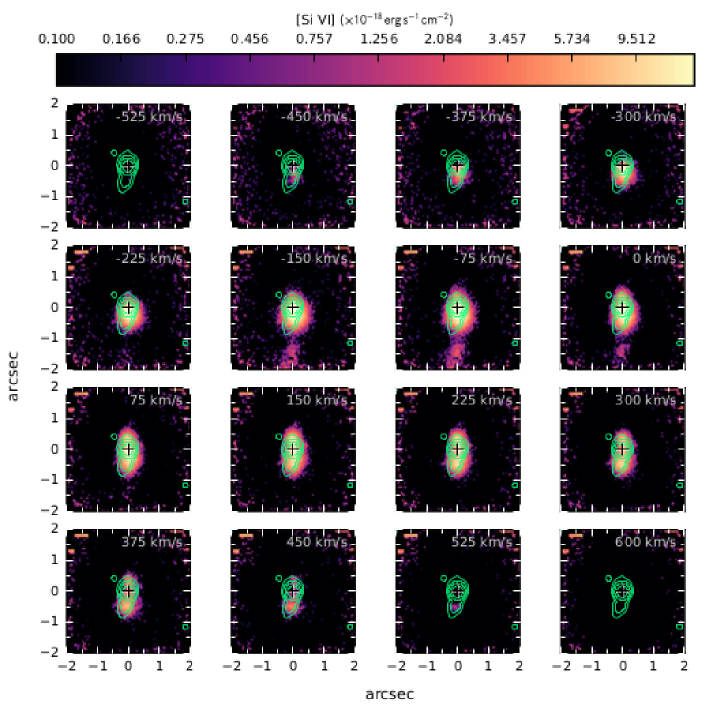
Additional information for gas the kinematics can be obtained by slicing the observed line profiles in velocity bins. The location where highly blueshifted or redshifted gas is produced can be mapped through this technique. With this in mind, channel maps for the coronal line [Si vi] as well as for Br were constructed after subtracting the systemic velocity of the galaxy. The results are shown in Figs 8 to 11.
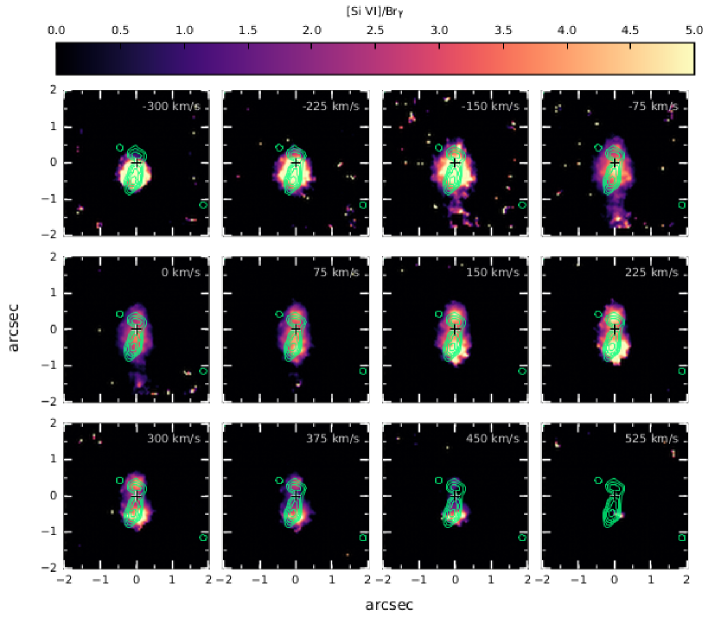
For [Si vi] (Fig 8), a velocity bin of 75 km s-1 was employed. Overlaid to each velocity channel are contours of the radio data, after subtraction of the nuclear unresolved source (see Sect. 2). We were able to map the observed [Si vi] from the very blue end, at -525 km s-1, to the red end at 600 km s-1. An inspection to Fig 8 shows that the parcel of gas associated to the redshifted component follows closely the distribution of the radio emission, from the systemic velocity up to 450 km s-1. Indeed, at this latter velocity, the ionized gas is mostly concentrated at the position coincident with the secondary radio peak south of the nucleus. The blueshifted coronal gas, on the other hand, is distributed in a nearly circular region, whose centre is offset relative to the centre of the radio emission, and in the extended tongue to the south. We interpret this result in terms of two opposite shells of gas along the line of sight, one approaching and the other moving away from the observer.
Channel maps for [Ca viii] are very similar to those of [Si vi] except that the extended emission to the south is absent. For that reason they are not shown here. The lack of the southern blob in [Ca viii] implies that the region emitting this line is rather compact. We also notice the lack of high blueshifted and redshifted gas emitting that line compared to that of the silicon. However, the relative peak separation between the blue and red peaks is similar to that of silicon in the common region where both lines are observed. This points out that the gas producing these NIR coronal lines (and very likely, the optical ones) is co-spatial. Note that the lack of high-velocity components in [Ca viii] may reflect the lower S/N around this line relative to that of [Si vi] and not due to intrinsic reasons.
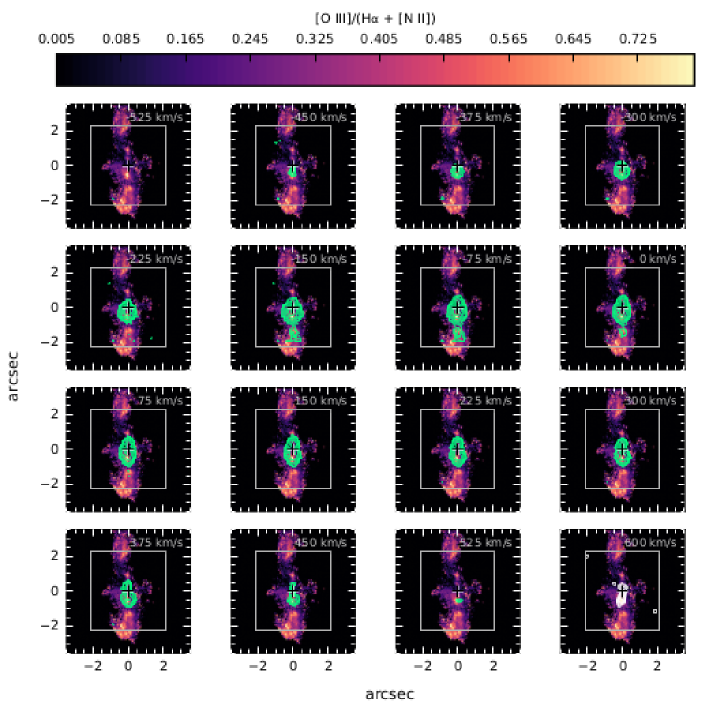
Figure 9 shows the channel maps of Fig 8 for [Si vi] but now overlaid to the excitation ratio [O iii]/H+[N ii] from WFPC2/HST imaging. A close look to the images reveal that the coronal gas follows closely the spatial distribution displayed by the optical emission, although the former is much more compact. Some regions strongly affected by dust extinction in the optical are now nicely traced by the silicon gas, particularly those located to the West and NorthWest side of the galaxy nucleus. Figure 9 also shows the excellent correspondence between the optical ionization map and the coronal gas. For instance, the hot spot located 0.5 south of the centre is clearly noticed in the [Si vi] channel maps between 225 km s-1 and 525 km s-1. Moreover, the southern tongue of [Si vi] seen in the blue component, from -224 km s-1 up to the systemic velocity, coincides with the system of blobs of emission seen in [O iii]/H+[N ii] map.
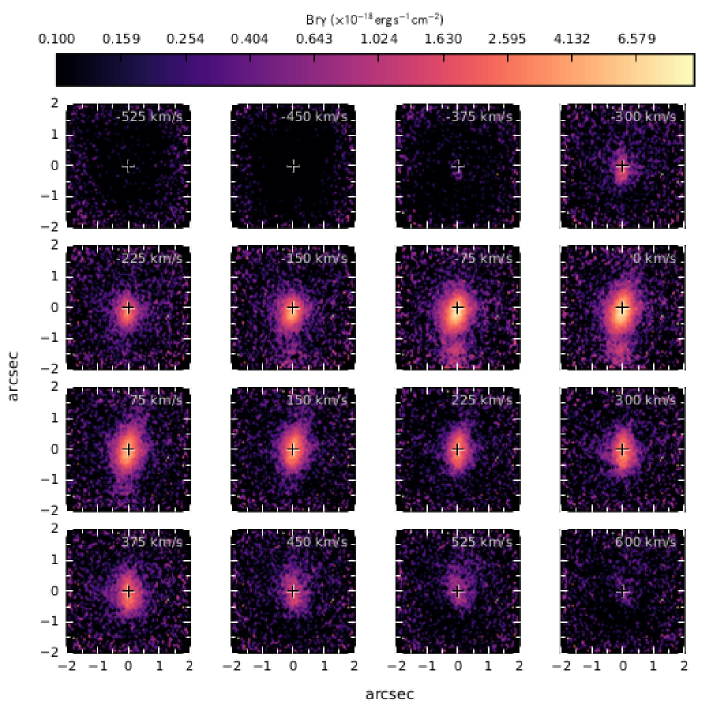
Channel maps for the Br line are shown in Figure 10. A velocity bin of 75 km s-1 was employed. It can be seen that this line is significantly narrower than [Si vi] as it extends just from -300 km s-1 to -400 km s-1. Moreover, the morphology of the emission region from -70 km s-1 to -130 km s-1 is ellipsoidal, with its major axis oriented in the NESW direction. This contrast with what is seen in the coronal lines, with the emission region either circular for the blue-peak or elongated to the south in the red peak. Br is also intrinsically fainter than [Si vi], mainly at the highest velocity bins, both in negative and positive velocities. This is seen in Figure 11, where the line ratio [Si vi]/Br is observed. This map can also be regarded as an ionization map, similar to that shown in Figure 9. However, because both lines are equally affected by extinction, the effect of dust is cancelled out here.
Figure 11 confirms the results already seen above. Three main excitation regions are clearly noticed in NGC 1386. The first one is associated to the AGN, where the presence of bright, broad wings in the [Si vi] line produces [Si vi]/Br ratios greater than 5. The second region is associated to the secondary peak of the radio-emission, at South of the AGN, where both [Si vi]/Br and [O iii]/H+[N ii] reach line ratios larger than 7 and 0.8, respectively. This hot spot is more prominent in the velocity bins 225 km s-1. Indeed, at this later velocity, several substructures are organized around the southern tip of the radio emission, suggesting shock excitation of the high-ionization lines. The third region corresponds to the extended tongue of [Si vi] South of the AGN, observed up to the edge of the IFU FOV. It coincides in position with a bright spot seen in the [O iii]/H+[N ii] map.
5.3 Photoionization by the central source vs. shocks
Observations of AGNs using IFU/AO (Müller-Sánchez et al., 2011; Mazzalay et al., 2013) have revealed extended coronal line emission up to scales of a few hundred of parsecs. This high-ionization gas is usually aligned to the radio-jet, arranged in multiple knots of emission. The complexity of the line profiles, with splitted lines, and the kinematics inferred from the data show that the coronal gas is non-rotating, most probably outflowing. This result contrasts to previous long-slit, seeing-limited observations of AGNs, where a central unresolved coronal gas emission was usually detected, leading to the picture where the these lines were formed between the NLR and the BLR (Erkens et al., 1997; Rodríguez-Ardila et al., 2002).
Rodríguez-Ardila et al. (2006) were the first to observationally resolve the coronal emission by means of optical and NIR observations. NGC 1386, one of the AGNs of their sample, displayed [Fe vii] emission with splitted profiles, not observed in low and midionization lines such as [O i] and [O iii], respectively. This, along to the high values of flux line ratios between coronal lines led them to propose that the bulk of the coronal gas was in an outflow, with the line emission powered by a combination of photoionization by the central source and local shocks produced in the interface of the outflowing gas and the ISM. The excellent angular resolution achieved here with the IFU/SINFONI data allows us to investigate more deeply these previous results since we are now able to resolve coronal gas emission at scales down to .
In order to investigate whether photoionisation by the central source can be responsible for the extended coronal line emission, we generated a grid of models using cloudy (Version C13.03 Ferland et al., 2013). Our main interest here is to find out if the observed luminosity of NGC 1386 is able to power high-ionization gas at distances as large as 140 pc from the centre. We are also interested in comparing the observed line flux ratios to those predicted by the models. Due to the reduced set of ionic lines detected in the spectral range covered by SINFONI, a robust fit to the whole coronal line region (CLR) spectrum is out of the scope of this paper. We may, however, derive general physical properties of the coronal line gas by combining NIR data with that collected in the optical range.
The input to the models include the gas density, ; the distance of the clouds to the nucleus, ; the AGN luminosity, the spectral energy distribution of the ionizing radiation, the elemental abundances, the dust/gas ratio, and the column density of the emission-line clouds. Solar abundances from Grevesse et al. (2010) were employed in all cases. The numerical abundances relative to hydrogen are as follows: He = 8.51 , C = 2.69 , O = 4.9 , N = 6.76 , Ne = 8.51 , S = 1.32 , Si = 3.24, Mg = 3.98 , and Fe = 3.16. No other values of gas metallicity were used as no reliable indicator of this variable exists using NIR lines.
The ionizing continuum employed was similar to that deduced by Mathews & Ferland (1987). It is meant to represent a typical radio-quiet AGN continuum and consists of several broken power-laws of the form with taking different values according to the wavelength range. The intrinsic luminosity of NGC 1386 above the Lyman limit was set to 2.9 erg s-1 (Sect. 1). Clouds with densities =500, = and = cm-3 were considered at distances from 0 to 120 pc, which is within the range of the observed extent of the [Si vi] and Br emission.
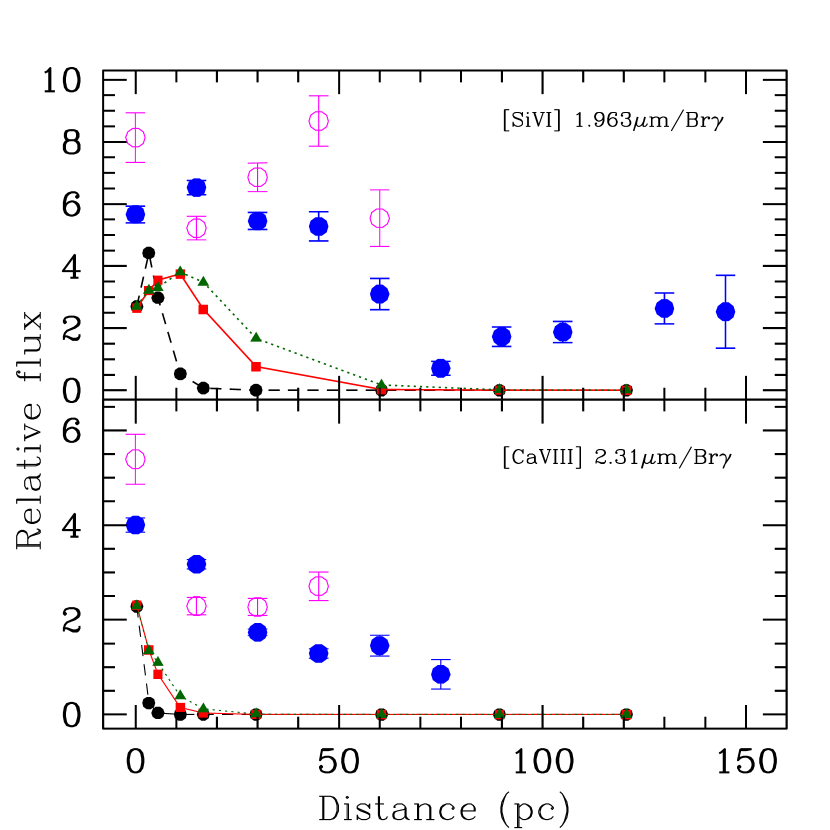
Fig. 12 shows cloudy outputs for [Si vi] (upper panel) and [Ca viii] (bottom panel) relative to Br for the three densities considered. Open circles correspond to positions North of the nucleus and full circles to those located to the South. These positions correspond to centroid position of the 1D spectra extracted along the pseudo-slit. From the figure, it is evident that no coronal emission can be produced with the assumed set of input parameters at distances larger than 50 pc. Indeed, if the density of the coronal gas is cm-3, the silicon emission region is restricted to the inner 20 pc. Only clouds with cm-3 are able to create a larger emission region, which however, is not larger than 80 pc away from the nucleus. Such low coronal gas densities, though, are unlikely to occur in this AGN. For example, Fernández-Ontiveros et al. (2016) using the Spitzer/IRS spectrum for NGC 1386, derived a value of cm-3 using the [Ne v] lines in this galaxy. Note also that the emission distribution for all clouds fall out steeply with distance. This strongly contrasts to the observations. Model predictions for [Ca viii] (bottom panel of Figure 12) also do not reproduce the VLT/SINFONI data. We see that the emission region for that ion is even more compact than that for [Si vi]. The inclusion of low density clouds ( cm-3) does not improve the fit as the size of the emission region is still restricted to the inner 20 pc. We are able to detect [Ca viii] from regions located at least 3 times farther away.
Another important drawback of the models is that under the physical conditions assumed, they are unable to produce [Fe x] and [Fe xi], even at the nucleus. These lines were clearly detected by Rodríguez-Ardila et al. (2006) by means of optical spectroscopy for NGC 1386. Moreover, [Al ix], a NIR line detected from our data is also not predicted by the pure photoionization models. It can be argued that the coronal line gas is illuminated by a harder continuum that the one we see. We tested this possibility by computing models where the central source is 10, 100 and 1000 times more luminous than the fiducial value adopted while keeping the other parameters fixed. The results show that NGC 1386 would need to be at least 100 times more luminous to solve the caveat of producing higher line flux ratios to match the observations. However, even under this scenario, the [Si vii] region does not extend beyond 80 pc, in a clear disagreement with the observations.
Photoinization by the central source alone may explain the lines ratios (within a factor of 2x) [Si vi]/Br and [Ca viii]/Br at the nucleus and in the inner few tens of parsecs away. However, at distances larger than 50 pc, model outputs largely underpredicts our observations. This result suggests that additional processes should be present at these locations to enhance the high-ionization spectrum. The characteristic double-peak line profiles seen in the ionized gas can be taken as kinematic evidence for outflows in the NLR of NGC 1386. The fact that the extended emission runs aligned to the observed radio-jet suggests that part of the gas ionization may be directly influenced by that component. Thus, it makes sense to consider the role of shocks produced by interactions between the radio jet or a radially accelerated outflow and the ISM. Rodríguez-Ardila et al. (2006) had already found strong evidence of shocks powering the coronal gas emission in NGC 1386 based on the observed ratios between the optical coronal lines [Fe vii], [Fe x] and [Fe xi].
The models of Contini & Viegas (2001, hereafter CV01) are useful to test the scenario of shocks coupled to photoionization by the central source; even in the presence of shocks, the effect of the central continuum cannot be ignored. In their modelling, CV01 considered that the clouds are moving outwards from the galaxy centre, with the shock front forming on the outer edge of the cloud, whereas the ionizing radiation reaches the opposite edge that faces the active centre. The ionization due to both the primary radiation (from the central source) and the diffuse radiation generated by the free-free and free-bound transitions of the shocked and photoionized gas, as well as the collisional ionization, are all accounted for. The shock velocity and the ionizing flux from the central source at the Lyman limit reaching the cloud, (in units of cm-2 s-1 eV-1), are the main input parameters. Other parameters include the pre-shock density, , and the pre-shock magnetic field, .
Tables 1 to 12 of CV01 show that shock-dominated clouds ( = 0) with shock velocities in the range 300 500 km s-1 strongly favour the production of [Si vi]. They predict [Si vi]/Br] ratios between 13 and 2.1, for = 300 and 500 km s-1, respectively. In these models, solar metallicity, = 300 cm-3 and B0 = 10-4 Gauss were adopted. When coupled to the presence of the radiation field from the central source (e.g. log = 12, models 62 and 83), the value of that ratio, for the same two velocities above, are 0.2 and 1.7, respectively). These values are rather consistent with our observations. They match the measured line flux ratio of 2 for [Si vi]/Br in the extended region to the South. Because shocks strongly impact the gas ionization locally, its effects are independent to the distance from the central source. In regions where photoionization by the central source alone is not able to produce coronal lines, shocks are a possibility that should be considered. We found strong support to this scenario, and for the first time find consistent proofs that the well-defined extended coronal emission to the south is powered by this mechanism. Note that we cannot discuss the results for [Ca viii] because that line is not available in CV01’s results.
We are aware that the shock model coupled to radiation from the central source predictions provide us with only a first-order approximation. A full description of the CL region based on model-fitting is far beyond the scope of this paper. However, our data provide us with solid evidence of the necessity of shocks coupled to photoinization by the AGN in order to reproduce CL flux ratios at distances as far as 120 pc, where photoionization by the central source predicts no or very faint CL emission. The superior angular and spectral resolution of the VLT/SINFONI observations confirms the previous results by Rodríguez-Ardila et al. (2006) for the presence of shocks in NGC 1386, based on an independent set of coronal lines. Unrealistic physical conditions need to be assumed for the gas if we want to explain the observed high-ionization lines in terms of only one mechanism.
5.4 AGN-driven outflows traced by the coronal gas
We use the velocity and the angularly resolved morphology of the outflowing [Si vi] coronal gas to derive the mass outflow rate and the mechanical power inserted in the ISM. Assuming a shell morphology of (), an outflow velocity of with a velocity dispersion of , the mass outflow rate and the mechanical power can be derived in the following way:
| (1) | ||||
where corresponds to the proton mass, and refer to the length and the width of the blob, respectively. A density of (error interval –) was derived by Fernández-Ontiveros et al. (2016) from the [Ne v] 24.3m/[Ne v] 14.3m line ratio measured with Spitzer/IRS in the high-spectral resolution mode. The largest uncertainties in the mass outflow rate and the mechanical power estimates come from the gas filling factor (), widely discussed in the literature. Müller-Sánchez et al. (2013) assume based on the relation found by Oliva (1997) for the coronal line gas. However, theoretical and observational arguments presented by Sharp & Bland-Hawthorn (2010) showed that for ionized gas winds in nearby AGN and starburst galaxies a higher value of is needed. They, indeed, found out that is likely distributed over the interval . This result is in agreement with previous estimates made by Blustin & Fabian (2009). They used constraints imposed by the observed radio emission to obtain upper limits to the volume filling factors of wind components in nearby AGN. Alternatively, if the outflow is considered as a violent blast of gas, as in the case of supernovae explosions, higher values may be expected for the hot coronal gas (, e.g. Li et al., 2015). For this work, we adopt a conservative value of .
With the above assumptions, the outflow mass rate of coronal gas derived from Eq. 1 is , a total of if we consider both the redshifted and the blueshifted components. The associated kinetic power of the redshifted component is , and a total of including also the blueshifted component, which is of the total radiative energy (). An upper limit to the kinetic energy can be obtained from the terminal velocity observed in the channel maps of [Si vi] (Fig. 8), , which results in . For a radio core luminosity of at (derived from at and , , from Fernández-Ontiveros et al. 2012), the kinetic outflow energy measured for the coronal gas would be in agreement with an extrapolation of the Merloni & Heinz (2007) relation at low luminosities.
5.5 The inflow rate traced by H2
The total molecular gas mass available was estimated from the H2 2.121 m 1-0 S(1) luminosity. Determining the total gas mass requires first the conversion of H2 luminosity to warm H2 gas mass and second, the conversion from warm to cold gas mass. Here we use the conversion from Mazzalay et al. (2013):
| (2) |
where is the luminosity of the H2 2.121 m emission integrated in the apertures described in Sect. 4.2 using a distance of 15.3 Mpc (Jensen et al., 2003). Figure 5 suggests some systematic residuals from rotation, albeit in the noise level, of km s-1. Taking this figure as an upper limit to any radial motion in molecular gas, assuming a density of cm-3 (Dors et al., 2012), and a filling factor of ; we derive an upper limit for the inflow mass rate of using Eq. 1.
6 Discussion
In this section we will envisionage the most plausible scenario for the ionized gas in NGC 1386 based on the observed morphology, kinematics and the flux distribution presented in the previous sections. We have already shown that the morphology of the high and low ionization gas in the central 100 pc is preferentially elongated towards North and South of the nucleus with a somewhat peanut shape. The kinematics of the coronal gas shares the same velocity amplitude, 200 km s-1, regardless of its location relative to the nucleus. The simplest explanation to this configuration is that of a pair of nuclear outflowing shells, one getting away from us with positive velocities and its counterpart moving towards us with negative velocities. Effectively, we see one on top each other as projected on the sky and across the nucleus, so that any point in the shell in the NS direction across the nucleus has about the same velocity, 200 km s-1, for the receding shell and 175 km s-1, the approaching one (see Fig. 7).
These expanding shells, which are about bisected by the nucleus, are presumably driven by the AGN radiation pressure or mechanically by a jet. NGC 1386 is a low Eddington source, (Fernández-Ontiveros et al., 2012), and thus radiation-driven winds are not expected to be its dominant output energy channel (e.g. Schartmann et al., 2014). Low Eddington sources are often powerful radio sources, best prototype is M87 (Prieto et al., 2016, and references therein), and thus a jet in NGC 1386 is a plausible cause of the outflowing shells. NGC 1386 shows extended radio emission at each side of the nucleus along the N-S direction, the Southern emission being better defined and detached-from-the-core while the northern one appears as a protuberance. The peak of emission to the South in the positive velocity bins shows a remarkable coincidence in morphology and location in the [Si vi], [Si vi]/Br and [O iii]/H channel maps (see Figs. 8 to 11). The similarity in morphology leads us to conclude that the extended radio emission is due to synchrotron emission generated locally downstream the front shock created between the jet and the ISM by e.g. the Fermi mechanism. An alternative N-S two-side jet scenario may still produce the receding and approaching gas shells by pushing material laterally in directions perpendicular to the jet orientation. However, it may not be expected in this case the jet morphology to coincide with that of the gas. A second problem is that the jet component pointing towards us, which in this scenario would be the Southern extended radio emission, would be expected to coincide with the blueshifted rather than the redshifted gas.
We propose that a core jet coinciding with the central radio source (Sect. 2) moving in the line of sight causes respective front shocks that we identify with the receding and approaching shells. The jet kinetic power transferred to the gas yields gas bulk velocities of up to 450 km s-1. Main locations where the energy transfer occurs are identified at 30 40 pc from the centre coinciding with the maxima in [Si vi]/Br, [O iii]/H+[N ii], X-rays and radio. Momentum transfer becomes ineffective at larger distances to drive a wind: a second excitation peak in coronal gas is seen at 150 pc south of the nucleus, coinciding with the negative velocity channels. The gas velocities are, however, of the same magnitude as those of the galaxy disk at that location. We thus conclude that the radius of influence of the jet to drive a wind is restricted to distances not larger than 50 pc the size of the observed central coronal gas emission. On these basis, the estimated bulk kinetic power transferred by the jet to the ISM within the central 50 pc is (/0.1) erg s-1, with being the filling factor, or 6% of NGC 1386 radiative bolometric luminosity. If the filling factor is close to 1, which is probably the case taking into account the strength of the coronal emission and its spatially-resolved morphology, the transferred mechanical power may then surpass the radiative luminosity of the AGN. This in turn implies that low Eddington sources as NGC 1386, although poor radiators, can however be efficient droppers of kinetic energy in to the ISM.
When compared to more powerful Seyfert-type AGN for which a similar coronal line energy budget has been produced (Müller-Sánchez et al., 2011), their ratio of kinetic to bolometric energy is slightly lower by few percent up to an order of magnitude. Their Seyfert sample has bolometric luminosities one to two order of magnitude higher than that of NGC 1386, but the inferred kinetic power is also higher by factor 3 to an order of magnitude. The way the kinetic power is derived by these authors differs from ours in two assumptions: (i) a filling factor 2-dex lower than the one used here; ii the bulk of outflow mass moving at the maximum observed velocity is about one order of magnitude higher than it is observed as predicted by their biconical outflow model. In this way, the mass outloaded into the medium may be overestimated. Therefore, the inferred kinetic power in this sample of powerful AGN should be taken as an upper limit. In the present case, the remarkable well defined shell morphology of the outflowing gas traced by its constant velocity with radius, makes the present estimate robust and independent of model assumptions.
The resulting mechanical power in the shells represents, in turn, a lower limit to the total mechanical power of the putative jet. Assuming a 10% efficiency in the transfer of jet power to the medium, the jet kinetic power may rise to 1043 erg s-1.
Our scenario is consistent with the kinematics of the optical ionized gas presented in Lena et al. (2015). The 2D kinematics of [N ii] 6584 Å discussed by these authors is decoupled into 3 components that we interpret as follows: a rotating disc in the plane of the galaxy, which we associate with the H2 disc discussed in Sect. 4; a broad component, associated with strong nuclear line emission. It is confined within 1 from the nucleus, but shows some extension out to approximately 2. This component is the one we associate to the expanded shells of ionized gas; a third component that involves rotation and/or outflow and extends to approximately 2 ( 200 pc) either side of the nucleus. We associate it to the extended southern tongue of high-ionized gas.
The outflowing gas is expected to be accelerated by the jet-driven shocks. This scenario is supported by the strong the coronal emission. Photoionization models, where the main source of ionization is the central source, are unable to explain the observed ratios [Si vi]/Br and [Ca viii]/Br. Indeed, no emission at all is predicted at distances larger than a few tens of parsecs, in contrast to the observations. The jet-driven shocks could also be responsible for the observed extended X-rays emission. Therefore, independent evidence of a shock-driven NLR is inferred from the analysis of the gas excitation.
7 Summary
This paper reports the first detection of powerful mass outflows in a low luminosity AGN, erg s-1. The outflow is inferred from the coronal line gas, specifically the [Si vi] and the [Ca viii] lines, which are spatially and kinematically resolved within the central 150 pc down to 15 pc from the centre. The outflow has the shape of a two expanding ionized gas shells moving in opposite directions relative to the nucleus and along our line of sight.
We propose that these expanding shells are driven mechanically by the NGC 1386 incipient core jet. The kinematics of the ionized gas is distinctive from that of the molecular H2, and of Br to a lesser extend, which shares regular rotation with the stellar component albeit in a different disc inclination. The lack of rotation in the coronal gas, in addition to the very small gradient in velocity measured between the edges of the shells indicate that we are seeing a swept layer of material accelerated by the radio-jet. The shocks produced by the jet into the medium account for the ionization/excitation of the coronal gas from the nucleus up to 120 pc. Nuclear photoionization is found too weak to explain the size of the emission region and strength of the high-ionization gas. Shocks furthermore also account for the nuclear H2 line ratios measured. We propose that the same mechanism accounting for the extended soft X-ray emission that encloses the expanding shells is also responsible for the radio emission that is co-spatial with the receding expanding shell.
The morphology and location of the shells at a few tens of parsec from the centre allows us to get a first-order estimate of the outflow mass rate of 11 M⊙ yr-1, which is among the largest estimated in counterpart powerful AGNs. We get a tentative inflow rate from the H2 gas of M⊙ yr-1, more than an order of magnitude lower than the outflow rate. This result is common to other AGN, implying that the outflowing material comes from the nuclear surroundings. We find that the momentum transfer of the jet to drive the outflow is limited to a radius of influence of pc from the centre as we show that the coronal gas is already circularized to the velocities of the galaxy disk at those locations.
The kinetic energy deposited by the outflow into the medium is erg s-1, % of the bolometric luminosity. An order of magnitude higher is predicted if the gas filling factor is close to 1, which it may well be the case taking into account the strength and uniformity of the coronal emission in the shells. Models of quasar evolution require about 5% of Lbol to explain the BH mass – bulge mass correlation. We show that this energy boundary is achievable by a galaxy 3 to 4 orders of magnitude less powerful – radiatively – than a quasar. Due to its condition of early type galaxy, in galaxy evolution scenarios, NGC 1386 has presumably passed its quasar phase and is now getting in the later activity stages, which is usually characterized by a Low-luminosity AGN. This work shows that low Eddington sources as NGC 1386, although poor radiators, can however be efficient droppers of kinetic energy into the ISM.
Acknowledgments
We are grateful to the anonymous Referee for helpful suggestions to improve this manuscript. A.R-A. acknowledges the Conselho Nacional de Desenvolvimento Científico e Tecnológico, CNPq. through grant 311935/2015-0) and to the Severo Ochoa Program for partial support to this work. F. M-S. acknowledges financial support from NASA HST Grant HST-AR-13260.001.
References
- Bennert et al. (2006) Bennert, N., Jungwiert, B., Komossa, S., Haas, M., Chini, R. 2006, A&A, 446, 919
- Braatz et al. (1996) Braatz, J. A., Wilson, A. S., Henkel, C. 1996, ApJS, 106, 51
- Black & van Dishoeck (1987) Black, J.H., & van Dishoeck, E.F. 1987, ApJ, 322, 412
- Blustin & Fabian (2009) Blustin, A. J., Fabian, A. C. 2009, MNRAS, 396, 1732
- Burtscher et al. (2015) Burtscher, L., Orban de Xivry, G., Davies, R.I., et al. 2015, A&A, 578, A47
- Cappellari & Emsellem (2004) Cappellari, M., & Emsellem, E. 2004, PASP, 116, 138
- Condon et al. (1998) Condon, J. J., Yin, Q. F., Thuan, T. X., Boller, Th. 1998, AJ, 116, 2682
- Contini & Viegas (2001) Contini, M., & Viegas, S. M. 2001, ApJS, 132, 211
- Crenshaw & Kraemer (2005) Crenshaw, D. M., Kraemer, S. B. 2005, ApJ, 625, 680
- Davies et al. (2014) Davies, R. I., Maciejewski, W., Hicks, E. K. S., Emsellem, E., Erwin, P., et al. 2014, ApJ, 792, 101
- Dors et al. (2012) Dors, O.L., Jr., Riffel, R.A., Cardaci, M.V., et al. 2012, MNRAS, 422, 252
- Eisenhauer et al. (2003) Eisenhauer, F., Abuter, R., Bickert, K., Biancat-Marchet, F., Bonnet, H. et al. 2003, SPIEE, 4841, 1548
- Erkens et al. (1997) Erkens, U., Appenzeller, I., Wagner, S. 1997, A&A, 323, 707
- Ferland et al. (2013) Ferland, G. J., Porter, R. L., van Hoof, P. A. M., Williams, R. J. R., Abel, N. P., et al. 2013, Rev. Mex. Astron. Astrofis., 49, 137
- Fernández-Ontiveros et al. (2012) Fernández-Ontiveros, J.A., Prieto, M.A., Acosta-Pulido, J.A., & Montes, M. 2012, Journal of Physics Conference Series, 372, 012006
- Fernández-Ontiveros et al. (2016) Fernández-Ontiveros, J.A., Spinoglio, L., Pereira-Santaella, M., et al. 2016, ApJS, 226, 19
- Ferruit et al. (2000) Ferruit, P., Wilson, A. S., Mulchaey, J. 2000, ApJS, 128, 139
- García-Rissmann et al. (2005) García-Rissmann, A., Vega, L. R., Asari, N. V., Cid Fernandes, R., Schmitt, H., et al. 2005, MNRAS, 359, 765
- Grevesse et al. (2010) Grevesse, N., Asplund, M., Sauval, A. J., & Scott, P. 2010, Ap&SS, 328, 179
- González-Martín et al. (2015) González-Martín, O., Masegosa, J., Márquez, I., et al. 2015, A&A, 578, A74
- Heckman et al. (2002) Heckman, T. M., Norman, C. A., Strickland, D. K., Sembach, K. R. 2002, ApJ, 577, 691
- Hicks et al. (2013) Hicks, E. K. S.; Davies, R. I.; Maciejewski, W.; Emsellem, E.; Malkan, M. A.;
- Hollenbach & McKee (1989) Hollenbach, D., & McKee, C.F. 1989, ApJ, 342, 306
- Ho (2008) Ho, L. C. 2008, ARA&A, 46, 475
- Jensen et al. (2003) Jensen, J. B., Tonry, J. L., Barris, B. J., Thompson, R. I., Liu, M. C., et al. 2003, ApJ, 583, 712
- Lena et al. (2015) Lena, D., Robinson, A., Storchi-Bergman, T., Schnorr-Müller, A., Seelig, T., et al. 2015, ApJ, 806, 84
- Li et al. (2015) Li, M., Ostriker, J.P., Cen, R., Bryan, G.L., & Naab, T. 2015, ApJ, 814, 4
- Maloney et al. (1996) Maloney, P.R., Hollenbach, D.J., & Tielens, A.G.G.M. 1996, ApJ, 466, 561
- Mathews & Ferland (1987) Mathews, W. G., & Ferland, G. J. 1987, ApJ, 323, 456
- Mazzalay et al. (2010) Mazzalay, X., Rodríguez-Ardila, A., Komossa, S. 2010, MNRAS, 405, 1315
- Mazzalay et al. (2013) Mazzalay, X., Saglia, R.P., Erwin, P., et al. 2013, MNRAS, 428, 2389
- Mazzalay et al. (2013) Mazzalay, X., Rodríguez-Ardila, A., Komossa, S., & McGregor, P.J. 2013, MNRAS, 430, 2411
- Mazzalay et al. (2014) Mazzalay, X., Maciejewski, W., Erwin, P., et al. 2014, MNRAS, 438, 2036
- Merloni & Heinz (2007) Merloni, A., & Heinz, S. 2007, MNRAS, 381, 589
- Mezcua et al. (2015) Mezcua, M., Prieto, M.A., Fernández-Ontiveros, J.A., et al. 2015, MNRAS, 452, 4128
- Morganti et al. (2005) Morganti, R., Oosterloo, T. A., Tadhunter, C. N., van Moorsel, G., Emonts, B. 2005, A&A, 439, 521
- Mouri (1994) Mouri, H. 1994, ApJ, 427, 777
- Müller-Sánchez et al. (2011) Müller-Sánchez, F., Prieto, M. A., Hicks, E. K. S., Vives-Arias, H., Davies, R. I., et al. 2011, ApJ, 739, 69
- Müller-Sánchez et al. (2013) Müller-Sánchez, F., Prieto, M.A., Mezcua, M., Davies, R. I., Malkan, M. A., et al. 2013, ApJ, 763, L1
- Mundell et al. (2009) Mundell, C.G., Ferruit, P., Nagar, N., & Wilson, A.S. 2009, ApJ, 703, 802
- Nelson & Whittle (1995) Nelson, C. H., Whittle, Mark. 1995, ApJS, 99, 67
- Oliva (1997) Oliva, E. 1997, IAU Colloq. 159: Emission Lines in Active Galaxies: New Methods and Techniques, 113, 288
- Orienti & Prieto (2010) Orienti, M., & Prieto, M.A. 2010, MNRAS, 401, 2599
- Penston et al. (1984) Penston, M. V., Fosbury, R. A. E., Boksenberg, A., Ward, M. J., Wilson, A. S. 1984, MNRAS, 208, 347
- Phillips & Frogel (1980) Phillips, M. M., Frogel, J. A. 1980, ApJ, 235, 761
- Prieto et al. (2014) Prieto, M.A., Mezcua, M., Fernández-Ontiveros, J.A., & Schartmann, M. 2014, MNRAS, 442, 2145
- Prieto et al. (2016) Prieto, M. A., Fernández-Ontiveros, J. A., Markoff, S., Espada, D., González-Martín, O. 2016, MNRAS, 457, 3801
- Reunanen et al. (2002) Reunanen J., Kotilainen J. K., & Prieto M. A., 2002, MNRAS, 331, 154
- Rodríguez-Ardila et al. (2002) Rodríguez-Ardila, A., Viegas, S., Pastoriza, M.G., Prato, L. 2002, A&A, 579, 214
- Rodríguez-Ardila et al. (2004) Rodríguez-Ardila, A., Pastoriza, M.G., Viegas, S., Sigut, T.A.A., & Pradhan, A.K. 2004, A&A, 425, 457
- Rodríguez-Ardila et al. (2006) Rodríguez-Ardila, Alberto; Prieto, M. Almudena; Viegas, Sueli; Gruenwald, Ruth. 2006, ApJ, 653, 1098
- Rossa et al. (2000) Rossa, J., Dietrich, M., Wagner, S. J. 2000, A&A, 362, 501
- Sadler et al. (1995) Sadler, E. M., Slee, O. B., Reynolds, J. E., Roy, A. L. 1995, MNRAS, 276, 1373
- Sharp & Bland-Hawthorn (2010) Sharp, R.G., & Bland-Hawthorn, J. 2010, ApJ, 711, 818
- Schartmann et al. (2014) Schartmann, M., Wada, K., Prieto, M. A., Burkert, A., Tristram, K. R. W. 2014, MNRAS, 445, 3878
- Schulz & Henkel (2003) Schulz, H., Henkel, C. 2003, A&A, 400, 41
- Sternberg (1988) Sternberg, A. 1988, ApJ, 332, 400
- Véron-Cetty & Véron (2010) Véron-Cetty, M.-P., & Véron, P. 2010, A&A, 518A, 10
- Veilleux et al. (2005) Veilleux, Sylvain; Cecil, Gerald; Bland-Hawthorn, Joss. 2005, ARA&A, 43, 769
- Xanthopoulos (1996) Xanthopoulos, E. 1996, MNRAS, 280, 6