Chemical complexity induced by efficient ice evaporation in the Barnard 5 molecular cloud
Cold gas-phase water has recently been detected in a cold dark cloud, Barnard 5 located in the Perseus complex, by targeting methanol peaks as signposts for ice mantle evaporation. Observed morphology and abundances of methanol and water are consistent with a transient non-thermal evaporation process only affecting the outermost ice mantle layers, possibly triggering a more complex chemistry. We present the detection of the Complex Organic Molecules (COMs) acetaldehyde (CH3CHO) and methyl formate (CH3OCHO) as well as formic acid (HCOOH) and ketene (CH2CO), and the tentative detection of di-methyl ether (CH3OCH3) towards the methanol hotspot of Barnard 5 located between two dense cores using the single dish OSO 20m, IRAM 30m, and NRO 45m telescopes. The high energy cis- conformer of formic acid is detected, suggesting that formic acid is mostly formed at the surface of interstellar grains and then evaporated. The detection of multiple transitions for each species allows us to constrain their abundances through LTE and non-LTE methods. All the considered COMs show similar abundances between and % relative to methanol depending on the assumed excitation temperature. The non-detection of glycolaldehyde, an isomer of methyl formate, with a [glycolaldehyde]/[methyl formate] abundance ratio lower than 6 %, favours gas phase formation pathways triggered by methanol evaporation. According to their excitation temperatures derived in massive hot cores, formic acid, ketene, and acetaldehyde have been designated as “lukewarm” COMs whereas methyl formate and di-methyl ether were defined as “warm” species. Comparison with previous observations of other types of sources confirms that “lukewarm” and “warm” COMs show similar abundances in low-density cold gas whereas the “warm” COMs tend to be more abundant than the “lukewarm” species in warm protostellar cores. This abundance evolution suggests either that “warm” COMs are indeed mostly formed in protostellar environments and/or that “lukewarm” COMs are efficiently depleted by increased hydrogenation efficiency around protostars.
Key Words.:
Astrochemistry, ISM: abundances, ISM: clouds, ISM: molecules, Molecular processes, Stars: formation1 Introduction
It is known for more than a decade that the early stages of low-mass star formation are rich in interstellar complex organic molecules (COMs, i.e. molecules based on carbon chemistry and with six atoms or more; Herbst & van Dishoeck 2009) since the detection of several saturated COMs by Cazaux et al. (2003) and Bottinelli et al. (2004a, 2007) towards nearby bright Class 0 protostars with sub-millimeter single-dish telescopes. Subsequent interferometric observations of Class 0 protostars confirmed that the emission of COMs mostly originates from the inner warm regions of protostellar envelopes, the so-called hot corinos, the low-mass counterparts of the massive hot cores (Bottinelli et al., 2004b; Kuan et al., 2004; Jørgensen et al., 2005, 2011; Maury et al., 2014; Taquet et al., 2015).
The current scenario explaining the detection of warm ( K) COMs surrounding protostars is mostly based on grain surface chemistry followed by “hot core” gas phase chemistry. In this paradigm, cold ( K) ices, containing the first “parent” organic molecules like formaldehyde H2CO and methanol CH3OH and eventually several other COMs (e.g. ethanol C2H5OH, or ethylene glycol (CH2OH)2), are formed at the surface of interstellar grains in dark clouds by atom additions on cold dust. It has been hypothesized that more complex molecules could also be formed in lukewarm (30 K 80 K) ices through the recombination of radicals produced by the UV photolysis of the main ice components during the warm-up phase in protostellar envelopes. All the ice content is then evaporated into the gas phase when the temperature exceeds 100 K (Garrod & Herbst, 2006; Garrod et al., 2008). Ion-neutral chemistry triggered by the evaporation of ices, in which ammonia plays a key role, could also be important for the formation of abundant COMs, such as methyl formate CH3OCHO or di-methyl ether CH3OCH3 (Taquet et al., 2016).
The detection of cold methanol, ketene CH2CO, acetaldehyde CH3CHO, or formic acid HCOOH observed in dark clouds for several decades (Matthews et al., 1985; Friberg et al., 1988; Irvine et al., 1989, 1990; Ohishi & Kaifu, 1998) can be explained by the cold surface chemistry scenario mentioned previously followed by non-thermal evaporation processes. However, the UV-induced scenario of COM formation on lukewarm ( K) interstellar grains, invoked to produce methyl formate and di-methyl ether, cannot explain the recent first clear detection by Bacmann et al. (2012) of these two species in a cold ( K) prestellar core, L1689B, shielded from strong UV radiation. Several COMs have also been detected by Öberg et al. (2010) and Cernicharo et al. (2012) towards the core B1-b. However, more recent interferometric observations suggest that the molecular emission should rather come from nearby protostars, hydrostatic core candidates and outflows (see Gerin et al., 2015). More recently, Vastel et al. (2014) and Jiménez-Serra et al. (2016) also detected CH3OH, HCOOH, CH2CO, CH3CHO, CH3OCHO, and CH3OCH3 towards the prestellar core prototype L1544. A non-LTE analysis of the methanol emission towards L1544 suggests that the emission from COMs would mostly originate from the external part of the core, with an intermediate density cm-3 (Vastel et al., 2014). However, subsequent observations of methanol towards 8 other prestellar cores by Bacmann & Faure (2016) suggest that the cold methanol emission could be associated with denser ( cm-3) gas.
New chemical pathways have been proposed to explain the detection of COMs towards these cold regions. Vasyunin & Herbst (2013) and Balucani et al. (2015) introduced neutral-neutral gas phase reactions triggered by the non-thermal evaporation of methanol assumed to be mostly formed at the surface of grains whilst Reboussin et al. (2014) investigated the effect of heating by cosmic-rays on the surface formation of COMs. Fedoseev et al. (2015) and Chuang et al. (2016) experimentally showed that surface hydrogenation of CO at low ( K) temperatures leads to the detection of several COMs through recombination of radicals whose production is triggered by abstraction reactions of formaldehyde and methanol. However, these experiments tend to produce more glycolaldehyde and ethylene glycol, not yet detected towards dense clouds, than methyl formate whilst di-methyl ether cannot be efficiently produced in their experimental setup.
COMs have been detected towards only a few dark cloud regions so far. In this work, we aim at investigating the level of chemical complexity in the so-called ”methanol hotspot” region of the Barnard 5 molecular cloud, one of the two molecular clouds with L1544 where cold water vapour has been detected with Herschel (Caselli et al., 2010, 2012; Wirstrom et al., 2014), by observing mm-emission from COMs with single-dish telescopes. This region, offset from any infrared sources, shows a high abundance of methanol and water attributed to transient evaporation processes (see Wirstrom et al., 2014). Section 2 describes our observational campaign focusing on detecting oxygen-bearing COMs. Section 3 presents the spectra and the analysis to derive column densities and abundances. Section 4 discusses the results.
2 Observations
2.1 The “methanol hotspot” in Barnard 5
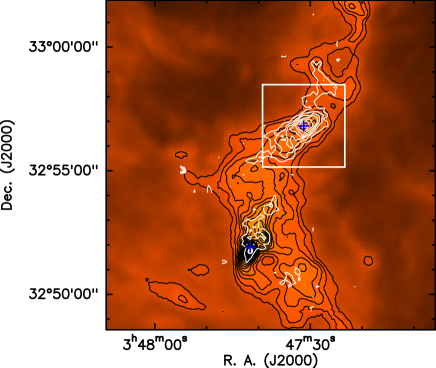
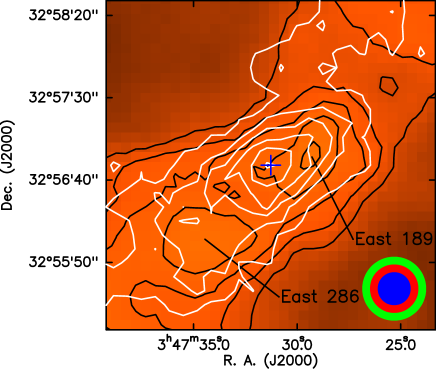
The Barnard 5 (B5) dark cloud is located at the North-East of the Perseus complex (235 pc; Hirota et al., 2008). It contains four known protostars of which the most prominent is the Class I protostar IRS1. SCUBA continuum emission maps at 850 m carried out with the JCMT only revealed dust emission towards known protostars and at about 2-4 arcmin north from IRS 1 (Hatchell et al., 2005) whilst molecular maps of CO, NH3, and other species show several chemically differentiated clumps (S. B. Charnley in preparation). Methanol emission in B5 displays a particularly interesting distribution since it shows a bright so-called “methanol hotspot” at about 250 arcsec North-West from IRS 1, a region showing no infrared sources and no detected sub-mm continuum emission (see Fig. 1 in Hatchell et al., 2005; Wirstrom et al., 2014). The subsequent detection of abundant water, with absolute abundances of about , with the Herschel Space Observatory by Wirstrom et al. (2014) suggests that efficient non-thermal processes triggering the evaporation of icy methanol and water are at work. The “methanol hotspot” therefore represents an ideal target to detect cold COMs in dark clouds since they are supposed to be formed from methanol, either at the surface of interstellar grains, or directly in the gas phase after the evaporation of methanol. The Perseus molecular cloud was recently mapped with Herschel as part as the Gould Belt Survey key program (André et al., 2010) using the photometers PACS and SPIRE in five bands between 70 m and 500 m. Figure 1 presents the Barnard 5 molecular cloud as seen by Herschel/SPIRE at 250 m. The Herschel data has been retrieved from the Herschel Science Archive. The data were calibrated and processed with the Herschel pipeline and are considered as a level-3 data product. Dust emission is compared with the integrated intensity map of the A+-CH3OH transition as observed with the IRAM 30m telescope (this work). The “methanol hotspot” is located between the two dense cores East 189 and East 286 (Sadavoy, private communication) revealed by Herschel for the first time, and the methanol emission peaks at the edge of core East 189. East189 and East286 have the following properties derived through a fitting of their observed Spectral Energy Distribution: , K, pc, cm-3, and , K, pc, cm-3 (Sadavoy, 2013).
2.2 Observational details
We targeted several COMs in different frequency bands at 3 mm using the NRO 45m, IRAM 30m, and OSO 20m telescopes and CH3OH in two frequency bands at 2 mm using the IRAM 30m towards the methanol hotspot at R.A. = 3h47m32s.10, decl = +32d56m43s.0. Table 1 summarises the properties of our observational data.
Observations with the NRO 45m telescope were carried out in February 2015. We used the TZ1V and TZ1H receivers, connected to the SAM45 spectrometer, tuned to a frequency of 94 GHz. Eight 250 MHz bands between 86.3 and 90.3 GHz and between 98.3 and 102.3 GHz were covered with a spectral resolution of 60 kHz, corresponding to a velocity resolution of 0.2 km/s at 90 GHz. The observations were performed with the position switching mode. Pointing was checked every 1-1.5 hour on a nearby bright source and was found to be accurate within 3″. The weather conditions were good, although unstable during one night, and system temperatures were typically 120-180 K. The size of the telescope beam at the observing frequency is 18″, and the aperture and main beam efficiencies are and , respectively. The 45m data were reduced using the Jnewstar software. The scans were checked individually, flagged and coadded. A polynomial order of 3 was then fitted over line-free regions to correct for baseline oscillations.
Deep observations with the IRAM 30m telescope towards the methanol hotspot were carried out in January 2015 and March 2015. The EMIR E090 receiver was used and connected to the FTS backend with a 50 kHz resolution. Pointing was checked every 1.5 hour on a nearby bright source and was found to be accurate within 3″. Observations were performed with the frequency switching mode, resulting in a rms of 3-4 mK per 50 kHz spectral channel. The weather conditions were average to good, and gave system temperatures of 70-80 K at 3 mm. A low polynomial order of 3 or 4 was then fitted over line-free regions to correct for local baseline oscillations.
On-the-fly observations of CH3OH transitions towards the Barnard 5 cloud with the IRAM 30m telescope were carried out in February 2017 using the position switching mode with a common center at IRS1. The EMIR E090 and E150 receivers were used and connected to the FTS backend with a 50 kHz resolution. Pointing was checked every 1.5 hour on a nearby bright source and was found to be accurate within 3″. Position switching observations resulted in a rms of 30-40 mK per 50 kHz spectral channel. The size of the telescope beam is about 25-30″at 3 mm and about ″at 2 mm. A low polynomial order of 1 was then fitted over line-free regions to correct for local baseline oscillations.
The 30m data were reduced using the GILDAS/CLASS software. The scans were checked individually, coadded, and eventually folded to deconvolve the spectra from the frequency-switching procedure. The 1.8 GHz spectral windows covered by our observations are listed in Table 1. Pointing was checked every 1.5 hour on a nearby bright source and was found to be accurate within 3″. A more comprehensive analysis of the CH3OH maps in the B5 dark cloud will be presented in a separate publication.
Observations with the Onsala 20m telescope were carried out in May 2014 and March 2015. We used the dual-polarisation, sideband-separating 3 mm receiver system (Belitsky et al., 2015) to target four different frequency settings: 89.58 and 95.95 GHz in 2014, and 101.25 and 101.98 in 2015. In 2014 the spectra were recorded using a fast Fourier transform spectrometer (FFTS) at channel separation 12.2 kHz, covering 100 MHz bandwidth. Dual beam switching mode was used with an 11′ beam throw, and the system temperature varied between 145-235 K. In 2015, a new FFTS of improved bandwidth was used at channel separation 19.1 kHz, covering 625 MHz wide spectral windows. These observations were performed in the frequency switching mode with a switching frequency of 5 Hz and a throw of 3 MHz. Conditions were good with system temperatures in the range 160-250 K and pointing and focus were checked toward strong continuum sources after sunrise and sunset for all observations. The OSO20m beam full width at half maximum (FWHM) is about 41″ at 89 GHz, 38″ at 95 GHz and 36″ at 101 GHz, and the main beam efficiency varies with both frequency and source elevation, resulting in values 0.42-0.50 for the current observations. The 20m data were checked and reduced using the spectral analysis software XS111Developed by Per Bergman at Onsala Space Observatory, Sweden; http://www.chalmers.se/rss/oso-en/observations/data-reduction-software. Linear baselines were fitted to line-free regions and subtracted from individual, dual polarisation spectra before averaging them together, weighted by rms noise. For the frequency switched spectra, which tend to exhibit low-intensity standing wave features, an additional baseline of order 3-5 was fitted locally around each line and subtracted before further analysis.
| Frequency range | Telescope | Beam size | df | Rms | Targeted molecules | ||
|---|---|---|---|---|---|---|---|
| (GHz) | (arcsec) | (kHz) | (mK) | (%) | (%) | ||
| 83.550-85.370 | IRAM 30m | 29 | 50 | 3-4 | 95 | 81 | CH3OH, CH3OCHO, CH3OCH3, CH3CHO |
| 86.830-88.650 | IRAM 30m | 29 | 50 | 3-4 | 95 | 81 | HNCO, c-HCOOH, CH3OCHO, CH3OCH3 |
| 89.532-89.629 | OSO 20m | 41 | 60 | 8 | - | 49 | t-HCOOH |
| 89.190-89.370 | NRO 45m | 20 | 61 | 3-5 | - | 44 | CH3OCHO |
| 89.350-89.530 | NRO 45m | 20 | 61 | 5-6 | - | 44 | CH2DOH |
| 89.530-89.780 | NRO 45m | 20 | 61 | 4-5 | - | 44 | CH3OCH3 |
| 90.075-90.325 | NRO 45m | 20 | 61 | 5-6 | - | 44 | CH3OCHO |
| 95.901-96.001 | OSO 20m | 38 | 64 | 6-7 | - | 50 | E-CH3CHO, A-CH3CHO |
| 96.020-97.840 | IRAM 30m | 25 | 50 | 27-30 | 94 | 80 | CH3OH |
| 98.740-98.990 | NRO 45m | 18 | 61 | 4-5 | - | 42 | E-CH3CHO, A-CH3CHO |
| 99.200-99.450 | NRO 45m | 18 | 61 | 4-5 | - | 42 | CH3OCH3 |
| 99.230-101.050 | IRAM 30m | 25 | 50 | 3-4 | 94 | 80 | CH3OCHO, CH3OCH3 |
| 100.942-101.558 | OSO 20m | 36 | 68 | 5 | - | 42 | p-CH2CO |
| 100.910-101.160 | NRO 45m | 18 | 61 | 4-5 | - | 42 | CH2CO, CH3CHO |
| 101.675-102.290 | OSO 20m | 36 | 68 | 6 | - | 47 | o-CH2CO |
| 102.510-104.330 | IRAM 30m | 25 | 50 | 3-4 | 94 | 80 | CH3OCHO |
| 143.800-145.620 | IRAM 30m | 16 | 50 | 35-40 | 93 | 73 | CH3OH |
| 156.300-158.120 | IRAM 30m | 15 | 50 | 35-40 | 93 | 73 | CH3OH |
3 Results
3.1 Spectra
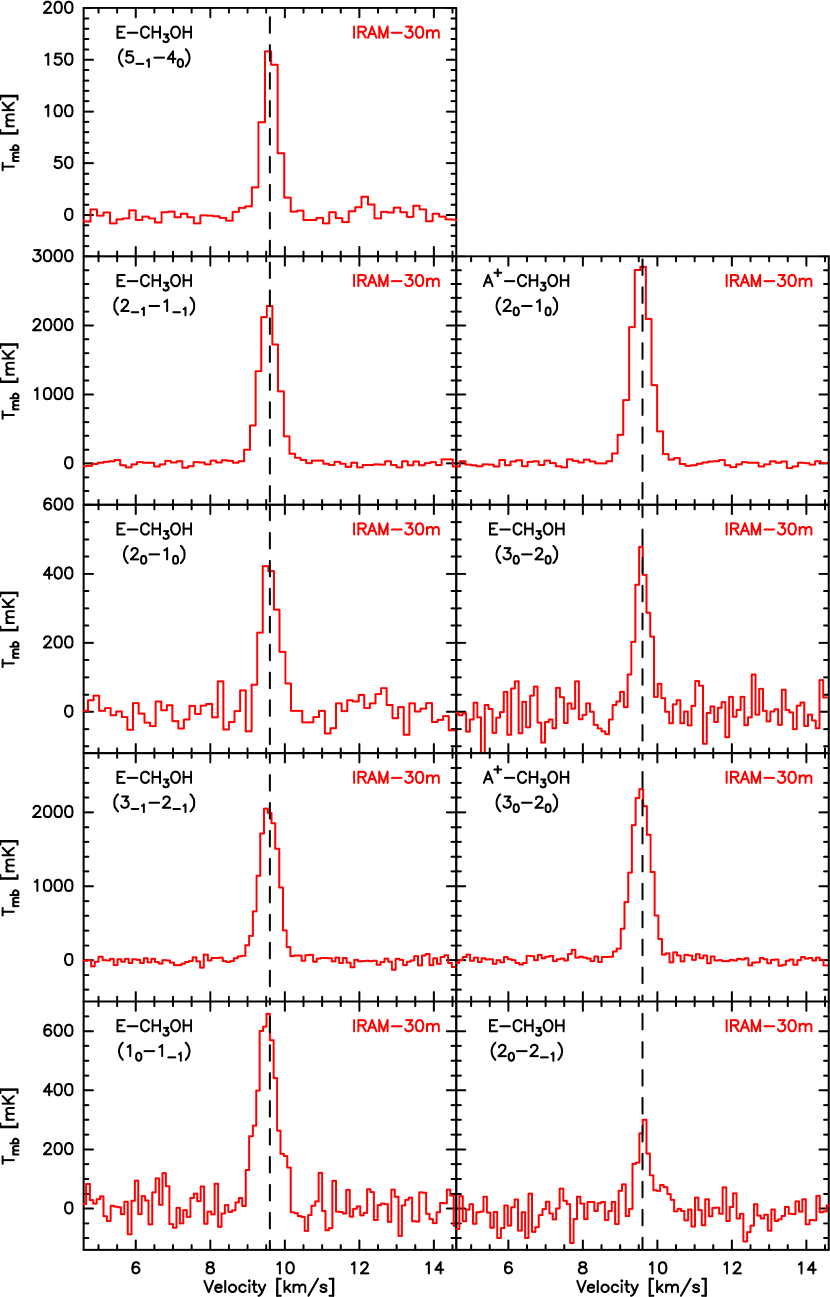
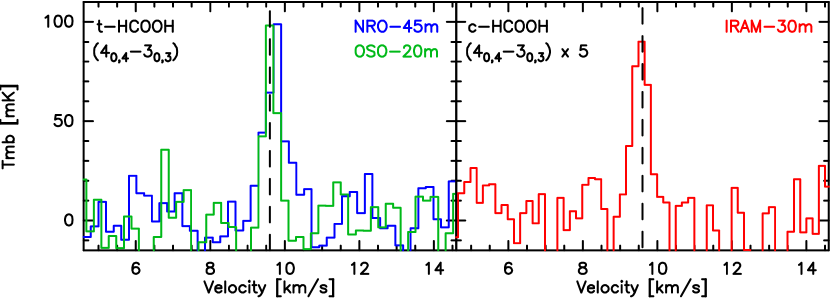
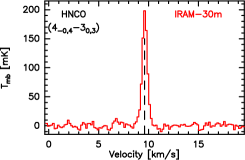
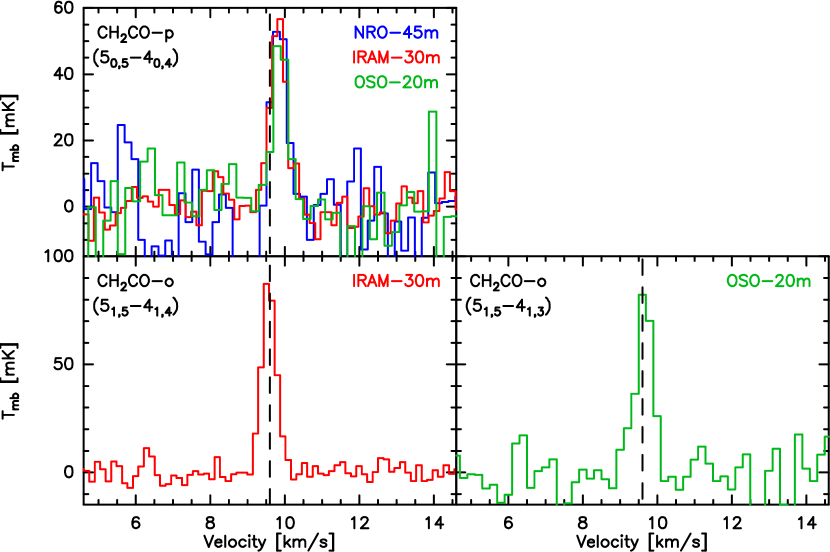
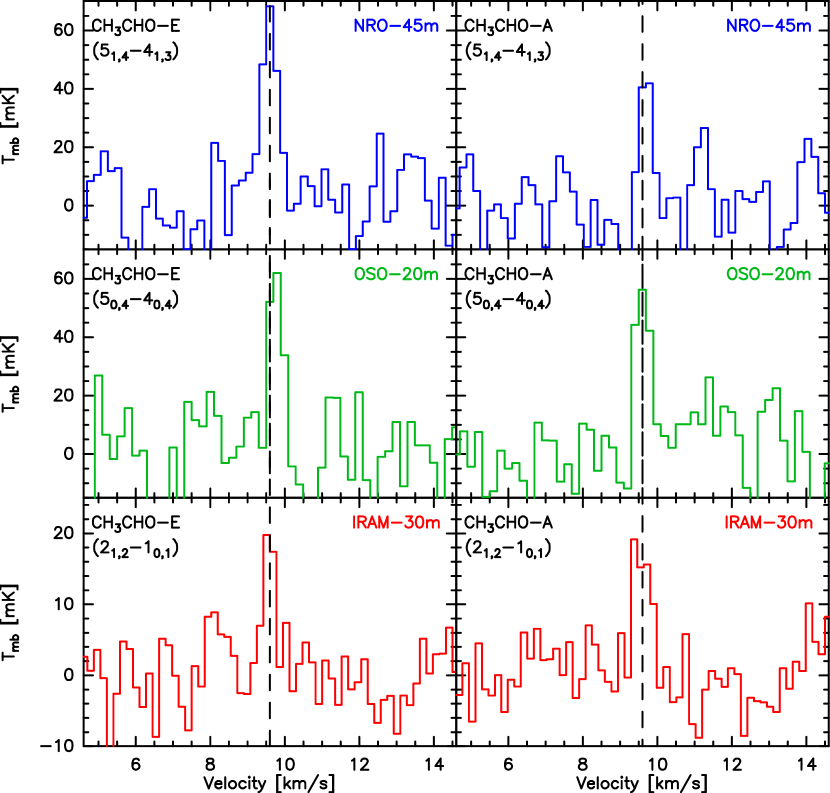
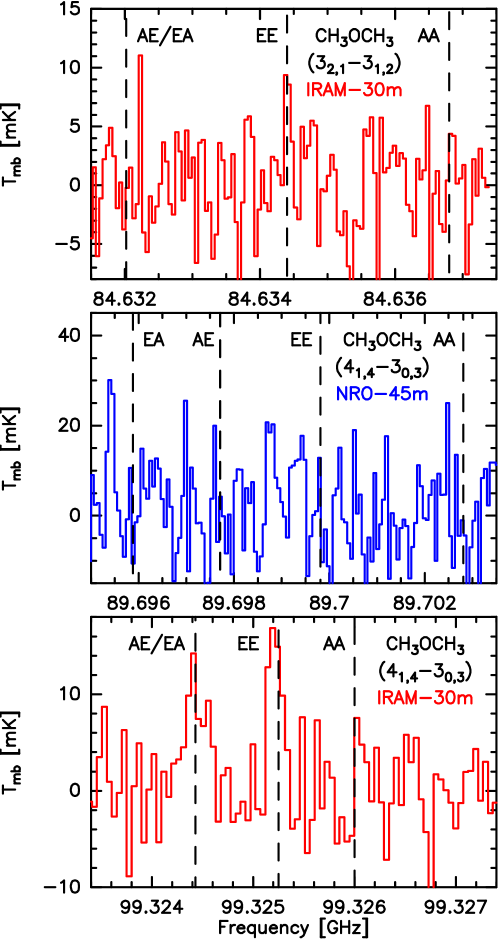
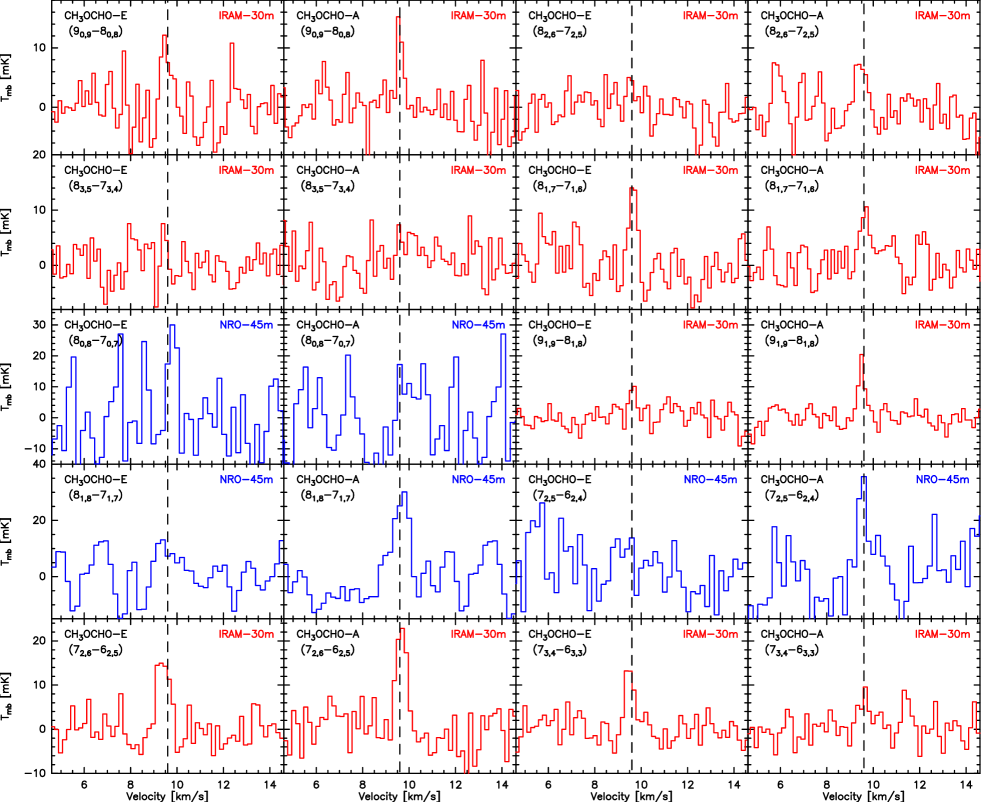
Figures 2 to 8 present the spectra obtained with the NRO 45m (in blue), the IRAM 30m (in red), and the OSO 20m (in green) telescopes. Table 2 presents the frequencies, the spectroscopic parameters, and the observed properties of the targeted transitions. The rms achieved in the observations ranges between 3 and 8 mK per 50-60 kHz spectral bin for deep observations of COMs and between 27 - 40 mK for observations of bright methanol transitions, depending on the observed frequency and the used telescope. We report here the detection of several transitions from methanol (CH3OH), formic acid (HCOOH), ketene (CH2CO), acetaldehyde (CH3CHO), methyl formate (CH3OCHO), and the tentative detection of dimethyl ether (CH3OCH3).
We detected the transition of HCOOH in its two conformers trans and cis at 89.579 and 87.695 GHz, respectively (Fig. 3). To our knowledge, this is the second published detection of the higher energy cis-HCOOH conformer in space after the detection by Cuadrado et al. (2016) towards the Orion bar. Three transitions from ketene, two in its ortho substate and one in its para substate, have been detected (Fig. 5). The para transition of ketene at 101.036 GHz has been detected with all telescopes. The integrated main-beam temperatures obtained with the three telescopes are very similar, the differences in the peak main-beam temperatures remaining within the uncertainties. This comparison suggests that the size of the formic acid and ketene emissions is much larger than 40 arcsec, the beam of the OSO 20m at 90 GHz. In the following, we therefore assume that the emission size is much larger than the telescope beams for all the considered species, resulting in a beam dilution of 1.
Six acetaldehyde transitions, three for each substate A and E, have also been detected with upper level energies between 5 and 17 K (Fig. 6). CH3OCH3 is detected in the four substates AA, EE, AE, and EA of the transition whilst the transition at 84 GHz is detected for the substate EE only (Fig. 7). The non-detection of the transitions from the other states is in good agreement with observations of other dimethyl ether transitions suggesting that the EE substate usually shows the brightest transition (see Bacmann et al., 2012). Among the 20 transitions from methyl formate targetted with the IRAM 30m and the NRO 45m telescopes, 13 transitions have been detected at 3 level, 5 for the E substate and 8 in the A substate (Fig. 8). The non-detection of 7 transitions, with similar properties, is in good agreement with the high uncertainties of the observed transitions, detected at a signal-to-noise ratio slightly higher than 3 and showing large uncertainties.
The Full-Width-at-Half-Maximum (FWHM) of the detected transitions shows a large variation between 0.3 and 0.7 km/s, especially for the faint transitions with a low signal-to-noise. Brighter transitions from methanol or ketene show a FWHM linewidth between 0.5 and 0.6 km/s, as expected for transitions originated from cold dark clouds. Linewidths in B5 tend to be slightly larger than the linewidth of 0.4 km/s for the transitions of COMs detected by Bacmann et al. (2012) towards L1689B and Jiménez-Serra et al. (2016) towards L1544. For non-detected transitions, we defined a 3 upper limit as where is the rms noise, is the typical linewidth of the transition, and is the spectral velocity resolution.
| Molecule | Transition | Frequency | Telescope | FWHM | ||||
| (GHz) | (K) | (s-1) | (mK km/s) | (km/s) | (km/s) | |||
| E-CH3OH | 84.52117 | 40.4 | IRAM-30m | 88.8 17.9 | 9.62 | 0.50 | ||
| E-CH3OH | 96.73936 | 12.5 | IRAM-30m | 1490 300 | 9.57 | 0.61 | ||
| A+-CH3OH | 96.74137 | 7.0 | IRAM-30m | 1950 390 | 9.56 | 0.62 | ||
| E-CH3OH | 96.74454 | 20.1 | IRAM-30m | 256 53 | 9.60 | 0.55 | ||
| E-CH3OH | 145.09375 | 27.1 | IRAM-30m | 209 44 | 9.59 | 0.47 | ||
| E-CH3OH | 145.09744 | 19.5 | IRAM-30m | 1250 250 | 9.57 | 0.60 | ||
| A+-CH3OH | 145.10319 | 13.9 | IRAM-30m | 1420 284 | 9.56 | 0.61 | ||
| E-CH3OH | 157.27083 | 15.4 | IRAM-30m | 410 84 | 9.52 | 0.65 | ||
| E-CH3OH | 157.27606 | 20.1 | IRAM-30m | 114 27 | 9.63 | 0.43 | ||
| HNCO | 87.92525 | 10.5 | IRAM-30m | 126 25 | 9.63 | 0.61 | ||
| -HCOOH | 89.57917 | 10.8 | NRO-45m | 56.8 15.9 | 9.74 | 0.68 | ||
| OSO-20m | 39.2 6.5 | 9.70 | 0.39 | |||||
| -HCOOH | 87.69469 | 10.5 | IRAM-30m | 11.4 3.3 | 9.50 | 0.56 | ||
| o-CH2CO | 100.09451 | 27.5 | IRAM-30m | 45.8 9.2 | 9.58 | 0.61 | ||
| p-CH2CO | 101.03671 | 14.5 | NRO-45m | 29.5 8.8 | 9.85 | 0.50 | ||
| IRAM-30m | 31.4 6.4 | 9.83 | 0.52 | |||||
| OSO-20m | 25.6 6.5 | 9.88 | 0.46 | |||||
| o-CH2CO | 101.98140 | 27.7 | OSO-20m | 46.8 11.1 | 9.66 | 0.52 | ||
| E-CH3CHO | 83.58426 | 5.03 | IRAM-30m | 8.4 2.1 | 9.57 | 0.36 | ||
| A-CH3CHO | 84.21976 | 4.96 | IRAM-30m | 11.4 3.3 | 9.57 | 0.56 | ||
| E-CH3CHO | 95.94744 | 13.9 | OSO-20m | 31.4 8.7 | 9.76 | 0.43 | ||
| A-CH3CHO | 95.96346 | 13.8 | OSO-20m | 30.4 8.5 | 9.62 | 0.46 | ||
| E-CH3CHO | 98.86331 | 16.6 | NRO-45m | 20.0 6.9 | 9.70 | 0.37 | ||
| A-CH3CHO | 98.90094 | 16.5 | NRO-45m | 38.1 9.5 | 9.59 | 0.54 | ||
| AE/EA-CH3OCH3 | 84.63202 | 11.1 | IRAM-30m | 3.5 | ||||
| EE-CH3OCH3 | 84.63440 | 11.1 | IRAM-30m | 4.0 1.4 | 9.56 | 0.34 | ||
| AA-CH3OCH3 | 84.6368 | 11.1 | IRAM-30m | 3.5 | ||||
| EA-CH3OCH3 | 89.69588 | 8.4 | NRO-45m | 9.4 | ||||
| AE-CH3OCH3 | 89.69771 | 8.4 | NRO-45m | 9.4 | ||||
| EE-CH3OCH3 | 89.69981 | 8.4 | NRO-45m | 9.4 | ||||
| AA-CH3OCH3 | 89.70281 | 8.4 | NRO-45m | 9.4 | ||||
| AE/EA-CH3OCH3 | 99.32443 | 10.2 | IRAM-30m | 3.9 2.5 | 9.57 | 0.39 | ||
| EE-CH3OCH3 | 99.32525 | 10.2 | IRAM-30m | 9.2 2.3 | 9.69 | 0.46 | ||
| AA-CH3OCH3 | 99.32600 | 10.2 | IRAM-30m | 2.8 1.3 | 9.41 | 0.27 | ||
| E-CH3OCHO | 84.44917 | 19.0 | IRAM-30m | 11.4 3.3 | 9.38 | 0.65 | ||
| A-CH3OCHO | 84.45475 | 19.0 | IRAM-30m | 13.1 3.5 | 9.70 | 0.47 | ||
| E-CH3OCHO | 87.14328 | 22.6 | IRAM-30m | 6.9 2.7 | 9.50 | 0.43 | ||
| A-CH3OCHO | 87.16129 | 22.6 | IRAM-30m | 4.7 2.6 | 9.62 | 0.58 | ||
| E-CH3OCHO | 89.31466 | 20.2 | NRO-45m | 5.9 | ||||
| A-CH3OCHO | 89.31664 | 20.1 | NRO-45m | 22.5 7.3 | 9.67 | 0.72 | ||
| E-CH3OCHO | 90.14572 | 19.7 | NRO-45m | 9.9 | ||||
| A-CH3OCHO | 90.15647 | 19.7 | NRO-45m | 17.3 8.2 | 9.55 | 0.46 | ||
| E-CH3OCHO | 90.22766 | 20.1 | NRO-45m | 9.9 | ||||
| A-CH3OCHO | 90.22962 | 20.1 | NRO-45m | 9.9 | ||||
| E-CH3OCHO | 100.07861 | 24.9 | IRAM-30m | 3.4 1.4 | 9.65 | 0.31 | ||
| A-CH3OCHO | 100.08054 | 24.9 | IRAM-30m | 6.0 1.7 | 9.50 | 0.30 | ||
| E-CH3OCHO | 100.29460 | 27.4 | IRAM-30m | 2.8 | ||||
| A-CH3OCHO | 100.30818 | 27.4 | IRAM-30m | 3.1 | ||||
| E-CH3OCHO | 100.48224 | 22.8 | IRAM-30m | 7.5 1.9 | 9.66 | 0.36 | ||
| A-CH3OCHO | 100.49068 | 22.8 | IRAM-30m | 5.4 1.6 | 9.60 | 0.64 | ||
| E-CH3OCHO | 100.68154 | 24.9 | IRAM-30m | 6.3 1.7 | 9.54 | 0.70 | ||
| A-CH3OCHO | 100.68337 | 24.9 | IRAM-30m | 4.4 1.5 | 9.59 | 0.23 | ||
| E-CH3OCHO | 103.46657 | 24.6 | IRAM-30m | 3.1 | ||||
| A-CH3OCHO | 103.47866 | 24.6 | IRAM-30m | 5.6 1.6 | 9.50 | 0.50 |
3.2 Non-LTE analysis
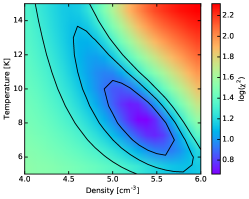
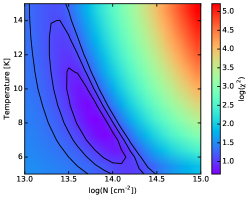
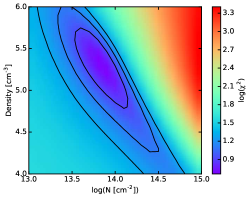
Cross-sections for the rotational excitation of the A- and E-types of methanol and methyl formate by H2 and Helium, respectively, and of HNCO by H2 have been computed by Rabli & Flower (2010), Faure et al. (2014), and Green (1986), allowing us to perform a non-LTE analysis of the emission of these molecules. To this mean, we used the non-LTE radiative transfer code RADEX assuming an isothermal and homogeneous medium using the large velocity approximation for a uniform sphere (van der Tak et al., 2007). The line excitation temperatures , the opacities , and the integrated brightness temperatures of methanol have first been computed by varying the column density of each sub-type between and cm-2 with 20 logarithmic steps, the density of H2 between and cm-3 with 20 logarithmic steps, and the kinetic temperature between 5 and 15 K with 10 linear steps. Due to the low number of detected A-CH3OH transitions, we assumed a state E/A abundance ratio of 1 following the observations by Bacmann & Faure (2016) towards a sample of prestellar cores. The FWHM linewidth was fixed to 0.5 km s-1 following our observed spectra. Figure 9 presents the reduced distribution in the - , - , and - planes. A finer grid was then performed around the best-fit values with linear steps. Methanol observations can be reproduced with a reduced of 4.5 for K, cm-3 and for a methanol column density of (A-CH3OH) = (E-CH3OH) = cm-2. The best-fit density is a factor of 2-4 higher than the average density in the East 286 dense core, the denser of the two nearby cores (Sadavoy, 2013), whilst the kinetic temperature is 2-3 K and 4-5 K lower than the average dust temperatures of East 286 and East 189, respectively. This finding would suggest that the methanol emission mostly originates from the center part of the cores, where the physical conditions are dense and cold. A dedicated analysis of the continuum emission profile of the two dense cores needs to be carried out in order to derive their physical structure. For these physical conditions and this column density, the transitions with integrated brightness temperatures higher than 1 K km s-1 have an opacity of 1-2 showing that some CH3OH transitions can be optically thick in B5. The excitation temperatures vary between negative values for the , E transition at 84.521 GHz to K for the E and A+ transitions at GHz. Appendix 1 discusses the impact of physical conditions on the excitation temperatures in more detail.
The narrow range of upper level energies of the methyl formate transitions (between 19 and 25 K) prevents us from running a full model grid in which several parameters are varied, since it is impossible to converge towards one single solution that reproduces the observations. Instead, we used the H2 density and the temperature that best reproduce the methanol emission and we only varied the methyl formate column density, first between and cm-2 and then on a finer grid between and cm-2. We did not assume any state E/A abundance ratio and the A- and E- states were treated as two distinct but coexistent species. Methyl formate observations can be reproduced with a reduced of for (E-CH3OCHO) = cm-2 and (A-CH3OCHO) = cm-2. For this density, all transitions are optically thin () and show an excitation temperature of K, close to the kinetic temperature. The HNCO column density that best reproduces the emission of the transition at 87.92525 GHz is cm-2. The results of the RADEX analysis are summarised in Table 3.
| Molecule | /(CH3OH) | /(H2) | |||
|---|---|---|---|---|---|
| (cm-2) | (K) | (cm-3) | |||
| A-CH3OH | 7.5(+13) 3.0(+13) | 2.3(-8) | 7.5 1.5 | 2.25(+5) 1.50(+5) | |
| E-CH3OH | 7.5(+13) 3.0(+13) | 2.3(-8) | 7.5 1.5 | 2.25(+5) 1.50(+5) | |
| CH3OH | 1.5(+14) 4.2(+13) | 4.5(-8) | 7.5 1.5 | 2.25(+5) 1.50(+5) | |
| A-CH3OCHO | 2.2(+12) 1.3(+12) | 1.5(-2) | 6.7(-10) | 7.5a | 2.25(+5)a |
| E-CH3OCHO | 2.1(+12) 1.5(+12) | 1.4(-2) | 6.4(-10) | 7.5a | 2.25(+5)a |
| CH3OCHO | 4.3(+12) 2.0(+12) | 2.9(-2) | 1.3(-9) | ||
| HNCO | 2.0(+12) 6.0(+11) | 1.3(-2) | 6.1(-10) | 7.5a | 2.25(+5)a |
a: The physical conditions are fixed following the results of the methanol analysis.
3.3 LTE analysis
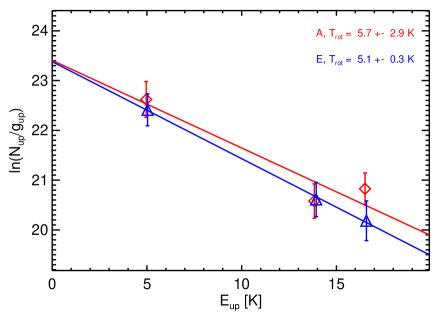
The column density of the observed molecules whose collisional coefficients are not known has been obtained through the Local Thermodynamic Equilibrium (LTE) approximation. For the kinetic temperatures ( K) and densities ( cm-3) expected towards the methanol hotspot of Barnard 5, the different substates have to be treated separately. The detected acetaldehyde transitions have upper level energies between 5 and 16 K, allowing us to perform a Population Diagram analysis. The column densities and the rotational temperatures of the two substates are varied to fit the observational data using the routine presented in Taquet et al. (2015) following the Population Diagram method proposed by Goldsmith & Langer (1999). Table 4 lists the column densities derived at the methanol hotspot of Barnard 5 with the LTE analysis and Figure 10 presents the Rotational Diagram of acetaldehyde. The rotational temperatures of the two acetaldehyde states are about 5-6 K. This confirms that the observed acetaldehyde transitions are not fully thermalised for such dark cloud conditions.
The transitions of ketene and dimethyl ether have similar upper level energies, preventing us to perform a Rotational Diagram analysis in which the rotational temperature is considered as a free parameter. We therefore only varied the total column density in order to obtain the best fit to the observations assuming two excitation temperatures: 7.5 K, which corresponds to the kinetic temperature in the methanol hotspot derived with the RADEX analysis of the methanol emission, and a lower excitation temperature of 5.0 K close to the methanol and methyl formate excitation temperatures, and of the acetaldehyde rotational temperature, as should be expected for molecular cloud conditions where levels are usually sub-thermally excited. The four different substates of di-methyl ether were treated separately. The EA- and AE- transitions have the same frequency at 99.32443 GHz, we therefore considered that the contribution of the two states to the detected transition scales with the degeneracy of their upper energy levels.
As expected, the A/E abundance ratio is close to 1 for methyl formate and acetaldehyde. The ortho/para ratio of ketene is equal to , which is consistent with the statistical ratio of 3 and the value of 3.3 and 3.5 found in L1689B and TMC1 (Bacmann et al., 2012; Ohishi et al., 1991).
We also derived the upper limits of other undetected COMs showing at least one bright (i.e., low , high ) transition lying in the observed frequency bands. In particular, glycol aldehyde HCOCH2OH, an isomer of methyl formate, and ethanol, the ethyl counterpart of methanol, show abundance upper limits that are about 10 times lower than the species detected in this work.
| Fixed | K | K | ||||
|---|---|---|---|---|---|---|
| Molecule | /(CH3OH) | /(H2) | /(CH3OH) | /(H2) | ||
| (cm-2) | (cm-2) | |||||
| trans-HCOOH | 2.6(+12) 6.6(+11) | 1.7(-2) | 7.9(-10) | 7.5(+12) 1.9(+12) | 5.0(-2) | 2.3(-9) |
| cis-HCOOH | 1.7(+11) 4.6(+10) | 1.1(-3) | 5.2(-11) | 4.7(+11) 1.3(+11) | 3.1(-3) | 1.4(-10) |
| HCOOH | 2.8(+12) 6.6(+11) | 1.8(-2) | 8.4(-10) | 8.0(+12) 1.9(+12) | 5.3(-2) | 2.4(-9) |
| o-CH2CO | 2.1(+12) 4.2(+11) | 1.4(-2) | 6.4(-10) | 4.8(+12) 9.6(+11) | 3.2(-2) | 1.5(-9) |
| p-CH2CO | 6.2(+11) 1.8(+11) | 4.1(-3) | 1.9(-10) | 1.5(+12) 4.3(+11) | 1.0(-2) | 4.5(-10) |
| CH2CO | 2.7(+12) 4.6(+11) | 1.8(-2) | 8.2(-10) | 6.3(+12) 1.1(+12) | 4.2(-2) | 1.9(-9) |
| AA-CH3OCH3 | 3.1(+11) 1.5(+11) | 2.1(-3) | 9.4(-11) | 4.2(+11) 2.0(+11) | 2.8(-3) | 1.3(-10) |
| EE-CH3OCH3 | 1.3(+12) 4.4(+11) | 8.7(-3) | 3.9(-10) | 1.7(+12) 6.1(+11) | 1.1(-2) | 5.2(-10) |
| AE-CH3OCH3 | 2.2(+11) 2.3(+11) | 1.5(-3) | 6.7(-11) | 2.9(+11) 1.6(+11) | 1.9(-3) | 8.8(-11) |
| EA-CH3OCH3 | 2.2(+11) 2.3(+11) | 1.5(-3) | 6.7(-11) | 2.9(+11) 1.6(+11) | 1.9(-3) | 8.8(-11) |
| CH3OCH3 | 2.1(+12) 5.7(+11) | 1.4(-2) | 6.2(-10) | 2.7(+12) 6.8(+11) | 1.8(-2) | 8.2(-10) |
| CH3CCH | 7.3(+11) | 4.9(-3) | 2.2(-10) | 7.3(+12) | 4.9(-2) | 2.2(-9) |
| HCOCH2OH | 2.7(+11) | 1.8(-3) | 8.3(-11) | 7.3(+11) | 4.9(-3) | 2.2(-10) |
| aGg-(CH2OH)2 | 4.9(+11) | 3.2(-3) | 1.5(-10) | 2.3(+12) | 1.5(-2) | 7.0(-10) |
| gGg-(CH2OH)2 | 1.2(+12) | 8.2(-3) | 3.7(-10) | 3.5(+12) | 2.4(-2) | 1.1(-9) |
| C2H5OH | 4.1(+11) | 2.8(-3) | 1.3(-10) | 1.0(+12) | 6.7(-3) | 3.1(-10) |
| NH2CHO | 2.0(+10) | 1.3(-4) | 6.1(-12) | 5.4(+10) | 3.6(-4) | 1.6E(-11) |
| Rotational diagram | Free | |||||
| /(CH3OH) | /(H2) | |||||
| (cm-2) | (K) | |||||
| A-CH3CHO | 2.7(+12) 5.5(+11) | 1.8(-2) | 8.2(-10) | 5.7 2.9 | ||
| E-CH3CHO | 2.5(+12) 4.6(+11) | 1.7(-2) | 7.6(-10) | 5.1 0.3 | ||
| CH3CHO | 5.2(+12) 7.2(+11) | 3.5(-2) | 1.6(-9) | |||
a: The abundance ratio relative to CH3OH is computed with the CH3OH column density derived from the RADEX analysis ((CH3OH) = cm-2; see text). b: The H2 column density is equal to cm-2 (Wirstrom et al., 2014).
4 Discussion
4.1 Comparison with other sources
The methanol hotspot in B5 is located just between two dense cores and therefore represents a stage between the dark cloud and dense core phases. As a consequence, abundances of COMs with respect to methanol, their likely parent species, derived towards B5 listed in Table 4 are compared in Figure 11 with observations towards the dark clouds TMC1 and L134N and the dense cores B1-b, L1689B, and L1544 (Ohishi et al., 1992; Öberg et al., 2010; Cernicharo et al., 2012; Bacmann et al., 2012; Bizzocchi et al., 2014; Vastel et al., 2014; Bacmann & Faure, 2016; Gratier et al., 2016; Jiménez-Serra et al., 2016). Abundances derived at the “methanol hotspot” of B5 seem to be in good agreement with observations towards other cold dense cores. In B5, B1-b, and L1689B, all the detected COMs have similar abundances within each source, at least considering the ranges of possible abundances depending on their assumed excitation temperature. However, COMs in B1-b are found to be less abundant with respect to CH3OH than in L1689B by one order of magnitude. L1544 is the only source showing significant abundance differences between COMs: ketene is ten times more abundant than formic acid and two to four times more abundant than acetaldehyde.
Figure 11 also shows abundance ratios of COMs derived in other types of sources. The Horsehead Nebula Photon-Dominated Region (HN PDR) observed by Guzman et al. (2014) is located in the external layer of the Horsehead nebula and undergoes efficient UV photochemistry. It therefore represents the translucent phase prior the formation of dark clouds. Hot cores represent the early stages of star formation when the central source is still embedded in an thick protostellar envelope. Abundances in low-mass protostars are the values derived towards NGC1333-IRAS2A and IRAS 16293-2422 through sub-mm interferometric observations by Taquet et al. (2015) and Jørgensen et al. (2016), whilst abundances in high-mass protostars are averaged values derived from the compilation by Taquet et al. (2015). Abundances in the comet Hale-Bopp by Bockelee-Morvan et al. (2000) are representative of abundances at the end of the protoplanetary disk phase. Although many other phases are involved in the star formation process, such a comparison can give us a first idea of the abundance evolution of different types of COMs with the evolutionary stage of star formation. The five COMs studied in this work can be distinguished into two categories according to their rotational temperature around massive hot cores (see Isokoski et al., 2013): the “lukewarm” COMs ketene, acetaldehyde, and formic acid showing low rotational temperatures between 20 and 80 K; and the “warm” COMs methyl formate and di-methyl ether showing rotational temperatures usually higher than 100 K.
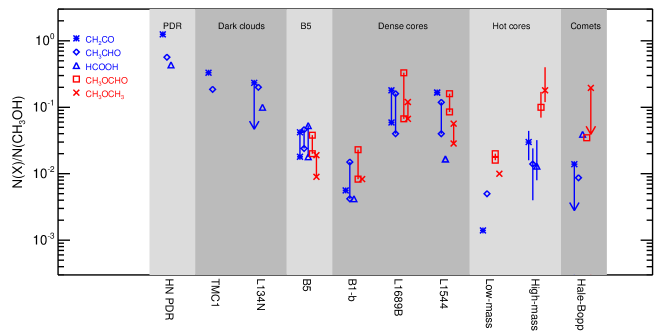
The three “lukewarm” COMs are found to be as abundant as methanol in the Horsehead PDR but they show abundances of 10 - 30 % in dark clouds and abundances mostly lower than 10 % in cold dense cores. Around low- and high-mass hot cores, the “warm” COMs methyl formate and di-methyl ether are more abundant than the three “lukewarm” COMs. The abundance of CH2CO and CH3CHO derived in the hot corino of NGC1333-IRAS2A and IRAS 16293-2422 by Taquet et al. (2015) and Jørgensen et al. (2016) are lower than 0.5 % whereas abundances of CH3OCHO and CH3OCH3 are higher than 1 %. Abundances of “lukewarm” COMs around massive hot cores derived from single-dish observations and assuming similar source sizes for all molecules are about 1 % with respect to methanol, and could be even lower if a larger source size is assumed as expected from their low excitation temperature, whilst CH3OCHO and CH3OCH3 abundances are higher than 10 %.
4.2 Ice evaporation processes in dark clouds
Methanol cannot form in the gas phase (Luca et al., 2002; Garrod & Herbst, 2006) whilst water is the main component of interstellar ices (see Öberg et al., 2011). The detection of cold methanol and water with high abundances of , derived with our RADEX analysis, and w.r.t. H2 (Wirstrom et al., 2014) respectively, in a dark cloud region with no associated infrared emission is therefore attributed to cold grain surface chemistry followed by non-thermal evaporation processes. Several processes have been proposed to trigger evaporation of icy material in the gas phase of dark clouds: 1) photoevaporation induced by the external interstellar and cosmic ray induced field of UV photons; 2) chemical desorption upon surface formation of the molecule; 3) ice sputtering by cosmic-rays. A viable desorption mechanism must also account for the spatial chemical differentiations and anti-correlations observed for the different molecules detected in Barnard 5. Processes that are not able to explain the observed spatial distributions can therefore be discounted.
UV photolysis of methanol ice has been experimentally studied by Bertin et al. (2016) and Cruz-Diaz et al. (2016). They showed that UV photolysis of methanol ice mostly results in methanol photodissociation. Bertin et al. (2016) derived a low photoevaporation rate of molecules per incident photon for a pure methanol ice, two orders of magnitude lower than the rates commonly used in astrochemical models. The photoevaporation is found to be an indirect process in which the radicals produced by photodissocation recombine together to release the produced methanol molecule into the gas phase through chemical desorption. UV photolysis of a more realistic methanol-CO ice mixture decreases the rate to molecules per incident photon. The location of the methanol hotspot between two dense cores that can act as shields against external UV irradiation, in combination with its low efficiency, suggests that UV photoevaporation is not the dominant mechanism responsible for its high gas-phase methanol abundance.
The so-called chemical desorption, desorption of a product due to the energy release of the exothermic surface reaction, has been experimentally quantified by Minissale et al. (2016) for a dozen of reactions for an amorphous water ice substrate, representative of ices observed in dense clouds. Although these authors have only been able to derive an upper limit of 8 % for the desorption efficiency of methanol due to the reaction between CH3O and H, their theoretical estimate results in a chemical desorption efficiency of %. A high abundance of gaseous methanol between the two dense cores East189 and East286 could therefore reflect an efficient methanol formation at the surface of interstellar ices triggering chemical desorption of methanol into the gas phase.
The sputtering efficiency induced by the impact of energetic ions on cold water ice has been studied experimentally by various authors (see Brown et al., 1984). Recently, Dartois et al. (2015) measured the yield of water ice sputtering by swift heavy MeV ions and derived the sputtering rate of water ice for different cosmic ray ionisation rates, which was found to vary between 4 and 30 molecules cm-2 s-1. Assuming that the cosmic-ray induced FUV field is about photons cm-2 s-1 (Shen et al., 2004), UV photodesorption would contribute equally to the cosmic ray sputtering with a photodesorption probability of 10-3. Assuming that methanol has a similar sputtering efficiency than water, this result suggests that ice sputtering by cosmic rays is a much more efficient process than UV photodesorption, by a factor of 100, for releasing the ice content in the gas phase. The abundance of gas phase methanol induced by cosmic ray ice sputtering would therefore only depend on the total methanol abundance in ices, controlling the total evaporation rate, and the density of the medium, governing the accretion rate. As for chemical desorption, the bright methanol emission seen between two dense cores, and not at the edge of the cores more illuminated by external UV photons, suggests that methanol ice would form efficiently in UV-shielded and colder regions. This result is consistent with the observations of methanol towards the L1544 prestellar core by Bizzocchi et al. (2014) and Spezzano et al. (2016). The methanol emission in L1544 peaks at the northern part of the core where the interstellar radiation field is likely weaker.
As mentioned by Wirstrom et al. (2014), other processes, such as collisions between small gas clumps triggering the heating of interstellar grains due to grain-grain collisions, might also be at work. A detailed analysis of the CH3OH maps taken with the IRAM 30m will help us to clarify this issue.
4.3 Detection of cis-HCOOH
cis-HCOOH has been detected in Barnard 5 at a relative abundance to trans-HCOOH of about 6 %, but only from the detection of one single transition at a signal-to-noise of 5. The detected transition is the cis-HCOOH line that is expected to be strongest in the 3 mm band under dark cloud conditions. Assuming a population distribution thermalised at K, only one transition, the line at 109.47 GHz, should be detectable at similar noise levels, and while our observations do not cover this frequency, the detection can thus be relatively easily confirmed or refuted. HCOOH has been shown to form from hydrogenation of HO-CO radicals in interstellar ices at low temperatures (Goumans et al., 2008; Ioppolo et al., 2011). The cis-HCOOH isomer lies 1365 cm-1 higher in energy than trans-HCOOH (Lattanzi et al., 2008), and is therefore expected to be about 800 times less abundant around 300 K, and even rarer at the low temperatures of dark clouds. However, a solid state formation mechanism does not necessarily produce an equilibrium isomeric distribution, since the hydrogenation outcome also depends on how the HO-CO complex binds to the surface and its orientation against the incoming H atom. In addition, the association of OH and CO on a grain surface forms HO-CO in a trans configuration, which can only isomerise to the slightly higher energy cis-HOCO by overcoming an energy barrier (Goumans et al., 2008). Furthermore, the relative orientation of the OH group in the cis/trans isomers of HOCO and HCOOH give that
| (1) |
| (2) |
Thus, it seems possible that a non-negligible fraction of the formic acid formed on grains should be in the cis-configuration.
Cuadrado et al. (2016) recently detected several transitions from cis-HCOOH towards the Orion Bar photodissociation region and derived a higher cis-to-trans abundance ratio of 36 %. This higher ratio could be due to a photoswitching mechanism proposed by these authors in which the absorption of a UV photon by the trans HCOOH conformer radiatively excites the molecule to overcome the trans-to-cis interconversion barrier. As discussed previously, the methanol hotspot of B5 is likely shielded from strong sources of UV irradiation, unlike the Orion Bar, this photoswitching process is therefore likely inefficient in this dark cloud region.
4.4 Implication for the formation and the evolution of COMs
The different trends for the abundance ratio evolution with the evolutionary stage of star formation are consistent with the rotational temperatures derived in high-mass hot cores (see Isokoski et al., 2013). The “lukewarm” COMs acetaldehyde, ketene, and formic acid should indeed be mostly formed in cold regions either through gas phase chemistry and/or at the surface of interstellar grains. The difference of abundances between PDRs and dark clouds suggests that either the three “lukewarm” COMs are more efficiently formed with respect to methanol in transluscent regions than in dark clouds or that methanol is more efficiently destroyed through UV photodissociation than ketene, acetaldehyde, and formic acid. To our knowledge, the UV photodissociation cross sections of the three later species are not known and are usually assumed to be equal to those of methanol. As mentionned earlier, the detection of cis-HCOOH suggests that formic acid would be mostly formed in the inner part of interstellar ices together with CO2 because both molecules can be formed from the reaction between CO+OH through the HO-CO complex (Goumans et al., 2008; Ioppolo et al., 2011) and can then be released into the gas phase via chemical desorption. On the other hand, important gas phase formation pathways have been proposed for ketene and acetaldehyde. Cold ketene is mostly formed from the electronic recombination of CH3CO+ produced by ion-neutral chemistry whilst cold acetaldehyde would be mostly produced through the neutral-neutral reaction between C2H5 and O and via the electronic recombination of CH3CHOH+ produced by ion-neutral reactions such as CH4+H2CO+ (Occhiogrosso et al., 2014). As mentioned in the introduction, surface formation routes producing these two species have also been proposed either through atomic carbon addition of CO followed by hydrogenation (Charnley, 1997) or through radical-radical recombination triggered by the UV photolysis of the main ice components during the warm-up phase (Garrod et al., 2008). The simultaneous detection in high abundances of CH3CHO and HCOOH along with H2O and CH3OH is strongly suggestive of a surface origin. However, the former surface reaction scheme has not been experimentally confirmed yet whilst the latter is known to be ineffective under laboratory conditions (Öberg et al., 2009).
As mentioned in the Introduction, a small fraction of methyl formate and di-methy ether could be formed in cold conditions, either through neutral-neutral and ion-neutral reactions in the gas or through radical recombination induced by the CO hydrogenation in interstellar ices. Cold surface formation of COMs from radical-radical recombination induced by addition and abstraction reactions of CO, H2CO, and CH3OH has been experimentally demonstrated by Fedoseev et al. (2015) and Chuang et al. (2016). However, these experiments tend to produce more glycolaldehyde HCOCH2OH than its isomer methyl formate CH3OCHO, especially when methanol ice is used as initial substrate, because abstraction reactions of methanol only occur on the methyl group favouring the production of CH2OH with respect to CH3O. However, glycolaldehyde was not detected towards B5 and we derived a [HCOCH2OH]/[CH3OCHO] abundance ratio lower than 6 %. Assuming that the evaporation efficiency is similar for the two isomers, the low abundance ratio suggests that radical-radical recombination on ices, followed by evaporation, is not the dominant mechanism for the formation of gas phase COMs in dark clouds. Gas phase chemistry triggered by the evaporation of methanol seems to be efficient enough to produce methyl formate and di-methyl ether in similar quantities with abundances of a few percents with respect to methanol (Balucani et al., 2015; Jiménez-Serra et al., 2016). It should be noted that these results highly depend on the choice of poorly constrained rate coefficients for some key gas phase reactions.
The higher abundances of these two COMs in protostellar cores with respect to the “lukewarm” species suggests either that the bulk of their molecular material is formed afterwards under warmer conditions or that the “lukewarm” COMs are destroyed under warmer conditions. High angular resolution observations, allowing us to spatially resolve the hot cores around high- and low-mass sources, are therefore needed to follow the evolution of these complex species with the evolutionary stage of star formation.
5 Conclusions
This work presents the detection of several Complex Organic Molecules (COMs)
towards the “methanol hotspot” located between two dense cores of
the Barnard 5 Molecular Cloud. Through the use of LTE and non-LTE
methods, we have been able to derive the abundances of the targeted
COMs with respect to methanol, their likely parent molecule.
We summarise here the main conclusions of this work:
1) The efficient non-thermal evaporation of methanol and water is
accompanied by the detection of various COMs in high abundances,
between and % with respect to methanol.
2) Formic acid has been detected in its two
conformers trans and cis. The cis/trans
abundance ratio of 6 % confirms that formic acid would be mostly formed at
the surface of interstellar grains and then released into the gas
phase through non-thermal evaporation processes since the
photoswitching mechanism proposed by Cuadrado et al. (2016) can be ruled
out in this region.
3) The non-LTE RADEX analysis of the methanol emission allowed us to
constrain precisely the physical conditions associated with the
observed emission. The methanol emission would originate from a dense
( cm-3) and cold ( K) gas,
consistent with the center part of dense cores, compatible with the
findings by Bacmann & Faure (2016) in a sample of prestellar cores.
4) Our targeted COMs can be defined as “lukewarm” or “warm” species,
according to their rotational temperatures in a sample of massive
hot cores (see Isokoski et al., 2013).
Comparison with other observations confirms that “lukewarm” and “warm”
COMs form and show similar abundances in low-density cold gas, just as
in dense cores – unlike in protostellar cores where the “warm” COMs
tend to be more abundant than the “lukewarm” species.
The evolution of abundances from dark clouds to protostellar cores
suggests either that “warm” COMs are indeed mostly formed in
protostellar environments and/or that “lukewarm” COMs are efficiently
destroyed in warm conditions.
5) The low [glycol aldehyde]/[methyl formate] abundance ratio of % suggests
that surface chemistry is not the dominant mechanism for the formation
of methyl formate, and possibly also of di-methyl ether.
Acknowledgements.
The authors are grateful to the IRAM staff for successfully carrying out the IRAM 30m observations and to the NRO staff for their excellent support. V. T. thanks S. Sadavoy for sharing the properties of the Barnard 5 dense cores and N. Sakai for her help in preparing the NRO observations. Astrochemistry in Leiden is supported by the European Union A-ERC grant 291141 CHEMPLAN. E.S.W. acknowledges generous financial support from the Swedish National Space Board. S.B.C. is supported by NASA’s Emerging Worlds and the Goddard Center for Astrobiology.References
- André et al. (2010) André, P., Men’shchikov, A., Bontemps, S. et al. 2010, A&A, 518, L102
- Bacmann et al. (2012) Bacmann, A., Taquet, V., Faure, A. et al. 2012, A&A, 541, L12
- Bacmann & Faure (2016) Bacmann, A. and Faure, A. 2016, A&A, 587, A130
- Balucani et al. (2015) Balucani, N., Ceccarelli, C. and Taquet, V. 2015, MNRAS, 449, L16
- Batrla & Menten (1988) Batrla, W. and Menten, K. M. 1988, ApJ, 329, L117
- Belloche et al. (2009) Belloche, A., Garrod, R. T., Müller, H. S. P. et al. 2009, A&A, 499, 215
- Belitsky et al. (2015) Belitsky, V., Lapkin, I., Fredrixon, M. et al. 2015, A&A, 580, A29
- Bertin et al. (2016) Bertin, M., Romanzin, C., Doronin, M. et al. 2016, ApJ, 817, L12
- Bisschop et al. (2007) Bisschop, S. E., Jørgensen, J. K., van Dishoeck, E. F., and de Wachter, E. B. M. 2007, A&A, 465, 913-929
- Bizzocchi et al. (2014) Bizzocchi, L., Caselli, P., Spezzano, S. and Leonardo, E. 2014, A&A, 569, A27
- Blake et al. (1987) Blake, G. A., Sutton, E. C., Masson, C. R. and Phillips, T. G. 1987, ApJ, 315, 621-645
- Bockelee-Morvan et al. (2000) Bockelée-Morvan, D., Lis, D. C., Wink, J. E. et al. 2000, A&A, 353, 1101
- Bottinelli et al. (2004a) Bottinelli, S., Ceccarelli, C., Lefloch, B. et al. 2004, ApJ, 615, 354-358
- Bottinelli et al. (2004b) Bottinelli, S., Ceccarelli, C., Neri, R. et al. 2004b, ApJ, 617, L69
- Bottinelli et al. (2007) Bottinelli, S., Ceccarelli, C., Williams, J. P., and Lefloch, B. 2007, A&A, 463, 601-610
- Brown et al. (1984) Brown, W. L., Augustyniak, W. M., Marcantonio, K. J. et al. 1984, Nuclear Instruments and Methods in Physics Research B, 1, 307
- Caselli et al. (2010) Caselli, P., Keto, E., Pagani, L. et al. 2010, A&A, 521, L29
- Caselli et al. (2012) Caselli, P., Keto, E., Bergin, E. A. et al. 2012, ApJ, 759, L37
- Cazaux et al. (2003) Cazaux, S., Tielens, A. G. G. M., Ceccarelli, C., Castets, A., Wakelam, V., Caux, E., Parise, B. and Teyssier, D. 2003, ApJ, 593, L51-L55
- Cernicharo et al. (2012) Cernicharo, J., Marcelino, N., Roueff, E. et al. 2012, ApJ, 759, L43
- Charnley et al. (1992) Charnley, S. B., Tielens, A. G. G. M., and Millar, T. J. 1992, ApJ, 399, L71-L74
- Charnley (1997) Charnley, S. B. 1997, IAU Colloq. 161, 89
- Coutens et al. (2015) Coutens, A., Persson, M. V., Jørgensen, J. K., Wampfler, S. F. and Lykke, J. M. 2015, A&A, 576, A5
- Crapsi et al. (2007) Crapsi, A., Caselli, P., Walmsley, M. C. and Tafalla, M. 2007, A&A, 470, 221
- Cruz-Diaz et al. (2016) Cruz-Diaz, G. A., Martín-Doménech, R., Muñoz Caro, G. M. and Chen, Y.-J. 2016, accepted for publication in A&A
- Chuang et al. (2016) Chuang, K.-J., Fedoseev, G., Ioppolo, S., van Dishoeck, E. F. and Linnartz, H. 2016, MNRAS, 455, 1702
- Cuadrado et al. (2016) Cuadrado, S., Goicoechea, J. R., Roncero, O., Aguado, A., Tercero, B., and Cernicharo, J. 2016, A&A, 596, L1
- Dartois et al. (2015) Dartois, E., Augé, B., Boduch, P. et al. 2015, A&A, 576, A125
- Faure et al. (2014) Faure, A., Remijan, A. J., Szalewicz, K. and Wiesenfeld, L. 2014, ApJ, 783, 72
- Fedoseev et al. (2015) Fedoseev, G., Cuppen, H. M., Ioppolo, S., Lamberts, T. and Linnartz, H. 2015, MNRAS, 448, 1288
- Friberg et al. (1988) Friberg, P., Hjalmarson, A., Madden, S. C., & Irvine, W. M. 1988, A&A, 195, 281
- Garrod & Herbst (2006) Garrod, R. T., and Herbst, E. 2006, ApJ, 936, 13
- Garrod et al. (2008) Garrod, R. T., Weaver, S. L. W. and Herbst, E. 2008, ApJ, 682, 283-302
- Garrod (2013) Garrod, R. T. 2013, ApJ, 765, 60
- Geppert et al. (2006) Geppert, W. D., Hamberg, M., Thomas, R. D. et al. 2006, Faraday Discussions, 133, 177
- Gerin et al. (2015) Gérin, M., Pety, J., Fuente, A., Cernicharo, J., Commerçon, B. and Marcelino, N. 2015, A&A, 577, L2
- Gibb et al. (2004) Gibb, E. L., Whittet, D. C. B., Boogert, A. C. A. and Tielens, A. G. G. M. 2004, ApJS, 151, 35
- Goldsmith & Langer (1999) Goldsmith, P. F. and Langer, W. D. 1999, ApJ, 517, 209
- Goumans et al. (2008) Goumans, T. P. M., Uppal, M. A. and Brown, W. A. 2008, MNRAS, 384, 1158
- Gratier et al. (2016) Gratier, P., Majumdar, L., Ohishi, M., Roueff, E., Loison, J. C., Hickson, K. M., and Wakelam, V. 2016, ApJS, 225, 25
- Green (1986) Green, S. 1986, NASA Technical Memorandum 87791
- Guzman et al. (2014) Guzmán, V. V., Pety, J., Gratier, P. et al. 2014, Faraday Discussions, 168, 103
- Hatchell et al. (2005) Hatchell, J., Richer, J. S., Fuller, G. A., Qualtrough, C. J., Ladd, E. F. and Chandler, C. J. 2005, A&A, 440, 151
- Herbst & van Dishoeck (2009) Herbst, E. and van Dishoeck, E. F. 2009, ARA&A, 47, 427-480
- Hirota et al. (2008) Hirota, T., Bushimata, T., Choi, Y. K., Honma, M. et al. 2008, PASJ, 60, 37
- Horn et al. (2004) Horn, A., Møllendal, H., Sekiguchi, O., Uggerud, E., Roberts, H., Herbst, E., Viggiano, A. A., and Fridgen, T. D. 2004, ApJ, 611, 605-614
- Ioppolo et al. (2011) Ioppolo, S., Cuppen, H. M., van Dishoeck, E. F. and Linnartz, H. 2011, MNRAS, 410, 1089
- Irvine et al. (1989) Irvine, W. M., Friberg, P., Kaifu, N., et al. 1989, ApJ, 342, 871
- Irvine et al. (1990) Irvine, W. M., Friberg, P., Kaifu, N., Matthews, H. E. et al. 1990, A&A, 229, L9
- Isokoski et al. (2013) Isokoski, K., Bottinelli, S. and van Dishoeck, E. F. 2013, A&A, 554, A100
- Jiménez-Serra et al. (2016) Jimenénez-Serra, I., Vasyunin, A. I., Caselli, P., Marcelino, N., Billot, N. et al. 2016, ApJL, 830, L6
- Jørgensen et al. (2005) Jørgensen, J. K., Bourke, T. L., Myers, P. C. et al. 2005, ApJ, 632, 973-981
- Jørgensen et al. (2011) Jørgensen, J. K., Bourke, T. L., Nguyen Luong, Q., and Takakuwa, S. 2011, A&A, 534, A100
- Jørgensen et al. (2012) Jørgensen, J. K., Favre, C., Bisschop, S. E. et al. 2012, ApJ, 757, L4
- Jørgensen et al. (2016) Jørgensen, J. K., van der Wiel, M. H. D., Coutens, A. et al. 2016, submitted to A&A
- Kuan et al. (2004) Kuan, Y.-J., Huang, H.-C., Charnley, S. B. et al. 2004, ApJ, 616, L27-L30
- Lattanzi et al. (2008) Lattanzi, V., Walters, A., Drouin, B. J., Pearson, J. C. 2008, ApJS, 176, 536
- Luca et al. (2002) Luca, A., Voulot, A. D., and Gerlich, D. D WDS ’02 (Prague) Proceedings of Contributed Papers, 2002, PART II, 294
- Matthews et al. (1985) Matthews, H. E., Friberg, P., & Irvine, W. M. 1985, ApJ, 290, 609
- Maury et al. (2014) Maury, A. J., Belloche, A., André, P. et al. 2014, A&A, 563, L2
- Millar et al. (1991) Millar, T. J., Herbst, E., and Charnley, S. B. 1991, ApJ, 369, 147-156
- Minissale et al. (2016) Minissale, M., Dulieu, F., Cazaux, S., & Hocuk, S. 2016, A&A, 585, A24
- Öberg et al. (2009) Öberg, K. I., Garrod, R. T., van Dishoeck, E. F. and Linnartz, H. 2009, A&A, 504, 891-913
- Öberg et al. (2010) Öberg, K. I., Bottinelli, S., Jørgensen, J. K., and van Dishoeck, E. F. 2010, ApJ, 716, 825-834
- Öberg et al. (2011) Öberg, K. I., Boogert, A. C. A., Pontopiddan, K. M., et al. 2011, ApJ, 740, 109
- Occhiogrosso et al. (2014) Occhiogrosso, A., Vasyunin, A., Herbst, E. et al. 2014, A&A, 564, A123
- Ohishi et al. (1991) Ohishi, M., Kawaguchi, K., Kaifu, N. et al. 1991, Astronomical Society of the Pacific Conference Series, 16, 387
- Ohishi et al. (1992) Ohishi, M., Irvine, W. M., Kaifu, N. 1992, IAU Symposium, 150, 171
- Ohishi & Kaifu (1998) Ohishi, M. & Kaifu, N. 1998, Faraday Discussions, 109, 205
- Persson et al. (2012) Persson, M. V., Jørgensen, J. K., and van Dishoeck, E. F. 2012, A&A, 541, A39
- Rabli & Flower (2010) Rabli, D. and Flower, D. R. 2010, MNRAS, 406, 95
- Reboussin et al. (2014) Reboussin, L., Wakelam, V., Guilloteau, S. and Hersant, F. 2014, MNRAS, 440, 3557
- Sadavoy (2013) Sadavoy, S. I. 2013, PhD thesis, University of Victoria
- Shen et al. (2004) Shen, C. J., Greenberg, J. M., Schutte, W. A. and van Dishoeck, E. F. 2004, A&A, 415, 203
- Spezzano et al. (2016) Spezzano, S., Bizzocchi, L., Caselli, P., Harju, J., and Brünken, S. 2016, A&A, 592, L11
- Taquet et al. (2015) Taquet, V., López-Sepulcre, A., Ceccarelli, C. et al. 2015, ApJ, 804, 81
- Taquet et al. (2016) Taquet, V., Wirström, E., Charnley, S. B. 2016, ApJ, 821, 46
- Tercero et al. (2015) Tercero, B., Cernicharo, J., López, A. et al. 2015, A&A, 582, L1
- van der Tak et al. (2007) Van der Tak, F.F.S., Black, J.H., Schöier, F.L., Jansen, D.J., and van Dishoeck, E.F. 2007, A&A468, 627
- Vastel et al. (2014) Vastel, C., Ceccarelli, C., Lefloch, B., and Bachiller, R. 2014, ApJ, 795, L2
- Vasyunin & Herbst (2013) Vasyunin, A. I. and Herbst, E. 2013, ApJ, 769, 34
- Wirstrom et al. (2014) Wirström, E. S., Charnley, S. B., Persson, C. M., Buckle, J. V., Cordiner, M. A. and Takakuwa, S. 2014, ApJ, 788, L32
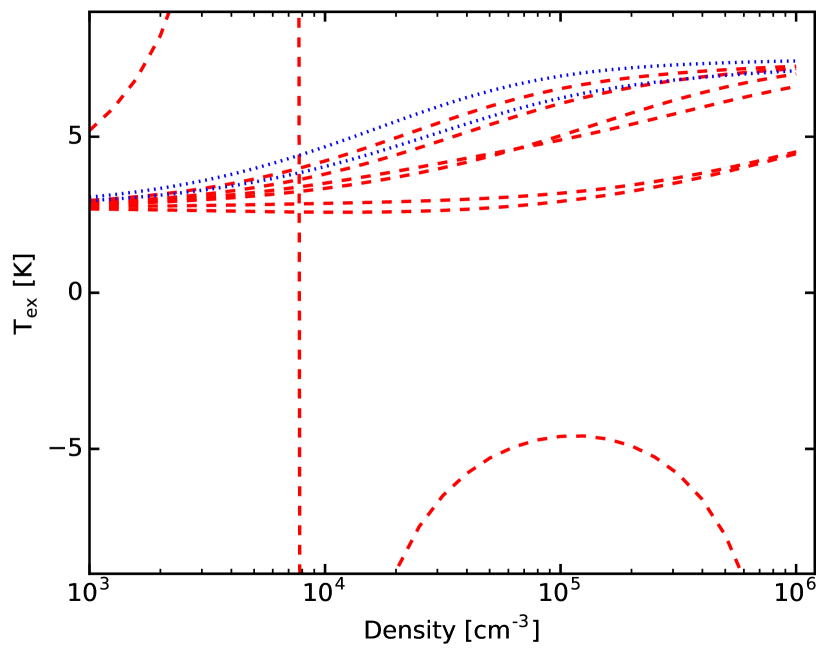
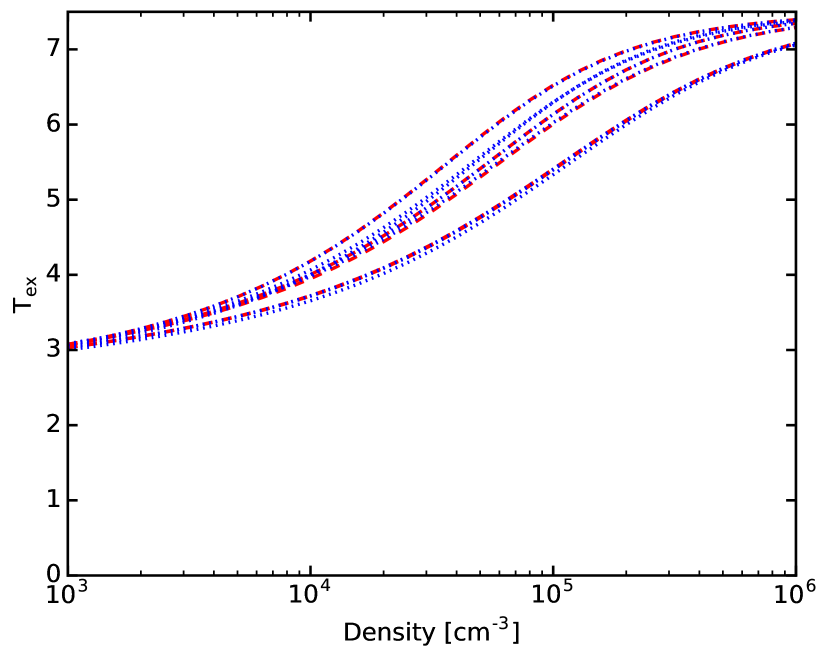
Appendix A Excitation of methanol and methyl formate levels
The excitation temperatures computed with RADEX for the observed methanol and methyl formate transitions as function of the H2 density are shown in Figures 12 and 13 respectively. The column density is the best-fit value listed in Table 3 and is set to 7.5 K. All the methyl formate transitions follow the same trend, their excitation temperatures increase with density from K at cm-3 to reach the kinetic temperature at densities higher than cm-3 showing that most methyl formate transitions in the 3mm band should be thermalised for densities higher than cm-3. For methanol, the situation is more complex. The E-CH3OH transition at 84.521 GHz shows a negative excitation temperature for densities higher than cm-3, showing that this inversion population of the doublet is a robust phenomenon. This transition is known to be a strong maser since its detection towards the massive protostar DR21(OH) by Batrla & Menten (1988), explaining its bright emission in our data. Other CH3OH transitions show positive excitation temperatures but do not follow the same trend with the density. The two , E- transitions at 157 GHz show lower ( K) excitation temperatures than other transitions. Their excitation temperatures remain lower than 5 K even at high densities whilst the excitation temperature of other transitions is close to the kinetic temperature. As already shown in many previous publications, the thermalisation conditions of the CH3OH transitions strongly depend on their critical densities, which can highly vary between different upper level quantum numbers. As an example, the detected (), E- transitions have critical densities higher than cm-3 whilst the (), E- transitions show critical densities of cm-3 at 10 K, explaining their different excitation temperatures.