Detection of a Substantial Molecular Gas Reservoir in a brightest cluster galaxy at
Abstract
We report the detection of CO(2-1) emission coincident with the brightest cluster galaxy (BCG) of the high-redshift galaxy cluster SpARCS1049+56, with the Redshift Search Receiver (RSR) on the Large Millimetre Telescope (LMT). We confirm a spectroscopic redshift for the gas of 1.70910.0004, which is consistent with the systemic redshift of the cluster galaxies of . The line is well-fit by a single component Gaussian with a RSR resolution-corrected FWHM of 56963 km/s. We see no evidence for multiple velocity components in the gas, as might be expected from the multiple image components seen in near-infrared imaging with the Hubble Space Telescope. We measure the integrated flux of the line to be 3.60.3 Jy km s-1 and, using = 0.8 M⊙(K km s pc2)-1 we estimate a total molecular gas mass of 1.10.11011 M⊙ and a MH2/M 0.4; This is the largest gas reservoir detected in a BCG above to date. Given the infrared-estimated star formation rate of 860130 M⊙yr-1, this corresponds to a gas depletion timescale of 0.1Gyr. We discuss several possible mechanisms for depositing such a large gas reservoir to the cluster center – e.g., a cooling flow, a major galaxy-galaxy merger or the stripping of gas from several galaxies – but conclude that these LMT data are not sufficient to differentiate between them.
1 Introduction
Brightest cluster galaxies (BCGs) occupy special locations in the universe. Because of this they likely experience evolutionary paths which are likewise special and unique, compared to other massive galaxies. A picture has emerged whereby BCGs have grown in stellar mass by roughly a factor of 2 since 1 (e.g., Lidman et al., 2012; Zhang et al., 2016), through the dry accretion of satellite galaxies. In this scenario, most of the stellar mass of BCGs is produced at higher redshifts in smaller systems, and assembled into the BCG at later times (De Lucia & Blaizot, 2007). Evidence is now mounting, however, that beyond z1, significant in-situ star formation may be occurring, rivalling the stellar mass build-up through dry mergers (Webb et al., 2015b; McDonald et al., 2016). Although the occurrence of star formation in high-redshift BCGs is now established, the processes that fuel and trigger the star formation are poorly understood.
At low redshifts, though rare, star forming BCGs primarily reside in cool-core clusters and the star formation rate is correlated with the cooling time of the X-ray gas (e.g., Rawle et al., 2012). This appears to indicate that star formation in low-redshift BCGs is fuelled by large-scale cooling flows. Many of these systems also exhibit immense reservoirs of cold gas traced through the measurement of CO (e.g. Edge, 2001). At higher redshift the situation is less clear, though McDonald et al. (2014) has detected CO(3-2) in the Phoenix cluster with similar morphology (Russell et al., 2016).
Recently, however Webb et al. (2015b) and McDonald et al. (2016) have suggested that beyond 1 star formation in BCGs is driven by a different process: gas rich major mergers occurring at the center of galaxy clusters. This conclusion is motivated by the change in slope of the specific star formation rate with redshift (McDonald et al., 2016) and one case study of an apparent gas-rich BCG merger (Webb et al., 2015a) in the galaxy cluster SpARCS1049+56.
SpARCS1049+56 is a red-sequence-selected galaxy cluster with a star bursting core. This system is one of a larger sample of 1.8 clusters, drawn from the Spitzer Adaptation of the Red Sequence Cluster Survey (SpARCS) (Muzzin et al., 2009; Wilson et al., 2009), whose brightest cluster galaxies (BCGs) exhibit signs of intense star formation (Webb et al., 2015b, Bonaventura et al., in press). It is spectroscopically confirmed through 27 cluster members (Webb et al., 2015a) and the richness-estimated mass of M 41014M⊙ is in good agreement with the weak lensing estimate of 31014 M⊙ (J. Jee personal communication). Its BCG is coincident with intense infrared emission of LIR = 6.21012 L⊙ with an AGN-corrected star formation rate (SFR) of 860 M⊙ yr-1. The HST image has revealed optical morphology that is consistent with a major galaxy merger: a long tidal tail with 10 UV-luminious clumps arranged like ‘beads-on-a-string’. These clumps appear to originate within the stellar halo of the BCG and extend for 60 kpc.
Here we present the detection of molecular gas in SpARCS1049+56 through a measurement of the CO (2-1) line with the Redshift Search Receiver (RSR) on the Large Millimeter Telescope (LMT). To our knowledge, it is the first detection of molecular gas in a BCG beyond . It offers a new opportunity to study the gas that fuels star formation in BCGs at high redshift. In the following we present the basic properties of the gas reservoir and discuss various gas deposition mechanisms.
Throughout we choose a flat cold dark matter cosmology with = 75 km s-1 Mpc-1, and . When required we adopt a Chabrier IMF.
2 Observations
2.1 Redshift Search Receiver Observations with the Large Millimeter Telescope
Observations were obtained using the Redshift Search Receiver (RSR) on the 32 meter Large Millimeter Telescope (Hughes et al., 2010) on April 11-12, 2016 and February 18-19, 2017 for a total of 6 hours. The wide bandwidth of the RSR covers the frequency window of 73–111 GHz simultaneously with a spectral resolution of 31.25 MHz (110 km s-1 at 85 GHz). The redshifted CO (2–1) line ( GHz) at falls near the center of the spectrometer band at GHz. Observing conditions were excellent with . The final spectrum shown in Fig. 1 was produced by calibrating and averaging the raw data using the facility data reduction software DREAMPY.
3 Results
3.1 Detection and Characterization of the CO Line
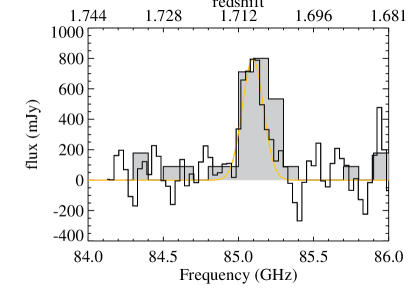
Fig. 1 shows the RSR spectrum, zoomed in on CO(2-1) line. To characterize the line we performed MCMC fitting of a Gaussian function on the data (Cybulski et al., 2016). We fit over a 2 GHz bandwidth centered at 85 GHz, with a low order baseline removal. We measure the integral line flux to be 3.590.34 Jy km s-1, providing detection significance of S/N = 10.7. The line centroid is 85.09610.0131 GHz and it has a RSR-resolution corrected FWHM of 56963 km s-1.
We calculate an integrated source brightness temperature of 1.160.101011 K km s-1 pc2 using:
| (1) |
where S is the integral line flux in Jy km s-1, is the luminosity distance and is the observed frequency.
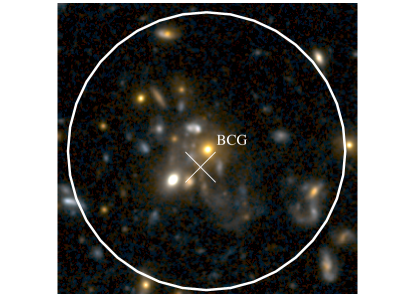
In Fig. 2 we show a zoom-in on the HST image of the BCG and its surroundings (Webb et al., 2015a), with the LMT pointing position indicated. The LMT beam at 3mm (100 GHz) is 25 arcseconds FWHM which encompasses the 100 kpc surrounding the BCG, and all of the related substructure seen in Fig. 2. Thus, the measured value for should be taken as a lower-limit since, if the peak of the emission is actually off-axis, centered on one of the clumps in the tidal tail for example, the beam response function will result in an under-estimate of the emission. We note, however, that there is only one Spitzer Space Telescope MIPS source within the beam and it is within 2 arcseconds of the pointing center. This source is detected at a significance of 10.
3.2 Inferred Gas Properties
The integrated source brightness temperature, determined in the previous section, can be used to estimate the total mass of molecular hydrogen (Solomon et al., 1992):
| (2) |
where is the CO-to-H2 conversion factor and provides a correction from the flux of the higher order J transitions to that of CO(1-0). Here we adopt an value of 0.85 (Carilli & Walter, 2013) and (K km s-1 pc2)-1; this is appropriate for ultraluminous infrared galaxies (ULIRGs) and provides a conservative estimate on the total gas mass. We find a molecular gas mass of 1.10.1 1011M⊙. We note, however, that, as reviewed by Carilli & Walter (2013) and Bolatto et al. (2013), the CO-to-H2 conversion is subject to some uncertainty, especially for star-forming systems and can be as high as (K km s-1 pc2)-1 for main sequence galaxies (Decarli et al., 2016) and Daddi et al. (2010a).
4 Discussion
The precise line fitting provides us with a very accurate redshift for the CO gas of 1.70910.0004. This is in excellent agreement with the systemic redshift of the galaxy cluster (Webb et al., 2015a) of , estimated from an average of optical redshifts of 27 confirmed cluster members (Webb et al., 2015a). This suggests that the CO emission is indeed coming from the center of the cluster potential, spatially near the BCG, and is not a projection along the line of sight from a galaxy on the outskirts of the cluster.
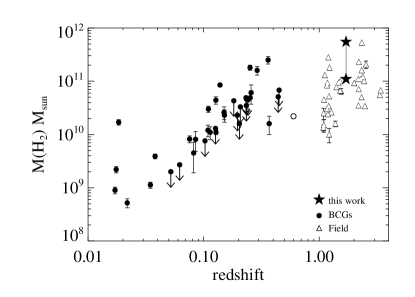
Thus, these results indicate that a vast reservoir, 1.10.1 1011M⊙, of molecular gas has been deposited into the center of this galaxy cluster, and has formed the fuel source for a phase of rapid star formation. To place this measurement in context we show, in Fig. 3, a compilation of molecular gas masses for comparable systems. We include the massive star-forming galaxies at 1 from Genzel et al. (2010) and Decarli et al. (2016) as well as lower redshift () BCGs (Edge, 2001; McDonald et al., 2013; McNamara et al., 2014; Russell et al., 2014; Vantyghem et al., 2016). SpARCS1049 lies at the average of the mass distribution for CO detected systems.
In Webb et al. (2015a), before the CO detection presented here, we speculated that the gas feeding the star formation might have been transported from the outskirts of the cluster via a single gas-rich massive galaxy, due to the merger-like optical morphology of the system. At low redshift such an event is generally thought to be difficult to achieve due to the removal of the interstellar medium (ISM) of infallling galaxies by the intra-cluster medium (ICM). At high redshift, however, galaxies not only start their descent into the galaxy cluster potential with higher fractions of molecular gas, clusters themselves are younger and may have ICM’s that are less effective at ISM removal than at low redshift. While the major-merger picture is in line with other studies (McDonald et al., 2016), these data now raise several questions.
The emission is well-fit by a single Gaussian and shows no sign of multiple velocity peaks. This is perhaps unexpected given the multiple spatial components and merger-like morphology seen in the rest-frame optical (Fig. 2) and is also unlike many other CO-detected systems at high redshift. The sample of Greve et al. (2005), for example, presents several cases (30-50% of the sample) of dual-peaked CO spectra with velocity offsets of several hundreds km/s, which they conclude are produced through major mergers. Similar dynamic structure is seen in the famous local Antennae galaxies (Gao et al., 2001; Schulz et al., 2007). The lack of such a signature in our data raises the possibility, but is not unambiguous evidence, that the molecular gas, and thus the star formation, is not distributed over the same multiple objects as the optical/UV emission. Rather, it may be concentrated in a single dynamically distinct region.
We posit two possible scenarios in which a gas-rich merger is not required to produce the large amount of star formation we see. (1) The gas deposit may be the result of the stripping of many galaxies within the cluster center. In this case it may be that the multiple stellar clumps have also come from several objects. Such a process would allow for a large build-up of gas which would have a velocity dispersion that traces the overall velocity dispersion of the cluster. The velocity dispersion of the cluster is poorly constrained (430 km/s) but, given the existing velocities and its mass of 41014M⊙ (Webb et al., 2015a), it is roughly a factor of two larger than the velocity dispersion of the gas (Fig.1, FWHM 560 km/s or 250 km/s.) This is weak evidence against the idea that the gas has been stripped from many cluster members. (2) The gas could flow to the center of the cluster through a large-scale cooling flow, as we see in many lower-redshift clusters (such as Phoenix (McDonald et al., 2013)). The complex optical morphology may indicate that cooling has been been triggered through the disruption of centralized heating processes via a collision between an infalling galaxy and the BCG (M. Voit, personal communication).
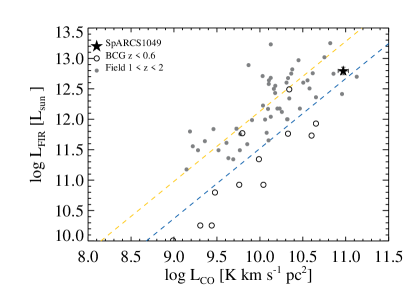
Using our ancillary data we can attempt some interesting comparisons to measurements at other wavelengths in the hope they may shed light on the origin of the gas. Perhaps the simplest is the relation between the molecular gas luminosity (L) and the total infrared luminosity (LIR), since it is likely these emissions are indeed spatially co-located. Several sources of infrared imaging are available for this cluster: Herschel Space Observatory, Spitzer Space Telescope and the James Clerk Maxwell Telescope. We reiterate that in the highest resolution infrared imaging available (Spitzer Space Telescope MIPS) there is only one infrared source within the 25 arc second LMT beam, and therefore it is unlikely that the CO emission is coming from multiple sources separated by more than a few arc seconds. The infrared luminosity was measured in Webb et al. (2015a) by fitting a template spectral energy distribution (SED) to the 24/250/350/450/500/850m flux measurements. In Fig. 4 we show the position of the SpARCS1049 BCG system on the LLIR plane, compared to several other measurements of field galaxies at and lower redshift BCGS, drawn from the literature. We see that although SpARCS1049 is extreme in its properties, in that it is relatively IR- and CO-bright, it lies within the distribution of other infrared luminous galaxies at similar redshifts, inside and outside of clusters.
These measurements indicate that even with such a large reservoir of molecular gas, the gas consumption timescale of SpARCS1049+56 remains rapid, = MH2/SFR 0.1 Gyrs, because of the prodigious SFR. Although on the short end, this is within the normal range of local and high-redshift star forming galaxies (Saintonge et al., 2011). Concerning the origin of the gas, however, the comparison has very little diagnostic power. The literature sample comprises a heterogeneous mixture of QSOs, HzRGs, SMGs, 24m-selected, BzK, ERO, and BMBX galaxies as well as cooling flow-fed BCGS. Thus, despite the fact that these galaxies likely have different gas accretion mechanisms (mergers, cold-flows, cluster cooling flows) they exhibit similar LLIR properties.
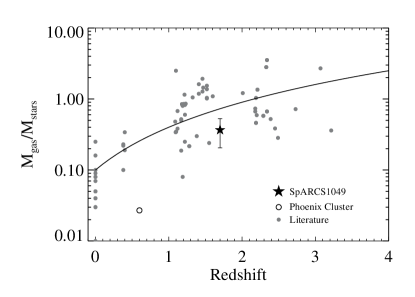
The molecular-mass-to-stellar-mass ratio (MM⋆) is shown in Fig.5. This is a difficult quantity to estimate because we do not know from which stellar mass component the CO originates. We adopt the stellar mass of the BCG (Webb et al., 2015a) and see once again that this value of MM 0.4 is in good agreement with that of other high-redshift ULIRGs. We do not compare to the values of lower redshift BCGs in this case as the BCGs of Edge (2001) do not have published stellar masses. This agreement with field systems indicates that if the source of the gas was a single accreted galaxy, it must have had a mass within a factor of 5 the BCG mass, otherwise MM⋆ would be too high, in comparison to other similar systems. Alternatively, this ratio could be explained by the accretion of several lower mass galaxies, each with a MM 0.4.
Understanding the role of the three possible gas deposition processes – major merger, multiple galaxies, cooling flow – will clearly require additional observations, such as X-ray imaging or high-resolution integral field spectroscopy. Moreover the synthesis of these results with data at other wavelengths is not straightforward due to the confused morphology of the system and the large beam size of the facility used in this study, since it is not possible to tell from these data physically where the CO emission originates (recall Fig. 2). Because of this, higher resolution CO observations are imperative. Finally, although SpARCS1049+56 has been drawn from a larger sample of BCGs we do not yet know if it is representative, and thus more CO observations of high redshift BCGs are warranted.
5 Conclusions
We report the 10.7 detection of molecular gas, via CO(2-1) observations with the LMT, in the center of the galaxy cluster, SpARCS1049+56. This is the first detection of molecular gas coincident with a BCG above . We draw several conclusions:
The high-precision redshift of the CO(2-1) line of 1.70910.0004 indicates that the molecular gas is located at the center of the gravitational potential of the cluster. It is therefore unlikely that the CO emission is due to a cluster member seen along the line-of-sight to the BCG.
The CO (2-1) line is well fit by a single Gaussian and shows no evidence for multiple velocity peaks. Its broad width of FWHM 56963 km/s ( 250 km/s) is nevertheless much narrower than the expected overall velocity dispersion of the cluster.
Although it lies on the upper-end of the relation, the LLIR ratio of the system is in good agreement with that of other galaxies at similar redshifts (). These galaxies include extreme systems such as the cooling-flow-fed star forming BCG of the Phoenix cluster and merging SMGs, to more ‘normal’ BzK systems.
We infer a molecular gas mass of M 1.10.4 1011 M⊙. Employing the infrared-estimated SFR yields a gas depletion timescale of 0.1 Gyrs. Adopting the stellar mass of the BCG provides an MM⋆ value consistent with other high-redshift ULIRGs (MM).
Although we posit several gas deposition mechanisms these data are not able to differentiate between them. We conclude that more data are required to establish if the immense gas reservoir at the center of this system has been fed by a cooling flow, a major galaxy-galaxy merger or the stripping of gas from several galaxies.
References
- Bolatto et al. (2013) Bolatto, A. D., Wolfire, M., & Leroy, A. K. 2013, ARA&A, 51, 207
- Carilli & Walter (2013) Carilli, C. L., & Walter, F. 2013, ARA&A, 51, 105
- Cybulski et al. (2016) Cybulski, R., Yun, M. S., Erickson, N., et al. 2016, MNRAS, 459, 3287
- Daddi et al. (2010a) Daddi, E., Bournaud, F., Walter, F., et al. 2010a, ApJ, 713, 686
- Daddi et al. (2010b) Daddi, E., Elbaz, D., Walter, F., et al. 2010b, ApJ, 714, L118
- De Lucia & Blaizot (2007) De Lucia, G., & Blaizot, J. 2007, MNRAS, 375, 2
- Decarli et al. (2016) Decarli, R., Walter, F., Aravena, M., et al. 2016, ApJ, 833, 70
- Edge (2001) Edge, A. C. 2001, MNRAS, 328, 762
- Gao et al. (2001) Gao, Y., Lo, K. Y., Lee, S.-W., & Lee, T.-H. 2001, ApJ, 548, 172
- Geach et al. (2011) Geach, J. E., Smail, I., Moran, S. M., et al. 2011, ApJ, 730, L19
- Genzel et al. (2010) Genzel, R., Tacconi, L. J., Gracia-Carpio, J., et al. 2010, MNRAS, 407, 2091
- Greve et al. (2005) Greve, T. R., Bertoldi, F., Smail, I., et al. 2005, MNRAS, 359, 1165
- Hughes et al. (2010) Hughes, D. H., Jáuregui Correa, J.-C., Schloerb, F. P., et al. 2010, in Proc. SPIE, Vol. 7733, Ground-based and Airborne Telescopes III, 773312
- Leroy et al. (2008) Leroy, A. K., Walter, F., Brinks, E., et al. 2008, AJ, 136, 2782
- Lidman et al. (2012) Lidman, C., Suherli, J., Muzzin, A., et al. 2012, MNRAS, 427, 550
- Magnelli et al. (2012) Magnelli, B., Saintonge, A., Lutz, D., et al. 2012, A&A, 548, A22
- McDonald et al. (2013) McDonald, M., Benson, B., Veilleux, S., Bautz, M. W., & Reichardt, C. L. 2013, ApJ, 765, L37
- McDonald et al. (2014) McDonald, M., Swinbank, M., Edge, A. C., et al. 2014, ApJ, 784, 18
- McDonald et al. (2016) McDonald, M., Stalder, B., Bayliss, M., et al. 2016, ApJ, 817, 86
- McNamara et al. (2014) McNamara, B. R., Russell, H. R., Nulsen, P. E. J., et al. 2014, ApJ, 785, 44
- Muzzin et al. (2009) Muzzin, A., Wilson, G., Yee, H. K. C., et al. 2009, ApJ, 698, 1934
- O’Dea et al. (2008) O’Dea, C. P., Baum, S. A., Privon, G., et al. 2008, ApJ, 681, 1035
- Papovich et al. (2016) Papovich, C., Labbé, I., Glazebrook, K., et al. 2016, Nature Astronomy, 1, 0003
- Rawle et al. (2012) Rawle, T. D., Edge, A. C., Egami, E., et al. 2012, ApJ, 747, 29
- Riechers et al. (2010) Riechers, D. A., Carilli, C. L., Walter, F., & Momjian, E. 2010, ApJ, 724, L153
- Russell et al. (2014) Russell, H. R., McNamara, B. R., Edge, A. C., et al. 2014, ApJ, 784, 78
- Russell et al. (2016) Russell, H. R., McNamara, B. R., Fabian, A. C., et al. 2016, MNRAS, 458, 3134
- Saintonge et al. (2011) Saintonge, A., Kauffmann, G., Wang, J., et al. 2011, MNRAS, 415, 61
- Schulz et al. (2007) Schulz, A., Henkel, C., Muders, D., et al. 2007, A&A, 466, 467
- Silverman et al. (2015) Silverman, J. D., Daddi, E., Rodighiero, G., et al. 2015, ApJ, 812, L23
- Solomon et al. (1992) Solomon, P. M., Downes, D., & Radford, S. J. E. 1992, ApJ, 387, L55
- Tacconi et al. (2010) Tacconi, L. J., Genzel, R., Neri, R., et al. 2010, Nature, 463, 781
- Vantyghem et al. (2016) Vantyghem, A. N., McNamara, B. R., Russell, H. R., et al. 2016, ApJ, 832, 148
- Webb et al. (2015a) Webb, T., Noble, A., DeGroot, A., et al. 2015a, ApJ, 809, 173
- Webb et al. (2015b) Webb, T. M. A., Muzzin, A., Noble, A., et al. 2015b, ApJ, 814, 96
- Wilson et al. (2009) Wilson, G., Muzzin, A., Yee, H. K. C., et al. 2009, ApJ, 698, 1943
- Zhang et al. (2016) Zhang, Y., Miller, C., McKay, T., et al. 2016, ApJ, 816, 98