Exciton transport in the PE545 complex: insight from atomistic QM/MM-based quantum master equations and elastic network models
Abstract
In this paper we work out a parameterization of the environment noise within the Haken-Strobl-Reinenker (HSR) model for the PE545 light-harvesting complex based on atomic-level quantum mechanics/molecular mechanics (QM/MM) simulations. We use this approach to investigate the role of different auto- and cross-correlations in the HSR noise tensor, confirming that site-energy autocorrelations (pure dephasing) terms dominate the noise-induced exciton mobility enhancement, followed by site energy-coupling cross-correlations for specific triplets of pigments. Interestingly, several cross-correlations of the latter kind, together with coupling-coupling cross-correlations, display clear low-frequency signatures in their spectral densities in the region 30-70 inverse centimeters. These slow components lie at the limits of validity of the HSR approach, requiring that environmental fluctuations be faster than typical exciton transfer time scales. We show that a simple coarse-grained elastic-network-model (ENM) analysis of the PE545 protein naturally spotlights collective normal modes in this frequency range, that represent specific concerted motions of the subnetwork of cysteines that are covalenty linked to the pigments. This analysis strongly suggests that protein scaffolds in light-harvesting complexes are able to express specific collective, low-frequency normal modes providing a fold-rooted blueprint of exciton transport pathways. We speculate that ENM-based mixed quantum classical methods, such as Ehrenfest dynamics, might be promising tools to disentangle the fundamental designing principles of these dynamical processes in natural and artificial light-harvesting structures.
pacs:
71.35.-y, 03.65.Yz, 87.15.-v, 87.15.H-Keywords: quantum master equations, PE545 complex, bilins, elastic network models
1 Introduction
Environmental effects can strongly influence the dynamics of quantum excitations
in complex media. In the context of photosynthetic complexes [1, 2],
a crucial role is played by the ultrafast process that allows to transfer the energy absorbed
by the pigments from photons to the reaction center during the early stages of photosynthesis.
In this respect, one of most relevant issues concerns the mechanisms that allow a fast and
efficient energy transfer within the complex.
The presence of a noisy protein scaffold that embeds the pigment network represents an essential
feature of the problem. Indeed, at the microscopic level chromophores experience
environment vibrations [3] that produce fluctuations of the local pigment site-energies
and pigment-pigment couplings. Additionally, very slow protein motions contribute to add static
disorder to the unperturbed exciton dynamics.
One of the key findings of recent theoretical research is that in certain regimes noise can act
as a positive factor for transport efficiency.
In particular, it has been shown [4, 5, 6]
that exciton transfer efficiency can be enhanced by pure dephasing noise, that accounts for
site-energy fluctuations due to protein vibrations.
Optimal transport efficiency was found for intermediate amplitudes of the noise strength, in a region
of the parameters compatible with room temperature conditions.
The reason why a certain amount of dephasing is beneficial is that external fluctuations may promote
excitonic transitions that speed up the global transfer process.
Understanding the role of environmental effects on the exciton dynamics necessarily requires a microscopic
description of the environment-induced fluctuations on the electronic degrees of freedom.
Extensive studies [3, 7, 8, 9, 10]
have been performed in order to understand the role of spatio-temporal noise correlations
in site-energy fluctuations and the presence of specific vibrational modes that interact with the
electronic ones.
Although in photosynthetic systems site-energy fluctuations are considerably
larger than fluctuations in the site-site coupling energies [11, 12],
it has been shown by Silbey and
co-workers [13, 14]
that even small, correlated coupling fluctuations may have a deep impact for speeding up the energy transfer process.
Moreover, it was found that nonvanishing correlations between site-energy and coupling fluctuations may strongly
enhance or suppress long-lived oscillations in populations, depending on the sign of the correlation.
These effects were initially studied within a generalized Haken-Strobl-Reineker (HSR) model [15, 16],
where external environmental fluctuations are described in terms of classical Gaussian Markov processes (white noise).
Further studies by Huo and Coker [17] performed with refined numerical techniques [18]
along with more recent ones by other groups [19, 20, 21] using different modified quantum master equation
(QME) approches showed that the same phenomenology persists also with explicit non-Markovian harmonic models of heat bath.
In this paper we focus on the dynamics of the phycoerythrin 545 (PE545) light-harvesting
complex of the marine cryptophyte alga Rhodomonas sp. strain
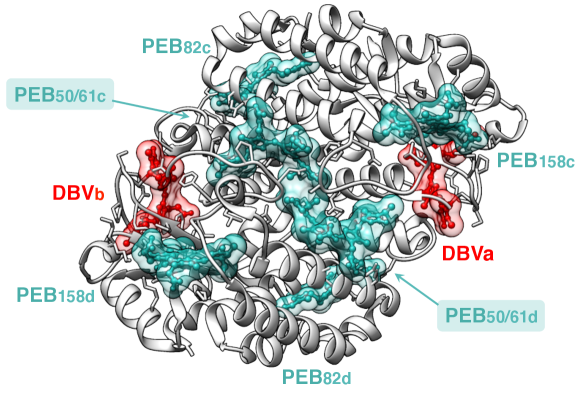
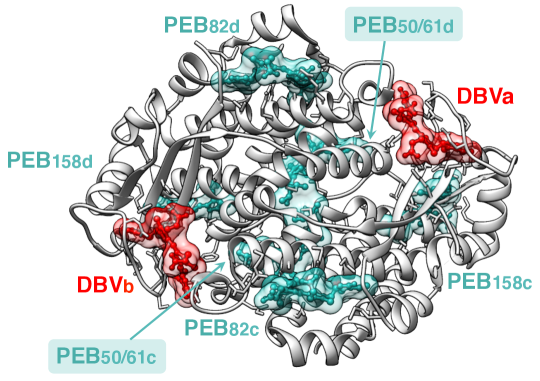
CS24, that comprises 8 bilins [22, 23, 24, 25], see Fig. 1.
This system absorbs very efficiently incident sunlight. Interestingly, recent studies
ascribed this efficiency to the structural flexibility of the
pigments, which allows the modulation of their absorption energy through local
pigment protein interactions [12].
This light-harvesting system seems to work as a funnel, that drives to the surface
the excitons formed in the core of the complex, i.e. at the two strongly coupled PEB 50/61 pigments
(see Fig. 1). This in turn is believed to facilitate the transfer of the
excitonic energy to another complex in the neighborhood or to the reaction center, where the
charge separation process may occur[12].
What is even more interesting, in a recent paper some of the present authors
have shown that the spectral densities of individual
pigments of PE545 may be very different with respect to
those averaged over pseudo-symmetric pairs or over all pigments [26].
This strongly warns against an uniform parameterization of excessively simplistic quantum master equation
approaches, such as Ref. [4],
where a single dephasing rate is assumed to describe the whole extent of possible correlations.
Rather, the need for a proper ab-initio parameterization of QME-based methods is apparent, as it is
the whole range of possible correlations (site-energy/site-energy, coupling/coupling and site-energy/coupling)
that appears to contain the fine details of phonon-mediated exciton transport in
light-harvesting proteins.
The aim of this paper is to clarify the role and the relative weight of
the different types of correlations among
fluctuations, involving both site energies and coupling strengths,
by parametrizing a general HSR quantum master equation directly from
atomistic Quantum-Mechanics/Molecular-Mechanics (QM/MM) simulations.
In section 2, we describe this procedure with the aim of computing
the transport parameters of the complex at room
temperature and study their dependence on the strength of the environment-induced perturbations.
Accordingly, in section 3 we show that the so-called Zeno regime [4, 27],
corresponding to a drop in exciton transfer efficiency at high noise strength
is suppressed by coupling fluctuations at high temperature. However, while the Zeno regime
might be relevant for some materials, as it has been already
been shown by some of the present authors [28], it is certainly
de facto unaccessible to biological macromolecules,
as the protein scaffolds would fall apart well before reaching such high temperatures.
From a theoretical standpoint, we show that the theoretical suppression of the Zeno effect
can be simply interpreted in terms of the emergence of a
classical random walk for the exciton dynamics. In this limit, we show that the quantum master
equation becomes a simple classical Fokker-Planck equation, whose diffusivity tensor is given
by the coupling-coupling correlation matrix.
Furthermore, in section 3 we show that slow frequency components at the limits of validity of the
HSR approach are present in specific cross-correlations.
In section 4 we use an original elastic network model approach
to rationalize the emergence of these low frequencies in terms of specific collective
modes involving preferentially the subnetwork of cysteines that are covalently linked
to the pigments. In section 5 we epitomize our results, discussing critically
HSR based approaches and suggesting an alternative way to dissect the fold-rooted spatiotemporal
signatures of exciton transport in light-harvesting structures based on elastic network models.
2 Reduced quantum master equation from QM/MM simulations
The excitonic two-level system consisting of pigments of the light-harvesting complex can be described by the tight-binding Hamiltonian given by
| (1) |
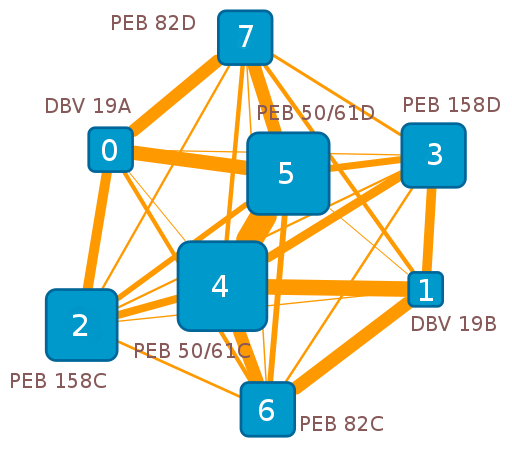
where the state denotes an electronic excitation localized on chromophore . The site energies and pigment-pigment couplings are given by and respectively. For the parametrization of the Hamiltonian of the bilin system we refer to [12], see also the online supporting information. The associated network is shown in Fig. 2, where we identify the nodes of the network from to with the eight bilin molecules of the complex and (weighted) links represent the associated coupling strengths.
.
To include the effect of a thermally fluctuating environment, the original approach of Haken and Strobl [15, 16] requires one to solve a modified problem, described by the Hamiltonian
| (2) |
where the Hermitian operator is a time-dependent perturbation of the Hamiltonian , whose temporal evolution reflects the bath dynamics. In this framework, the so called Haken-Strobl-Reineker model [16, 14] assumes that the environmental fluctuations are classical Gaussian Markovian processes with zero average and correlations given by
| (3) |
where the four-indices tensor is invariant under the following set of index permutations [14]
| (4) |
With the above hypotheses, the information on the external environment is fully encoded in the
tensor .
Finally, to account for the exciton losses due to internal recombination processes
and exciton transfer to the reaction center, we add to the system Hamiltonian an
anti-Hermitian operator defined as
| (5) |
In the above formula, and are the site-dependent recombination and trapping rates, respectively. Altogether, it can be shown [16] that the evolution of the density matrix of the system is described by the following master equation
| (6) |
where the symbols and denote the commutator and
the anti-commutator respectively.
The first term in the r.h.s of Eq. (6) describes the unitary part of
the evolution, the second one incorporates
the dissipative effects defined in Eq. (5), while the third one accounts for the action of the
incoherent noise.
Following Vlaming and Silbey [14], it is instructive to single out three physically
different types of elements of the tensor , namely:
-
1.
Site energy-site energy correlations,
-
2.
Site energy-coupling correlations, with
-
3.
Coupling-coupling correlations, with and
In the following subsection we will discuss how to estimate the bath
tensor directly from atomic-level QM/MM simulations.
2.1 Microscopic description of the exciton environment
All the excitonic parameters (site energies and excitonic couplings in , see Eq. (2)) have been calculated with a polarizable quantum mechanical/molecular mechanical (QM/MMPol) methodology [30] using a trajectory obtained with a ground-state classical MD simulation of PE545 in water (see Ref. [22] for more details). In particular, we extracted 60000 snapshots every 5 fs corresponding to 300 ps of a MD simulation of PE545 for the subsequent QM/MMPol calculations. Because of the considerable computational cost involved in the QM/MMPol calculations, we adopted the ZINDO semi-empirical method [31] to describe the excited states of the pigments, whereas the protein and the solvent were described using a polarizable force field. All details about the QM/MMPol model are reported in Refs [12] and [22]. A detailed study on the parametrization of for PE545 is contained in Ref. [12]. Concerning the environment fluctuations described by the term , the white noise approximation of the HSR model, Eq. (3), assumes that the bath degrees of freedom decorrelate much faster than the typical exciton timescales. Therefore, in this limit, one can formally integrate Eq. (3), writing
| (7) |
where it clearly appears that are related to the zero-frequency
limit of the Fourier transform .
Notice that, despite the integration up to arbitrarily large times in the above formula, the relevant contribution
of correlations to the tensor is expected to come exclusively from very short times.
An instructive example is offered by the case of an exponential decay of the correlation function,
, which gives . In this example defines
the characteristic timescale of bath correlations, so that the contribution to the integral in
Eq. (7) for times is exponentially small in .
By means of Eq. (7), we have computed the elements of the tensor from the
environment correlation functions extracted from QM/MM trajectories.
An effective infrared threshold was imposed, in order to exclude the contribution of slow environmental
correlations which are inconsistent with the HSR white-noise approximation of the exciton-protein coupling dynamics.
Accordingly, in Eq. (7) we have neglected the
correlations displaying a decaying time
(see the supplemental material for further details).
The choice of is a rather delicate point, since on the one hand
should be taken as small as possible for the Markovian approximation to hold, on the other
the limit yields vanishing couplings , thus washing out the whole
environment in the HSR description.
A detailed study of the optimal choice of for the description of the PE545 protein environment
is beyond the scope of the present paper.
Here, we take a pragmatic approach by focusing on the upper bound
of , that is set by the intrinsic excitonic timescales.
In particular, we have chosen ps, which is comparable to the typical exciton transfer timescales
found in Ref. [12] for the PE545 complex. An analysis of the role of for the amplitude
of the HS coefficients is provided at the end of Section 3.
3 HSR coefficients: the white noise approximation
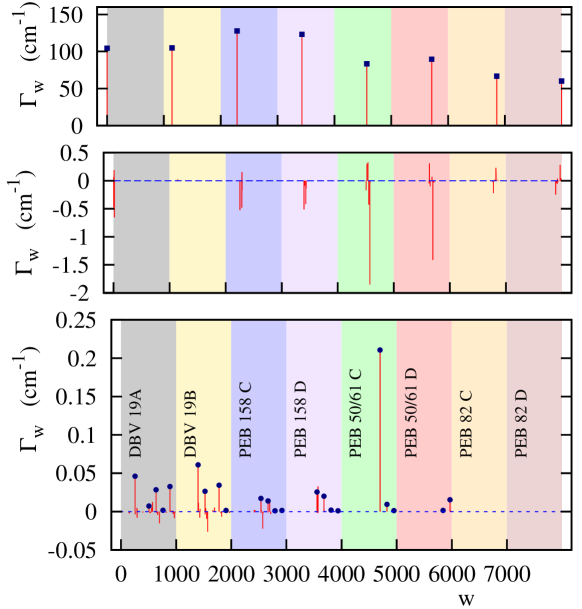
An overall view of the relevant Haken-Strobl couplings obtained with this method provided in Fig. 3, where we separately plot the elements of kind i, ii and iii up to the permutations stated in Eq. (4). Here, in order to represent unambiguously the elements , we have introduced an octal integer ranging from 0 to 7777, whose digits are . For each sector, we therefore plot the nonvanishing coefficients .
Consistently with other studies [11], we find that the relevant contribution
(order cm-1) in the tensor is given by the diagonal terms
in sector . Notice however that these terms display a
clear dependence on the pigment site with an approximate correlation induced by the global geometry of the complex, as also
emphasized in Ref. [26] –
see for instance the two lowest terms
and , which correspond to “antipodal” pigments
PEB 82C and PEB 82D in Fig. 1.
Still within sector , we have found no relevant contributions from site-energies
cross correlations, i.e. with . This is consistent with a previous
study by Schulten et al. for the FMO complex [32] and reinforces
the idea that in general fluctuations in the excitation energies on different
pigments are not significantly correlated on the time scales of exciton transfer.
Concerning sector correlations, the maximum amplitude of is of
order cm-1 in absolute value. Moreover, we find that large couplings typically
correspond to anticorrelations (i.e. negative )
between the site energy of a pigment and a coupling involving the same pigment ,
i.e. for or with .
This last property was already spotlighted in Ref. [33]
from the analysis of static correlation functions.
A more detailed presentation of the environment couplings in sector is provided in the
supplemental material.
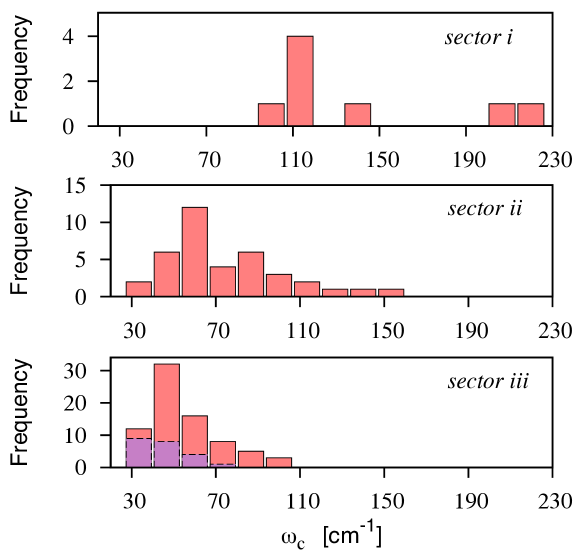
Here, we observe that the largest couplings that emerge in this sector are
cm-1 and cm-1 (see the central panel of Fig. 3).
These correspond to the correlations between the site energies and the coupling of the strongly-interacting central
pair of pigments PEB 50/61C and PEB 50/61D, see Fig. 2.
It is therefore not surprising that all the other couplings in sector are significantly smaller than these two ones.
Moreover, according to the analytical results found by Chen and Silbey [13] in the HSR model, environment
couplings in sector are expected to trigger population oscillations depending on the difference .
Since the relevant terms and have the same sign and comparable absolute amplitude,
we do not expect any relevant phenomenon related to long-lived oscillations in the HSR approximation.
Moving finally to sector , Fig. 3 shows that the
amplitude of all falls below cm-1 except for the
term which is representative of the coupling autocorrelations of the central
couple of pigments. More generally, we find that the non-vanishing terms in this sector typically
correspond to coupling autocorrelations, in the form with ,
(see the blue dots in Fig. 3).
On the other hand, coupling cross correlations with , and
provide a marginal contribution to sector , typically of the order
of cm-1.
A complementary view on the extracted coefficients can be obtained by
formally estimating a time scale for the decay of the associated time correlations. In the simplest
hypothesis of a single finite time decay constant, one should replace eq. (3)
by
| (8) |
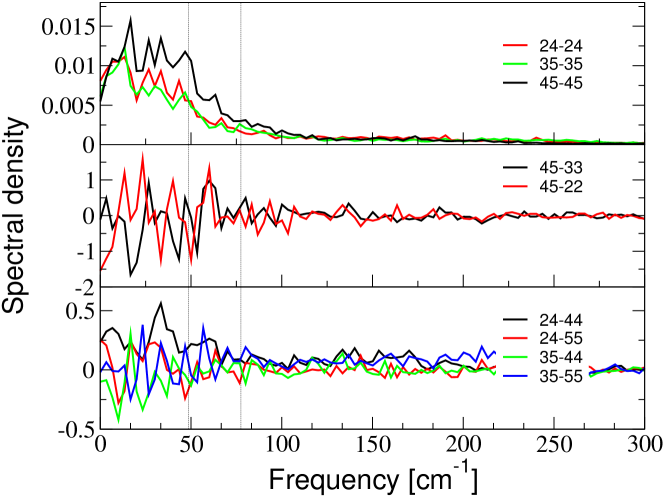
Accordingly an estimate of the spectral width can be obtained from the QM/MM data by consistently fitting a Lorentzian to the cosine Fourier transform of the correlation functions. Fig. 4 displays the result of this analysis for each sector. While site energy autocorrelations (sector ) display a fast decay, correlations in sectors and decay with timescales that are comparable with the typical exciton timescales [12]. More precisely, we find the following ordering with respect to average decreasing : site-energy autocorrelations, site-energy-coupling correlations, couplings cross correlations, coupling autocorrelations. This analysis proves that coupling-coupling autocorrelations lie at the limits of validity of the white-noise approximation intrinsic to the HSR approach. In this sense, exciton transport in proteins would possibly require more sophisticated methods such as used in organics semiconductors, where it is known that coupling-coupling fluctuations are dominated by low-frequency, collective vibrations of the molecular crystal [34, 35, 36] More precisely, in the case of the PE545 protein it turns out that signatures of slow frequency components emerge in the correlations among selected coupling and/or site energy fluctuations. A few typical examples illustrating this behaviour are reported in Fig. 5. Fluctuations with frequencies of the order of a few tens of cm-1 are likely to flag low-frequency, collective normal modes (NM) of the protein matrix, which could potentially spotlight important, fold-rooted motions expressed by the protein scaffold with the aim of selectively promoting transport by helping break localization of exciton wave-functions induced by disorder in the site energies [37, 4]. In section 4 we shall dig further into this hypothesis, with the aim of uncovering whether the PE545 protein structure is indeed able to express specific, potentially functional, transport-enhancing normal modes in the highlighted frequency range. In the next section, we stick to the white-noise approximation and turn to investigate the effect of the QM/MM-based correlations on exciton transport.
3.1 Exciton transfer efficiency
The exciton transfer process can be quantified by means of two simple indicators, namely the transfer efficiency and the average transfer time [4]. These quantities can be computed simply in terms of time evolution of the one-exciton density matrix,
| (9) | |||||
| (10) |
The presence of a finite recombination rate in Eq. (5) introduces a non-specific channel
for exciton losses, that reduces the energy flux towards the specific trapping site. Therefore, the efficiency parameter
quantifies the probability that an exciton is successfully driven to the trap before it recombines.
A typical value of is estimated to be independent of and of order ns-1 [4].
On the other hand, we assume the presence of a single trapping site located on the lowest-energy pigment ()
() [12] with trapping rate of ps-1.
In order to explore the role of environment fluctuations in Eq. 6, we introduce
a linear dependence of on the system temperature , namely where K
denotes room temperature and is the coupling tensor at computed from QM/MM simulations
as discussed in Section 3.
In Fig. 6 we show the parameters and as a function of temperature
for an exciton initially localized on pigment PEB50/61D (site ), i.e. one of the bilins forming the
central pair of strongly interacting pigments (see Fig. 2).
Similarly to previous studies on the FMO complex [4], we find that
at room temperature , the PE545 complex has almost reached the condition of maximum
efficiency and minimum transfer time. Moreover, this quasi-optimum condition is by all practical means
rather insensitive to temperature (note the logarithmic scale on the -axis) in a range of temperatures
where there can be safely asserted that the protein is in its folded, fully functional structure.
It is worthwhile to observe that this temperature range is rather narrow, typically K
around room temperature. It is evident from Fig. 6 that the efficiency and average transfer
times are rather constant in this temperature range (see vertical dashed lines in the top panel).
It should be reminded that, strictly speaking, it is meaningless to consider exciton transport in light-harvesting
systems outside this temperature range.
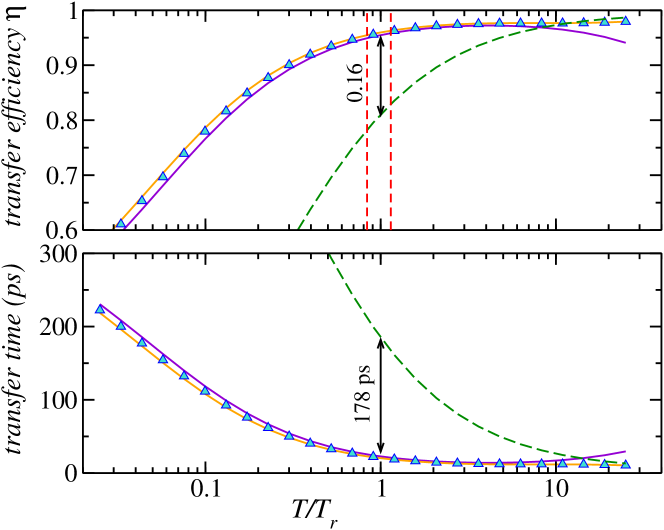
In order to gain a deeper insight on the overall transport phenomenon,
we have repeated the same numerical experiment by selectively “silencing” parts of
the dynamical contributions appearing in Eq. 6.
A first important result is that, for the wide range of temperatures here considered (biologically
relevant and irrelevant), negligible variations
are observed upon neglecting all the possible cross-correlations in (see cyan triangles in
Fig. 6). This suggests that cross correlations in sectors and do not play a
relevant role for the transport properties of the bilin complex. A complete definition of HSR coupling parameters
in the limit of vanishing cross correlations is provided in the supplemental material.
Further insight can be gathered from a further reduction of to a
diagonal tensor with non-vanishing elements of kind , i.e.
the coefficients shown in the upper panel of Fig. 3. The above approximations lead to
the usual description of environmental effects in terms of pure dephasing noise,
where optimal transport was shown to emerge [4] for a finite dephasing rate.
It is clear from Fig. 6 that the characteristic high-temperature efficiency drop (associated
in Ref. [4] with the quantum Zeno effect [27])
is no longer present when generalized correlations beyond pure dephasing are considered.
This result is a direct consequence of the presence of small but non-vanishing coupling
fluctuations, i.e. of terms with , which promote a population transfer between sites
and [15, 16, 13, 14].
A similar effect was recently observed in Ref. [28, 39] within the
framework of an explicit nonlinear quantum-classical hybrid model.
As a general observation, we emphasize that the Zeno-like decrease in efficiency associated with pure
dephasing falls in a temperature range where the protein matrix would be in a wildly denatured state, which means
that such regime is by all means not biologically relevant and could not have been possibly accessed
by evolution. We observe that this conclusion would hold a fortiori were the mapping between
temperature and strength of correlations nonlinear, i.e.
with .
The high-temperature regime can be captured by a simple master equation for purely incoherent population
transfer (a classical random walk) in the form
| (11) |
where only coupling autocorrelations are considered (see green dashed line in Fig. 6).
Eq. (11) is essentially a Fokker-Planck equation for the classical occupation
probability on pigment . As shown in Fig. 6, the purely classical description
approaches the generalized HSR dynamics in the region . It is worth noting that
the purely diffusive description underestimates the transfer efficiency by about 17 % (and correspondingly overestimates
the average transfer time of a larger factor of about 8)
in the biologically relevant temperature region (see arrows
in Fig. 6), suggesting that
some degree of coherence is indeed important to achieve optimal transport.
From the previous analyses it is clear that a certain amount of noise is required
to break disorder-induced localization of the exciton caused by the heterogeneity
of local site energies.
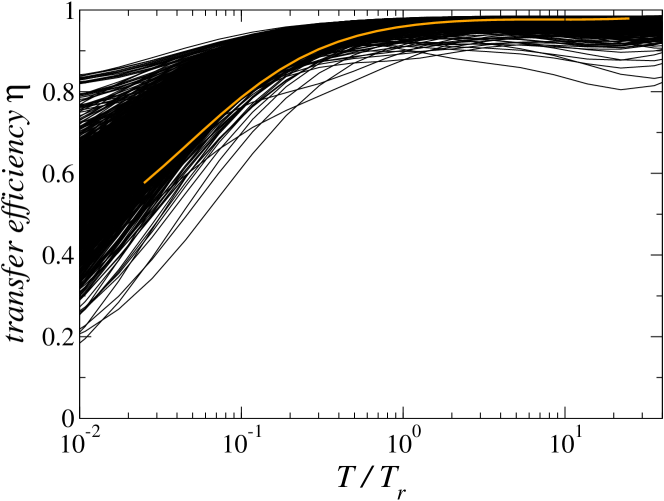
An interesting question to ask is what is the role of the specific realization of such noise,
in terms of the correspondence between the elements of the tensor and
specific pairs of pigments in the structure. One simple way to address this question is to
investigate the effect on transport of randomly reshuffling the the tensor elements.
For this purpose, one can restrict to site-energy and coupling-coupling
auto-correlations (it is clear from Fig. 6 that this will not induce appreciable
differences on the results).
In terms of the associated tight-binding network (see Fig. 2), this amounts to
randomly rewiring the nodes. Fig. 7 shows efficiency curves computed for a large
number of independent random rewiring realizations. Each of this corresponds to a different random
reshuffling of the pairs , with , i.e.
pigment couplings and associated pigment-pigment noise. It is clear that in the physically relevant
region close to , deviations from the efficiency corresponding to the
true set of physical parameters are negligible. Analogous results were obtained when considering
random reshufflings of site energies and associated noise terms, i.e. the pairs ,
or combinations of both strategies. Moreover, deviations of the same order of magnitude were obtained
for the corresponding average transfer times (results not shown).
Overall, this analysis seems to suggest that high transport efficiency in a tight-binding model
with site disorder can be achieved robustly through noise, rather insensitively of the specific
connectivity pattern of the tight-binding network. At the same time, one should be warned that efficiency
is a rather global indicator. Therefore, some caution is required in interpreting this result as a thorough dismissal
of tight and specific connections between the physical and geometrical structures underlying noise correlations and
the propagation of quantum excitations coupled to the vibrating, noise-producing scaffold.
Moreover, disregarding explicitly certain slow frequency components in the spectral densities, in accordance with
the white noise prescription, could prove a crucial limitation in the quest for quantitative
links between protein vibrations and exciton transport. All in all, although descriptions of the
HSR type prove that a certain degree of quantum coherence increases quantum efficiency over purely
incoherent, hopping transport, one should probably couple these with quantum-classical hybrid methods,
where structure-encoded spatiotemporal correlations provide an explicit description of noise.
In the next section, based on the spectral features emerging from QM/MM correlations in the PE5454 complex,
we develop a general method to dig for possible exciton-coupled vibrational patterns of the protein
matrix.
4 HSR coefficients: an elastic-network analysis reveals specific low-frequency normal modes
In this section, we consider the question whether the slow-frequency components emerging in certain
QM/MM-based spectral densities (see again Fig. 5) flag specific collective
vibrations, whose pattern is encoded in the protein scaffold and that would selectively couple to
exciton transport at the limits of validity of the HSR approach.
The elastic-network model (ENM) denotes a class of powerful and rather inexpensive
tools that are well suited to the investigation of collective fluctuations of
proteins [40, 41, 42, 43, 44].
In the residue coarse-grained (CG) version, also known as the anisotropic network model (ANM) [40],
the protein is described as a network of as many fictive beads as there are amino acids. In the
simplest case, each bead possesses the same mass equal to the average amino acid mass (about 110 a.m.u.) and
occupies at rest the position of the corresponding
Carbon along the backbone chain of the protein as determined from an experimentally solved
structure, i.e. X-ray or NMR.
The beads interact through identical Hooke springs
with other beads in the structure located within a specified cutoff distance . According to
this prescription, the total potential energy of such elastic network model
reads 111See Ref. [45] for a thorough discussion of alternative schemes.
| (12) |
where is the number of residues, and the equilibrium and instantaneous
distances between residues and , respectively, and is the common spring stiffness.
The matrix specifies the connectivity of the network, namely
.
Consensus choices for the two parameters of such a model are kcal/Å2 and
Å [46]. The normal modes can be easily computed as the eigenvectors
of the Hessian matrix of the potential energy function (12) [47].
With this choice of the parameters, the coarse-grained
NM spectrum of PE545 (PDB id. 1XG0)
spans the frequency interval cm-1
All chromophores in the PE5454 complex are covalently linked through disulfide bridges to
specific cysteine residues (CYS) [23]. The central pigments PEB50/61C and PEB50/61D form two disulfide
bridges each, while all the other bilins are covalently linked to one cysteine residue each. Overall,
these residues form an extended subnetwork of anchor points, whose concerted motions are likely to
influence the coupling and site energy fluctuations of the attached pigments. It is instructive to
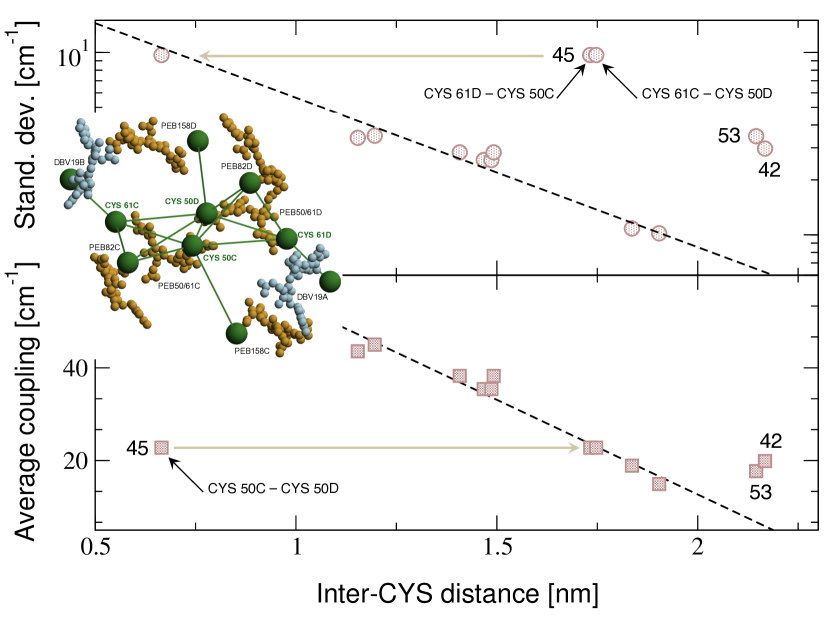
investigate how the average and the standard deviation of the QM/MM coupling time series depend upon
the distance between the respective covalently linked CYS pairs. The data reported in Fig. 8
suggest that on average both indicators referring to a given pair of pigments decrease with the distance between
the associated CYS anchor points (dashed lines). Interestingly, pairs associated with slow frequency components
in the corresponding spectral densities (see Fig. 5) stand out from the common average
trend as outliers. More precisely, fluctuations (gauged here by the standard deviations) of the 53 and 42 pairs
are seen to be anomalously large as compared to the average trend at the same CYS-CYS distances. This is all the more
remarkable as it concerns pairs located at large distances.
Another interesting observation is that the average coupling of the central PEB pair (45) appears
to be on the common trend only when associated with pairs of opposite cysteines
(61C-50D and 61D-50C, see again the cartoon and the arrow in the bottom panel of Fig. 8).
However, this is no longer true for the corresponding fluctuation, which appears to be of the correct
order of magnitude only when associated with the two central cysteines (50C-50D, top horizontal arrow).
Overall, this suggests that the fluctuations in the 54 coupling are controlled by the relative motions
of the CYS50C-CYS50D pair. In turn, this points to the interaction between the associated terminal pyrrole rings
(nearly parallel and about 5 Å away from each other) as the main structural unit controlling the
fluctuations of the 45 coupling strength.
The above observations strongly suggests that there exist a subset of normal modes in the cm-1
range whose displacement field (pattern) represents specific concerted motions of the cystein subnetwork.
Such modes, showing up in the spectral density referring to specific coupling-coupling and coupling-site energy
(cross) correlations, are good candidates in the quest for fold-encoded, transport-enhancing vibrations.
In order to identify these modes, we have proceeded as follows. First, we have ranked normal modes in
descending order with respect to their involvement fraction on the CYS subnetwork. Let us denote the
latter as and let denote the displacement of particle (residue)
in the mode . NMs patterns are normalized, i.e. ,
so that the quantity
| (13) |
gauges the relative weight of the covalently linked cysteines in the overall displacement field
of the -th NM. If only those residues were vibrating in a given mode , one would have .
It would be tempting to rank all normal modes in descending order with respect to the
associated values and select the top-scoring ones. However, a moment’s thought is enough to
realize that one also needs to gauge the statistical significance of a given score.
This should be done by considering for each mode the null hypothesis that a totally random subset
of as many residues would give the same score. Thus, for each NM we have computed a
-value by performing a large number of random reshufflings of the NM pattern and
computing the corresponding value of the involvement score .
The statistical significance of the measured involvement for a given NM can then be estimated by
the fraction of random scores exceeding the measured one. Namely,
| (14) |
where is Heaviside function. The quantity gauges the rejection probability of the null hypothesis. If we restrict to confidence levels greater than 95 %, this analysis singles out 78 NMs with frequencies lying between cm-1 and cm-1, i.e. 6.9 % of the NMs in the same frequency range and 5.3 % of the total number of NMs. We term this ensemble . Interestingly, this is precisely the same frequency range where low-frequency structures appear in specific spectral-densities (see again Fig. 5). It is possible to refine further the choice of possible interesting NMs by isolating vibrations whose vibrational patterns are mostly directed along the directions joining pairs of cysteines in the covalent subnetwork. We isolated the closest 15 pairs, which correspond to two links in the connectivity graph ( Å, inter-distances shorter than 21.67 Å, see cartoon in Fig. 8). For each NM we computed the projection
| (15) |
| NM | [cm-1] | 50C-50D | 61D-50C | 50D-61C | 158D-50D | 158C-50C | c.l. | |
|---|---|---|---|---|---|---|---|---|
| 144 | 77.49 | 0.639 | -0.915 | -0.750 | 0.888 | 0.251 | 0.386 | 0.974 |
| 245 | 72.45 | 0.691 | 0.866 | 1.000 | -0.659 | 0.215 | -0.974 | 0.995 |
| 432 | 65.74 | 0.636 | -0.706 | 0.475 | -0.770 | -0.380 | -0.585 | 0.972 |
| 501 | 63.37 | 0.639 | 0.900 | -0.901 | -0.478 | 0.904 | 0.750 | 0.971 |
| 531 | 62.39 | 0.635 | 0.731 | 0.994 | -0.853 | -0.605 | 0.146 | 0.963 |
| 546 | 61.87 | 0.764 | -0.991 | 0.317 | 0.634 | -0.980 | 0.850 | 1.000 |
| 556 | 61.50 | 0.650 | 0.402 | -0.814 | 0.965 | -0.505 | 0.652 | 0.976 |
| 940 | 48.57 | 0.623 | 0.941 | 0.104 | 0.904 | 0.927 | -0.669 | 0.953 |
where denotes the unit vector joining cysteine to cysteine in the equilibrium structure. Again, one needs to evaluate the rejection probability of the null hypothesis stipulating that a value of equal or higher than a measured one can be obtained by selecting 15 random pairs of residues in the entire structure. We then considered the NMs in the previously identified subset and computed the indicators and their associated -values, defined as
| (16) |
where refers to the average of the projections (15) computed over
the 15 closest cysteine pairs () and over as many randomly selected pairs
() for a given normal mode in the subset .
Remarkably, 10 % of these modes (8 NMs out of 78) showed a confidence level
greater than 95 %. A summary of this analysis is reported in Table 1.
Such modes have frequencies in a somewhat narrower range than the previous 78 ones, lying
in the range [48.57,77.49] cm-1 (see vertical lines in Fig. 5). The average
projection on the first 15 CYS-CYS inter-distances over the whole subset is 0.66, suggesting
that these NMs are indeed concerted motions of the CYS-CYS subnetwork, whose vibrational patterns
can be imagined to a great extent as acting along the links of the associated connectivity
subgraph (see green sticks in the cartoon in Fig. 8). Remarkably, the average
projection on the 50C-50D direction (corresponding to the largest QM/MM coupling fluctuation)
is 0.81, larger than the average projection computed for all the 15 pairs. This strongly
confirms our previous inference about the crucial role of these two cysteines in mediating the
protein-encoded fluctuations that couple to exciton transport.
5 Conclusions and perspectives
In this paper we have provided a realistic parametrization of the Haken-Strobl model (6) for the PE545
bilin complex from QM/MM simulations. The aim of our analysis was to dig for the different
auto- and cross-correlations relating to pigment site energies and pigment-pigment couplings and
investigate their role on exciton mobility.
We have used this approach to characterize exciton transport by means of simple global observables, namely
the transport efficiency and the average transfer time.
As a result, we have obtained that at room temperature the system is very close to the optimal transport regime
with a predominant contribution from site-energy fluctuations. Moreover, in the optimal regime the transport efficiency
is rather insensitive to random reshuffling of the elements of the Hamiltonian and the associated noise tensor.
This suggests that noise-induced depinning of quantum excitations in disordered environments is a rather general
feature of open quantum systems.
The high temperature regime revealed that the small residual coupling fluctuations in the dynamics
suppress the quantum Zeno regime at temperatures , where the dynamics is essentially that
of a classical random walk.
Although this regime is not meaningful from a biological standpoint, since proteins unfold at temperatures
, our study provides a different reading frame for noise-assisted
quantum transport [4] in photosynthetic complexes.
Namely, the effect of environment fluctuations at room temperature is to provide access
to the same efficiency level that would pertain to an inaccessible
regime of classical diffusion at extremely high temperatures. To put it in more evocative terms,
one might argue that evolution has taken advantage of the laws of quantum mechanics to lower
the effective temperature corresponding to the highest efficiency (the classical regime) to the region
of working temperatures of proteins in a living organism.
We have shown that QM/MM data spotlight clear slow frequency components in the [30-80] cm-1
range in the spectral densities associated with specific coupling-coupling and coupling-sit energy
fluctuations. Typically these involve the central PEB50/61D/C pigments.
These lie at the threshold of validity of the white noise approximation inherent
in HSR-type approaches, where one has to surmise that the noise spectral structure does not
contain slow components, relaxing in time as fast as or more slowly than the timescale associated
with exciton transfer.
While there seems to be no obvious way to include slow, collective modes in HSR-kind descriptions of
exciton transport, in the last section of the paper we lay out a possible strategy to tackle this problem through
the elastic-network model formalism. Our analysis clearly identify a set of specific collective normal modes
that preferentially couple the subnetwork of 10 cysteine residues covalently linked to bilins.
Such modes, selected through an original double statistical-significance analysis, have the combined properties of
(i) maximum concerted involvement on the CYS subnetwork and (ii) maximum displacement alignment with the
ensemble of the closest inter-distance vectors between cysteine pairs. These modes, with frequency
lying in the [50-80] cm-1 range, might be important fold-encoded noise sources for
enhancing exciton transport optimally within the pigment-hosting protein matrix.
The logical step beyond microscopically parameterized HSR approaches to investigate
the above hypothesis is to turn to coarse-grained quantum-classical hybrid descriptions,
often also called mixed quantum classical approaches (QCA) [48].
In QCAs the force acting on classical degrees of freedom is computed by considering an effective
potential energy given by the quantum mechanical expectation value of
the system-reservoir coupling according to the instantaneous values of the classical
coordinates and the wave function of the quantum degrees of freedom (DOFs).
While the presence of the classical DOFs results in an additional potential for the dynamics of the quantum
system, the classical reservoir feels the quantum mechanically averaged force of the
relevant quantum system. This method is often referred to as Ehrenfest method [48]
and falls within the class of mean-field approaches.
Interestingly, a recent QCA based on the nonlinear network model [46]
has shown that specific fold-rooted vibrational modes have the potential to spotlight
alternative excitation energy transfer routes in the
Fenna-Matthews-Olson (FMO) complex through their influence on pigment properties [49].
Overall, also in view of the results of the previous section, elastic/nonlinear-network model-based
QCAs can be regarded as optimal tools to investigate the role of
specific fold-encoded vibrational modes in exciton transport
in light-harvesting complexes.
Acknowledgments
S.P., S.I., Y.O. and F.P. thank financial support from the EU FP7 project PAPETS (GA 323901). S.P. and Y.O. thank the support from Fundação para a Ciência e a Tecnologia (Portugal), namely through programmes PTDC/POPH/POCH and projects UID/EEA/50008/2013, IT/QuSim, IT/QuNet, ProQuNet, partially funded by EU FEDER, as well as project CRUP/CPU CQVibes TC16/14. Furthermore S.P. acknowledges the support from the DP-PMI and FCT (Portugal) through scholarship PD/BD/52549/2014.
References
References
- [1] van Amerongen H, van Grondelle R and Valkunas L 2000 Photosynthetic Excitons (World Scientific)
- [2] Mohseni M, Omar Y, Engel G and Plenio M B (eds) 2014 Quantum Effects in Biology (Cambridge University Press)
- [3] Adolphs J and Renger T 2006 Biophysical journal 91 2778–2797
- [4] Rebentrost P, Mohseni M, Kassal I, Lloyd S and Aspuru-Guzik A 2009 New Journal of Physics 11 33003
- [5] Caruso F, Chin A W, Datta A, Huelga S F and Plenio M B 2009 The Journal of Chemical Physics 131 105106
- [6] Plenio M B and Huelga S F 2008 New Journal of Physics 10 113019
- [7] Rebentrost P, Mohseni M and Aspuru-Guzik A 2009 The Journal of Physical Chemistry B 113 9942–9947
- [8] Fassioli F, Nazir A and Olaya-Castro A 2010 The Journal of Physical Chemistry Letters 1 2139–2143
- [9] Nalbach P, Eckel J and Thorwart M 2010 New Journal of Physics 12 065043
- [10] Wu J, Liu F, Shen Y, Cao J and Silbey R J 2010 New Journal of Physics 12 105012
- [11] Renger T, Klinger A, Steinecker F, Schmidt Am Busch M, Numata J and M??h F 2012 Journal of Physical Chemistry B 116 14565–14580
- [12] Curutchet C, Novoderezhkin V I, Kongsted J, Muñoz-Losa Auroraoz-Losa A, Van Grondelle R, Scholes G D and Mennucci B 2013 Journal of Physical Chemistry B 117 4263–4273
- [13] Chen X and Silbey R J 2010 The Journal of chemical physics 132 204503
- [14] Vlaming S M and Silbey R J 2012 The Journal of chemical physics 136 55102
- [15] Schwarzer E and Haken H 1972 Physics Letters A 42 317–318
- [16] Haken H and Strobl G 1973 Zeitschrift f??r Physik 262 135–148 ISSN 14346001
- [17] Huo P and Coker D F 2012 The Journal of chemical physics 136 115102
- [18] Huo P and Coker D F 2011 The Journal of chemical physics 135 201101
- [19] Hwang-Fu Y H, Chen W and Cheng Y C 2015 Chemical Physics 447 46–53
- [20] Roden J J J, Bennett D I G and Whaley K B 2016 The Journal of Chemical Physics 144 245101
- [21] Liu X and Kühn O 2016 Chemical Physics 481 272–280
- [22] Curutchet C, Kongsted J, Muñoz-Losa A, Hossein-Nejad H, Scholes G D and Mennucci B 2011 Journal of the American Chemical Society 133 3078–3084
- [23] Doust A B, Marai C N J, Harrop S J, Wilk K E, Curmi P M G and Scholes G D 2004 Journal of Molecular Biology 344 135–153
- [24] Doust A B, Wilk K E, Curmi P M G and Scholes G D 2006 Journal of Photochemistry and Photobiology A: Chemistry 184 1–17
- [25] Novoderezhkin V I, Doust A B, Curutchet C, Scholes G D and Van Grondelle R 2010 Biophysical Journal 99 344–352
- [26] Viani L, Corbella M, Curutchet C, O’Reilly E J, Olaya-Castro A and Mennucci B 2014 Physical Chemistry Chemical Physics 16 16302–16311
- [27] Misra B and Sudarshan E C G 1977 Journal of Mathematical Physics 18 756–763
- [28] Iubini S, Boada O, Omar Y and Piazza F 2015 New Journal of Physics 17 113030
- [29] Scheer H and Zhao K H 2008 Molecular Microbiology 68 263–276
- [30] Curutchet C, Muñoz-Losa A, Monti S, Kongsted J, Scholes G D and Mennucci B 2009 Journal of chemical theory and computation 5 1838–1848
- [31] Zerner M C 1991 Reviews in computational chemistry 2 313–365
- [32] Carsten Olbrich, Johan Strümpfer, Klaus Schulten U K 2011 The journal of physical chemistry. B 115 758
- [33] Viani L, Curutchet C and Mennucci B 2013 The journal of physical chemistry letters 4 372–377
- [34] Troisi A 2011 Chemical Society reviews 40 2347–2358
- [35] Troisi A and Orlandi G 2006 Phys. Rev. Lett. 96 86601
- [36] Aragó J and Troisi A 2015 Phys. Rev. Lett. 114 26402
- [37] Plenio M B and Huelga S F 2008 New Journal of Physics 10 113019
- [38] Sandeep Kumar , , Chung Jung Tsai § and Ruth Nussinov* § 2003 Biochemistry 42 4864–4873
- [39] Moix J M, Khasin M and Cao J 2013 New Journal of Physics 15 085010
- [40] Atilgan A, Durell S, Jernigan R, Demirel M, Keskin O and Bahar I 2001 Biophys. J. 80 505–515
- [41] Hinsen K, Petrescu A J, Dellerue S, Bellissent-Funel M C and Kneller G R 2000 Chemical Physics 261 25–37
- [42] Micheletti C, Lattanzi G and Maritan A 2002 J. Mol. Biol. 321 909–921
- [43] Tama F, Wriggers W and Brooks III C L 2002 J. Mol. Biol. 321 297–305
- [44] Tirion M M 1996 Phys. Rev. Lett. 77 1905–1908
- [45] Bahar I, Lezon T R, Yang L W and Eyal E 2010 Annual Review of Biophysics 39 23–42
- [46] Juanico B, Sanejouand Y H, Piazza F and De Los Rios P 2007 Phys. Rev. Lett. 99 238104
- [47] Sanejouand Y H 2013 Elastic Network Models: Theoretical and Empirical Foundations Biomolecular Simulations ed Monticelli L and Salonen E (Springer-Verlag) pp 601–616
- [48] May V and Kühn O 2011 Charge and Energy Transfer Dynamics in Molecular Systems (Weinheim, Germany: WILEY-VCH Verlag GmbH & Co. KGaA)
- [49] Morgan S E, Cole D J, Chin A W, Austin R H and Jansen T L C 2016 Scientific Reports 6 36703