11email: h.j.g.l.m.lamers@uu.nl 22institutetext: Astronomisches Rechen-Institut, Zentrum für Astronomie der Universität Heidelberg, Monchhofstraße 12-14, D-69120 Heidelberg, Germany
22email: kruijssen@uni-heidelberg.de 33institutetext: Astrophysics Research Institute, Liverpool John Moores University, Egerton Wharf, Birkenhead, CH41 1LD, UK.
33email: n.j.bastian@ljmu.ac.uk 44institutetext: ESO, Karl-Schwarzschild-Strasse 2, D-85748 Garching, Germany
44email: [mrejkuba,mhilker]@eso.org 55institutetext: Excellence Cluster Universe, Boltzmannstr. 2, D-85748, Garching, Germany 66institutetext: Gemini Observatory, 670 N. A’ohoku Place, Hilo, Hawaii 96720, USA, 66email: mkissler@gemini.edu
The difference in metallicity distribution functions of halo stars and globular clusters as a function of galaxy type
Abstract
Context. Observations of globular clusters (GCs) and field stars in the halos of the giant elliptical galaxy Cen A and the spiral galaxy M31 show a large range of cluster-to-star number ratios (or ‘specific frequencies’). The cluster-to-star ratio decreases with increasing metallicity by over a factor of 100–1000, at all galactocentric radii and with a slope that does not seem to depend on radius. In dwarf galaxies, the GCs are also more metal-poor than the field stars on average. These observations indicate a strong dependence of either the cluster formation efficiency and/or the cluster destruction rate on metallicity and environment.
Aims. We aim to explain the observed trends by considering the various effects that influence the cluster-to-star ratio as a function of metallicity, environment and cosmological history.
Methods. We discuss the following effects that may influence the observed cluster-to-star ratio: (a) the formation efficiency of GCs; (b) the destruction of embedded GCs by gas expulsion; (c) the maximum masses of GCs; (d) the destruction of GCs by tidal stripping, dynamical friction, and tidal shocks as a function of environment; (e) the hierarchical assembly of GC systems during galaxy formation and the dependence on metallicity.
Results. We show that both the cluster formation efficiency and the maximum cluster mass increase with metallicity, so they cannot explain the observed trend. Destruction of GCs by tidal stripping and dynamical friction destroy clusters mostly within the inner few kpc, whereas the cluster-to-star ratio trend is observed over a much larger range of galactocentric radii. We show that cluster destruction by tidal shocks from giant molecular clouds in the high-density formation environments of GCs becomes increasingly efficient towards high galaxy masses and, hence, towards high metallicities. The predicted cluster-to-star ratio decreases by a factor 100-1000 towards high metallicities and should only weakly depend on galactocentric radius due to orbital mixing during hierarchical galaxy merging, consistent with the observations.
Conclusions. The observed, strong dependence of the cluster-to-star ratio on metallicity and the independence of its slope on galactocentric radius can be explained by cluster destruction and hierarchical galaxy growth. During galaxy assembly, GC metallicities remain a good tracer of the host galaxy masses in which the GCs formed and experienced most of their destruction. As a result, we find that the metallicity-dependence of the cluster-to-star ratio does not reflect a GC formation efficiency, but a survival fraction.
Key Words.:
globular clusters: general; galaxies: star clusters: general; galaxies: abundances; galaxies: stellar content; galaxies: halos; galaxies: star formation1 Introduction
Studies of the halo of the Milky Way and other massive galaxies show that the metallicity distribution functions (MDFs) of halo stars is very different from that of globular clusters in the same galaxy. Observations indicate that the cluster-to-star ratio is a strong function of metallicity in spiral (e.g. carollo10; gratton12; durrell01; durrell04; chapman06; kalirai06) and elliptical galaxies (e.g. harrisharris02; harris03; beasley08). Similar differences have also been observed for dwarf galaxies (e.g. beasley08; mackey04; sharina10) 111The cluster-to-star ratio is the mass of stars in clusters compared to the mass of field stars in the same area of a galaxy.. The most extreme example was found in the Fornax dSph where the stars have a broad metallicity distribution with with a peak at while the globular clusters are all metal-poor with (larsen12b). So the cluster-to-star ratio is very low at high metallicity and very high at low metallicity.
These trends are not expected if star formation and cluster formation trace each other as in nearby star-forming regions where a certain small fraction of the stars (typically 5–10%, goddard10; kruijssen12d; adamo15b) are in bound clusters. If ancient clusters and stars would also trace each other, one would expect that the metallicity distributions of the old globular clusters and old stellar populations match each other (assuming no metal contamination within clusters), which is obviously not the case. One interpretation of these results is that star and cluster formation were different in the early universe, when metal-poor GCs were formed, with separate events forming the bulk of the cluster and stellar populations. Alternatively, it is possible that evolutionary effects are responsible for the observed differences, with preferential cluster disruption or hierarchical galaxy merging influencing the ratio of clusters to field stars as a function of metallicity or location.
There has been much work done in the past few years attempting to include globular clusters in galaxy formation simulations in an attempt to place globular clusters in a more cosmological context and obtain an understanding of their MDFs. One commonly adopted method is through ‘particle tagging’, where certain particles in the simulations are treated as globular clusters. Such simulations have provided insight into various globular cluster population properties (e.g. moore06; moran14), although they generally make the assumption that field stars and globular clusters will share the same MDFs, whereas observations show variations over orders of magnitude (e.g. kruijssen14c). Such assumptions lead to unphysical solutions as to when globular clusters formed (i.e. for metal poor clusters, see brodie06, which is inconsistent with their ages, see e.g. forbes10), because they can only produce sufficiently extended globular cluster galactocentric radial distributions at extremely high redshift. Additionally, such simulations, often done in post-processing, do not follow the tidal history of the globular clusters meaning that the cluster dissolution cannot be taken into account in the necessary detail. tonini13 got around this problem by matching the cluster-to-star ratio (or specific frequency) of each galaxy (in post-processing) to observations of present-day galaxies, with the aim of reproducing the MDFs of globular clusters. However, the origin of the adopted specific frequency cannot be tested in this way. When aiming to understand the origin of the different MDFs of globular clusters and field stars, which is equivalent to studying the cluster-to-star ratio as a function of metallicity, one must instead employ fully self-consistent models for the formation and evolution of globular cluster in galaxy formation simulations, taking into account the impact of the environment on the cluster formation efficiency and cluster mass loss.
In this paper, we aim to formulate the problem of the different MDFs of globular clusters and field stars and identify the most promising responsible physical mechanisms, particularly with an eye on the upcoming generation of self-consistent models of globular cluster formation during galaxy formation (e.g. Pfeffer et al. in prep., Kruijssen et al. in prep.). We do this by describing the observational constraints and studying the different effects that influence both the formation and the disruption of star clusters, and may have played a role in producing different MDFs of globular clusters and halo stars within galaxies.
-
1.
The first is that the fraction of stars formed in bound clusters () may depend on metallicity and environment.
-
2.
The second, intimately related to the first, is that some internal or external process may preferentially destroy young clusters in a metallicity dependent way.
-
3.
The third is that the maximum cluster mass may depend on metallicity such that massive globular clusters are less likely to form in metal-rich galaxies.
-
4.
The fourth is environmentally dependent cluster disruption, where clusters may be destroyed more rapidly in strong and/or time-varying tidal fields, and most strongly towards high metallicities (e.g., near the centres of galaxies or in gas-rich environments).
-
5.
The fifth is dynamical friction, which may force massive clusters to spiral-in to the centres of galaxies.
-
6.
The sixth is any combination of the first five, considered in the framework of hierarchical galaxy formation.
The goal of the present work is to investigate why the cluster and star populations have different MDFs within galaxies. The paper is organized as follows. In § 2 we describe the relevant observations of the distributions (spatial and metallicity) of old stars and globular clusters in halos of spiral, elliptical and dwarf galaxies. In § 3 we briefly summarize these observations and mention the unexplained problems. In § LABEL:sec:form we discuss the formation of clusters of different metallicities in different environments. In § LABEL:sec:destruc the different mechanisms that may destroy the clusters are discussed. In § LABEL:sec:cosmology the capture of clusters from stripped dwarf galaxies are studied. The conclusions and discussion are presented in §LABEL:sec:conclusions.
2 Observed metallicity distribution functions (MDF) of clusters and stars
The study of the MDF of stars in individual galaxy halos is possible through resolved stellar photometry, but is limited to galaxies in the Local Group and nearby groups, up to about 10 Mpc. We will use the detailed properties of stars and GCs in Cen A, M31 and the Fornax dSphs as representative examples for ellipticals, spirals and dwarf galaxies.
2.1 Large spiral and elliptical galaxies
2.1.1 The MDF of halo stars
The stars in the halos of large spiral and elliptical galaxies show similarities in their metallicity distributions: a high metallicity component with a peak at and a lower metallicity component or a tail in more massive elliptical galaxies, with a broader peak at , e.g.: MW : (ryan91; an12); M31: (durrell01; durrell04; chapman06; kalirai06; gilbert14; ibata14; gregersen15); M81: (durrell10); NGC 891: (mouhcine07; rejkuba09); NGC 2403: (barker12); Sombrero: (mould10); other nearby spirals (e.g. mouhcine05; mouhcine06); NGC 5128: (harris99; harris00; harrisharris02; rejkuba05; crnojevic13; rejkuba14); NGC 3377: (harris07b) NGC 3379: (harris07a; leejang16) NGC 3115: (peacock15).
The metal-rich component is concentrated more towards the inner regions and the metal-poor component becomes significant only in the outer regions. The metallicity of both the metal-rich and metal-poor components increase with increasing galaxy luminosity (mouhcine06) and the stellar halo metallicity scales with stellar halo mass (harmsen17) with a slope that is broadly similar to the stellar mass versus stellar metallicity relation for local galaxies (gallazzi05; kirby13). forbes97 and mouhcine06 suggested that the metal-poor component is due to the tidal disruption of dwarf-like objects whereas the metal-rich population is related to the formation of the bulge and/or disk. In elliptical galaxies, where the low-metallicity tail is weaker222This may be an observational selection effect due to the large effective radii, or more extended metal-poor halo components of these galaxies., the metal-poor component may be the relic of the very earliest formation stage, whereas the metal-rich component originated in the former disks of the merged galaxies (e.g. harris07a, bekki02.
2.1.2 The MDF of globular clusters
The MDF of globular clusters in spiral galaxies and giant ellipticals is clearly bimodal with the metal-rich clusters concentrated towards the galactic center and the metal-poor clusters (which are invariably very old, Gyr) distributed over larger distances (gebhardt99; peng06; brodie12). For instance the MDF of GCs in the MW has peaks at = and (harris16) and the giant elliptical Cen A has peaks at =-1.4 and -0.4 (beasley08).
The peak in the MDF of the metal-poor (blue) GCs was found to be almost constant at -1.5 (burgarella01) and showing no correlation with the parent galaxy luminosity (forbes97) in several studies. However, more homogeneous samples revealed a shallow but significant correlation between the peak MDF of the blue clusters and the host galaxy luminosity (larsen01; strader04; peng06, e.g.). By contrast, the peak of the metal-rich (red) GCs depends strongly on the mass or luminosity of the galaxies: the more massive a galaxy, the more metal-rich its red peak in the MDF (e.g. peng06 for the Virgo galaxies, and liu11 for the Fornax cluster galaxies). The radial distribution of the metal-rich GCs in the MW shows a steep decline beyond kpc, whereas the population of metal-poor GCs extends all the way from about 1 to 100 kpc (e.g. see the review by harris01a). In Cen A the majority of the clusters with -1 are within 20 kpc projected distance from the center, whereas the metal-poor clusters show a flatter distribution with projected distance. Also in large cD galaxies the galactic radial distribution of metal-rich clusters is much steeper than that of metal-poor clusters, see e.g. Fig. 20 of harris16 and harris17a.
Several studies have shown that the radial distribution of the metal-rich GCs follow approximately the radial distribution of the star-light and that the kinematics of the these red clusters also follow that of the stars, whereas the blue GCs have a larger velocity dispersion, e.g. schuberth10; strader11; pota13 and the review by brodie06.
2.1.3 Giant Elliptical Galaxy NGC 5128 = Cen A
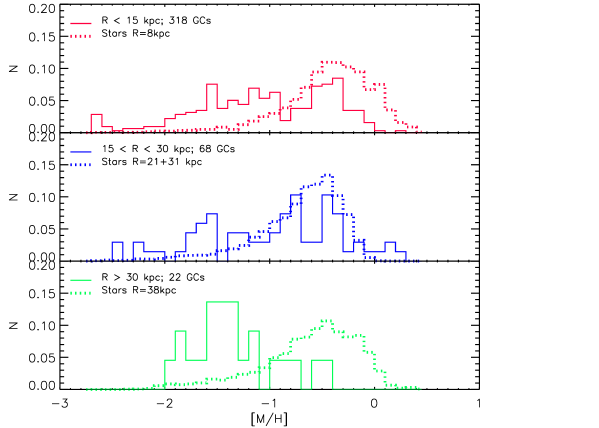
In Fig. 1 the normalized MDF of GCs and halo stars in the giant elliptical galaxy Cen A (NGC 5218) at a distance of 3.8 Mpc (harris10) are compared in three distance regions of the halo.
The stellar MDF is based on resolved stellar population studies in fields at projected distances of (i) 8 kpc (harrisharris02), (ii) in two field at 21 and 31 kpc (harris99; harris00), and (iii) in the outer halo field at 38 kpc galactocentric distance (rejkuba05). The MDF of the 408 GCs was derived by combining the samples of (i) 207 GCs with spectroscopic metallicities from beasley08 and (ii) 201 spectroscopically confirmed GCs with velocities consistent with being members of the globular cluster system (GCS) of NGC 5128, whose metallicities were calculated from Washington (C–T1) photometric index (woodley07)333See woodley10 for the calibration from (C–T1) colour to [Fe/H] metallicity.. These GCs span a range of projected distances from 0 to 45 kpc, but the large majority is located within the inner 15 kpc – this is primarily due to incomplete spectroscopic studies of the outer regions of the GCS in this galaxy.
The stellar MDF is measured by interpolating (V-I) colours of the upper Red Giant Branch (RGB) stars on a set of empirically calibrated stellar evolutionary tracks (harris99) assuming an alpha enhancement of [/Fe]=+0.3. The relative precision in MDFs of different fields is ensured by using the same filters for observations of different fields, as well as the same colour-metallicity calibration and interpolation code. While it is well known that the RGB colour varies non-linearly with metallicity and the photometric metallicities have higher errors at the metal-poor end (saviane00; harris00), comparison of photometric MDFs with those constructed from spectroscopic measurements of individual stars shows a good agreement on the average values, as well as the overall shape of MDFs (e.g. gonzalez11, for a wide MDF in the Milky Way bulge).444Note that gonzalez11 used near-IR photometric bands (J and K), and streich14 caution that metallicity determinations from RGB alone have an accuracy of 0.3 dex for simple stellar populations for [M/H] and 0.15 dex for [M/H]. kalirai06 also found a very good agreement between photometric and spectroscopic metallicities for M31 giants for the whole metallicity range except the most metal-poor bin (), where photometric measurements extend to lower values, making the photometric stellar MDF broader. The metallicity accuracy for GC measurements is of the order of 0.15 dex (beasley08), depending more strongly on the quality of spectra, then on the metallicity of individual clusters.
The top panel in the upper figure compares the MDF of the field stars at 8 kpc field with that of GCs located between kpc. The middle panel compares the MDF of GCs at kpc with the stellar MDF in the combined fields at 21 and 31 kpc, which have very similar MDFs (rejkuba05). The lower panel compares the MDFs of stars in the 38 kpc field with GCs at kpc. We see that the stellar MDF in the inner region of Cen A is wider and extends to slightly higher than in the outer halo. harrisharris02 have argued that this is due to contributions by bulge stars. On the other hand, the MDFs of the GCs are flatter with the contribution of the metal-poor clusters with increasing towards larger distances.
At all distances the clusters are underrepresented compared to stars at high metallicity and overrepresented at low metallicity, (see also beasley08 for a similar observation).
(The terms “underrepresented” and “overrepresented” in this respect are always relative to the “mean” cluster-to-star ratio, which is generally of the order of a percent in mass).
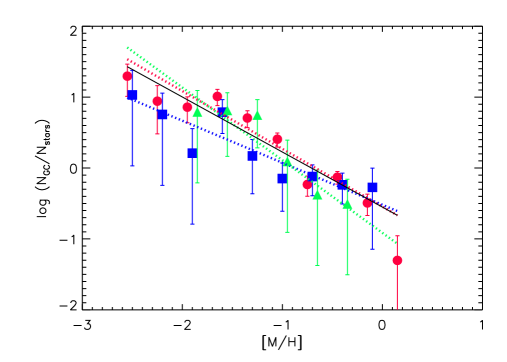
The lower part of Fig. 1 shows the logarithmic ratio between the normalized MDFs of clusters and stars as a function of metallicity. In all three distance ranges this ratio decreases with increasing by about 2 dex in the range of . 555NB: This does not mean that the cluster to star ratio is the same in the 3 regions because we used the normalized MDFs. The absolute values are not known, because the star-counts and the cluster-counts do not cover the same region of CenA. Although the absolute values of the specific frequency in the three distance regions is not known, the trend in the lower part of figure 1 shows that the decrease of with appears to be independent of distance. The weighted least square fits at the inner radial distance range has a slope of . The slopes in the other two distance ranges are -0.59 and -1.0 but are less well determined due to the large error-bars. The linear regression of the full sample has a slope of . We conclude that the dependence of the ratio on metallicity is independent of the galactocentric distance and has a slope of . Further confidence in our conclusion is gained by comparing the stellar vs GC MDFs in NGC 3115, which also show a similar dependence on metallicity that is independence of the distance, as shown in Fig. 11 and 12 of peacock15.
2.1.4 Spiral Galaxy M31
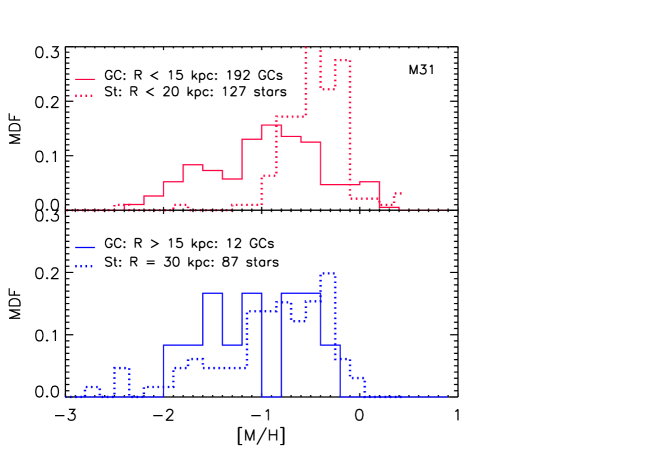
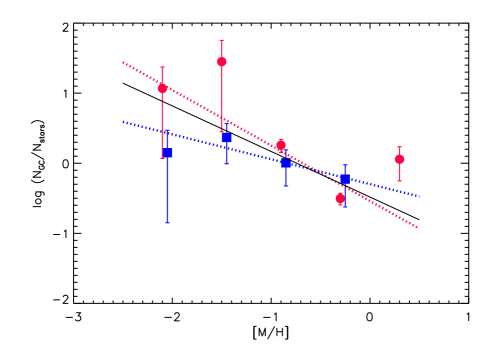
Fig. 2 shows the normalized MDF of clusters and halo stars in M31. The data for the clusters are taken from the Revised Bologna Catalog, the main repository of information for M31 GCs (galleti04), which contains metallicity measurements for 225 GCs based on Lick indices by galleti09. The MDF of the halo stars is from kalirai06. These authors derived the metallicities of 250 halo RGB stars in 12 fields, ranging in projected distance from 12 to 165 kpc from the center. Assuming that the halo stars and the GCs are both distributed spherically around M31, rather than ellipsoidally, we can directly compare the MDF of both samples as a function of projected galactocentric distance, by correcting for the tilt of the M31 disk.666Until more observations become available, this is presently the best one can do. ibata14 showed that the M31 most metal-poor populations () are distributed approximately spherically with only a relatively small fraction residing in discernible stream-like structures. More metal-rich populations contain larger fractions of stars in streams with the stream fraction reaching 86% at . So, actually the shape of the halo stellar distribution changes with metallicity. It should be noted that also GCs are not homogeneously distributed and appear to be more abundant in the streams.
The MDF of the halo stars is shown in two distance bins at and kpc. The GC sample was split at kpc to have sufficient clusters in the outer region to make a meaningful MDF. The inner region contains about 200 clusters, the outer region contains only 12 GCs
The figure shows that the MDF of the halo stars of M31 becomes wider and shifts to lower metallicity with increasing distance (see kalirai06 for the gradual trend). In contrast, the MDF of the clusters is approximately the same in both regions, within the statistical uncertainty. In both the inner and the outer region the mean metallicity of the GC is lower than that of the stars. The effect is strongest in the inner region which may, at least partly, be due the contribution by the bulge stars in the inner region (kalirai06).
The lower part of figure 2 shows the logarithmic ratio between the normalized MDF of clusters and stars as a function of in bins of . The linear weighted least square fit for the inner region has a slope of . The trend in the outer region is much less well defined, due to the fact that most bins contain only 1 to 4 clusters, so the uncertainty is large. Combining all data we find a slope of . This is compatible with the slope of found for Cen A. (Fig. 1).777A similar comparison for the Milky Way is seriously hampered by the fact that the stellar MDF can only be measured at the solar radius, kpc, as a function of height above or below the Galactic Plane where the sample may be contaminated by thick disk stars up to kpc (juric08).
2.2 Dwarf galaxies
2.2.1 The MDF of stars in dwarf galaxies
The stellar MDFs of the dwarf elliptical M32 (grillmair96) and irregular galaxy LMC (cole00; haschke12) are very similar to those of the stellar halos of the giant elliptical Cen A and the spiral galaxy M31 (harrisharris01). They all show a peak around with a low metallicity tail extending to . Fainter dwarf galaxies (), in particular dwarf elliptical (dEs) and dwarf spheroidals (dSphs), show similar shapes of their stellar MDFs, but with much lower peak metallicities of and extensions of their low metallicity tail to (Local Group: starkenburg10; Cen A group: crnojevic10; M81 group: lianou10). The mean metallicity of the stellar populations of dwarf galaxies shows a clear trend with galaxy mass and metallicity: the more massive or luminous a galaxy, the higher its mean stellar metallicity, indicating that more massive dwarfs had higher star formation rates or were better able to retain the enriched gas that was released by stellar winds and supernovae (grebel03). The same trend was also found for spirals and ellipticals.
Within dwarf galaxies, the metallicity may vary as a function of distance from the center. For dwarf galaxies in the Local Group (LG), where metallicities can be measured spectroscopically, the age-metallicity degeneracy problem in the interpretation of color-color distributions can be avoided. leaman13 derived the metallicity gradient in the LG dwarf irregular WLM and compared it with those in the LG dSphs and the Magellanic Clouds. The metallicity gradient is small or absent in dIrrs, , but clearly present in dSphs, , where is the core radius, which is typically to 0.6 kpc.
2.2.2 The MDF of globular clusters in dwarf galaxies
Dwarf galaxies have generally very small numbers of GCs so the best way to derive information about their statistical properties is the combination of results of many galaxies of similar types. This has been done for samples of 69 dwarf ellipticals in the Virgo and Fornax clusters (miller07) and 57 and 68 nearby mainly dwarf irregulars by sharina05 and georgiev09.
Globular clusters in dwarf galaxies are in general very metal-poor, mostly even more metal-poor than the peak metallicity of the dwarf’s stellar MDF (e.g. mackey04; sharina10). The Fornax dSph, for example, contains four GCs with to -1.9 and one more metal-rich GC at dex, whereas its stellar MDF peaks at with a long tail towards lower metallicities (strader03; helmi06; larsen12b). A similar situation is found in the dwarf galaxy WLM, where the GCs with a metallicity of are significantly more metal-poor than the average of -1.3 of the field stars in this galaxy (leaman13; larsen12). The dwarf galaxy IKN has five GCs but only the metallicity of IKN-5 is known with some confidence. The average metallicity of the field stars is between -1.5 an -1.0. (lianou10; georgiev10; larsen14).
Fig. 3 shows the MDF of stars and GCs in the Fornax dSph, based on the data by larsen12b. It shows the same trend as the MDFs in the outer halo of CenA but more extreme: the MDF of the stars peaks near with a low metallicity tail to -2, but the MDF of the GCs is narrower and at lower metallicity than in CenA. The GCs at are conspicuously absent.

2.3 The specific frequency of clusters in different galaxies
The ratio between the number of clusters and the stellar population can be expressed in terms of the specific frequency, which is the number of GCs relative to the B-magnitude of the Galaxy (harris81) or the specific luminosity (harris91) or the specific mass , where is the stellar mass (zepf93; peng08). The dependence of or on galaxy type has been reviewed by brodie06. The largest dataset of about 100 early type galaxies in the Virgo cluster, shows that the specific mass has a typical low value of about 0.3 for galaxies in the mass range of (peng08). This implies that in these galaxies the mass fraction of 0.003 is in clusters. Beyond this mass range, the mean values of increase to both lower and higher mass. Galaxies with reach . Galaxies with have a large scatter in between 0 and about 2, with nearly all dwarfs with large located within 1 kpc form the cD galaxy M87. This suggests that the cluster formation in dwarfs is biased towards dense environments.
An observable that is key to the present work is the relative specific frequency of metal-poor and metal-rich GCs as a function of galaxy mass. In peng08, is derived for both subpopulations. In the mass range of to the value of , which is the total number of clusters per decreases with galaxy mass from about 30 at to 0.5 at . Over this mass range the fraction of the blue (metal-poor) clusters is between 90 and 70 %. Since the metallicity of these galaxies increases with increasing mass, it indicates a decrease of with increasing metallicity. This trend is similar to the one found in Cen A (Fig.1). In galaxies with the metal-rich fraction flattens or even decreases somewhat, which is likely the result of a substantial fraction of the GC populations in these galaxies stemming from accreted dwarf galaxies.
In galaxies for which the radial distributions of the stellar light and the GC systems both have been measured, the stellar light overall decreases faster with radius than the GC systems. This indicates that the specific frequency or the value of of the GCs increases with distance. If the GC system is split into red metal-rich clusters and blue metal-poor clusters, the red component always drops steeper with distance and follows the stellar light profile more closely than the blue component. This indicates that of the blue component increases faster with distance than the red component (brodie06; pota13). This is in comparison to total stellar light. However, peacock15 have shown for NGC 3115 that if the samples of GCs and stars are both split into blue and red (metal-poor and metal-rich) components, the blue GCs follow the shallow slope of the metal-poor stars. So, the metal-poor clusters follow the same radial distribution as the metal-poor stars and the metal-rich clusters follow the radial trend of the metal-rich stars. Consequently, the cluster-to-star ratio is independent of distance and only dependent on metallicity (in agreement with Figs. 1 and 2 for Cen A and M31 respectively.)
3 Summary of the observations
| Galaxy | Boundary | Objects | Inner | Inner | Outer | Outer |
|---|---|---|---|---|---|---|
| Cen A | 15 kpc | Stars | 0.095 | 0.905 | 0.159 | 0.841 |
| Clusters | 0.330 | 0.670 | 0.522 | 0.478 | ||
| log() | 0.54 | -0.13 | 0.52 | -0.24 | ||
| M31 | 17 kpc | Stars | 0.029 | 0.971 | 0.351 | 0.648 |
| Clusters | 0.432 | 0.568 | 0.643 | 0.357 | ||
| log() | 1.17 | -0.23 | 0.26 | -0.26 | ||
| Fornax dSph | Stars | 0.482 | 0.517 | |||
| Clusters | 1.00 | 0.00 | ||||
| log() | 0.32 | -3 |
(a) Boundary = separation between inner and outer region. (b) The sum within each region is 1. (c) is the ratio between the contribution by clusters of a certain metallicity range to the normalized cluster MDF and the contribution by stars in the same metallicity range to the stellar MDF.