Probing the bond order wave phase transitions of the ionic Hubbard model by superlattice modulation spectroscopy
Abstract
An exotic phase, the bond order wave, characterized by the spontaneous dimerization of the hopping, has been predicted to exist sandwiched between the band and Mott insulators in systems described by the ionic Hubbard model. Despite growing theoretical evidences, this phase still evades experimental detection. Given the recent realization of the ionic Hubbard model in ultracold atomic gases, we propose here to detect the bond order wave using superlattice modulation spectroscopy. We demonstrate, with the help of time-dependent density-matrix renormalization group and bosonization, that this spectroscopic approach reveals characteristics of both the Ising and Kosterlitz-Thouless transitions signaling the presence of the bond order wave phase. This scheme also provides insights into the excitation spectra of both the band and Mott insulators.
In solid state materials, the combination of strong interactions, quantum fluctuations and finely tuned energy scales gives rise to rich physics. For example, in a large class of materials including transition metal oxides Imada et al. (1998), organics Powell and McKenzie (2011) and iridates Witczak-Krempa et al. (2014), the presence of strong on-site repulsion between fermions leads to the suppression of charge motion and to the formation of Mott insulating states. Inducing charge fluctuations around these Mott insulators, e.g. by doping, reveals intricate phase diagrams highlighting the presence of multiple competing orders. Perhaps one of the best known examples is the emergence of -wave superconductivity in high-temperature cuprates at the interface between antiferromagnetic and Fermi liquid phases BednorzMuelller1986 .
Complex states also arise near phase transitions when competing insulating effects are present. In the neighborhood of such transitions, where the strength of the insulating terms is comparable, the effect of smaller terms, such as the kinetic energy, leads to the emergence of metallic phases or exotic correlations. For example, at the interface between the Mott and band insulators, such a competition is believed to play an important role in the ionic to neutral transitions in organic charge-transfer solids Torrance et al. (1981); Nagaosa and ichi Takimoto (1986) and at ferroelectric transitions in perovskites Egami et al. (1993). The ionic Hubbard model, which gained prominence over the last decade, was first developed to explain the physics near these transitions. In this model, the on-site Hubbard repulsion and staggered potential terms induce insulating behavior when taken separately, but when taken together they can compete and give rise to a region of increased charge fluctuations. This region, occuring where these two terms are of comparable strength, is of great interest as this competition leads to the emergence of the bond order wave phase signaled by a spontaneous dimerization of the hopping.
This model is described by the standard Hubbard Hamiltonian to which a staggered potential, with an energy offset between neighbouring sites, is added
Here are the fermionic annihilation (creation) operators and is the particle number operator on site with spin . The amplitude is the hopping matrix element, the repulsive on-site interaction strength, and the number of sites. In one dimension, this model has been the subject of a large number of studies using a variety of techniques including bozonization, density renormalization group, exact diagonalization and quantum Monte Carlo methods Fabrizio et al. (1999, 2000); Gidopoulos, N. et al. (2000); Wilkens and Martin (2001); Torio et al. (2001); Kampf et al. (2003); Zhang et al. (2003); Batista and Aligia (2004); Manmana et al. (2004); Otsuka and Nakamura (2005); Legeza et al. (2006); Tincani et al. (2009). A smaller number of studies have also focused on the excitations of the ionic Hubbard model Aligia and Batista (2005); Hafez and Jafari (2010); Go and Jeon (2011); Hafez Torbati et al. (2014); Hafez-Torbati, Mohsen et al. (2015). Despite initial controversy, theoretical investigations point to the existence, at half filling, of a bond order wave phase occuring around characterized by the spontaneous dimerization of the hopping, i.e. the order parameter ,
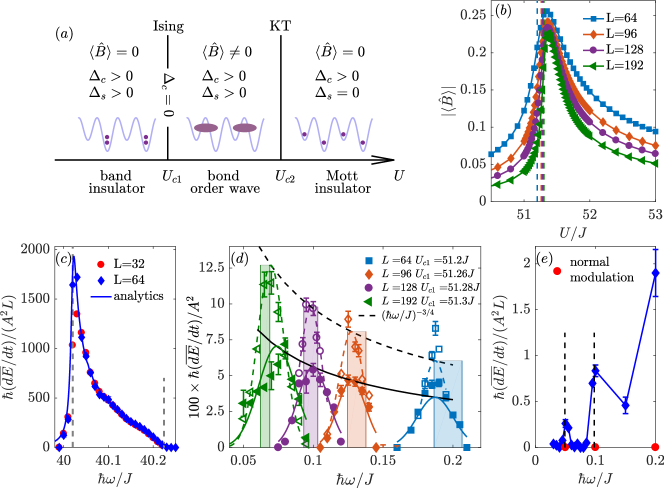
The bond order wave spontaneously breaks site-inversion symmetry, and, in the limit of infinite system size, the state is two-fold degenerate with restored bond-inversion symmetry on either even or odd bonds. The bond order wave phase possesses finite charge and spin gaps and is separated, on the one side, from a band insulating state by an Ising quantum phase transition and, on the other side, from a Mott insulator by a Kosterlitz-Thouless (KT) transition. The ground state phase diagram as a function of the onsite interaction strength, , is shown in Fig. 1(a). Despite strong theoretical evidence, the bond order wave has yet to be experimentally detected.
Ultracold fermionic gases provide an appealing novel avenue to detect this state. The ionic Hubbard model was recently realized using fermions loaded into an optical superlattice potential Tarruell et al. (2012). Furthermore, over the last decade, powerful detection techniques were developed to probe the intricate physics of quantum gases. For instance, characteristic excitations of correlated systems can be probed using various spectroscopic techniques such as radio frequency, Raman, Bragg and lattice modulation spectroscopy Bloch et al. (2008); ToermaeTarruell2015 . In particular, for fermionic systems, modulating the lattice potential was proposed as an approach to detect the pairing gap in a superfluid state and the spin ordering in Mott insulating states Kollath et al. (2006), and as a possible thermometer Loida et al. (2015). Numerous theoretical studies have also considered the response of double occupancy to the modulation of the lattice amplitude Kollath et al. (2006); Huber and Rüegg (2009); Sensarma et al. (2009); Massel et al. (2009); Korolyuk et al. (2010); Xu et al. (2011); Tokuno et al. (2012); Tokuno and Giamarchi (2012); Dirks et al. (2014). Experimentally, this response was used to investigate the fermionic Mott insulator Jördens et al. (2008), to probe nearest-neighbor correlations Greif et al. (2011), and to determine the lifetime of doublon excitations Strohmaier et al. (2010). In addition, mapping out higher Bloch bands in a quasimomentum-resolved fashion Heinze et al. (2011) and studying interband dynamics Heinze et al. (2013) were also carried out using lattice modulation. Directional lattice modulation spectroscopy was used to study charge density wave order in the two-dimensional ionic Hubbard model on an honeycomb lattice Messer et al. (2015).
Detecting the bond order wave and characterizing the nature of the neighboring phase transitions requires the development of a technique which couples directly to the order parameter. We demonstrate here, using time-dependent matrix renormalization group (t-DMRG) DaleyVidal2004 ; WhiteFeiguin2004 ; Schollwöck (2011) and bosonization techniques Delfino and Mussardo (1998); Bajnok et al. (2001); Takacs and Wagner (2006), that superlattice amplitude modulation spectroscopy reveals features of both the Ising and KT transitions in one-dimensional systems signaling the presence of the bond order wave phase. This modulation, also provides insights into the excitation spectra of both the band and Mott insulators, the two phases bordering the bond order wave. On the band insulating side, close to the Ising transition, and in the bond order wave, close to the KT transition, one can follow the closing of the excitation gaps.
The proposed detection method relies on inducing a small time-periodic modulation of the superlattice potential described by the perturbation , with the strength and the frequency of the modulation directly coupling to the order parameter. By contrast with standard lattice amplitude modulation, here the lattice is modulated in a dimerized fashion. Experimentally such a perturbation is achievable by time-periodically tuning the phase between the two laser waves generating the optical superlattice. The number of excitations created through the modulation is then assessed by monitoring the absorbed energy.
Using t-DMRG, we determine the evolution of the full system , with open boundary conditions, and compute the energy of the system as a function of time. Typically, the energy shows a quadratic rise at initial times before entering a linear regime and then saturates at later times. We extract the slope of the linear energy increase, a quantity we identify as the energy absorption rate. For the time evolution using t-DMRG we typically keep states (except at the Ising critical point where we keep ). The error analysis are performed by increasing the matrix dimension to states (and at the Ising critical point). The time-step of the Trotter-Suzuki time evolution is set to and we use to conduct the error analysis. The error bars provided in the figures represent the maximal uncertainties due to the matrix dimension, the time-step and the fit error (as the fit range has been varied).
In the limit of sufficiently weak modulation strength, where linear response theory applies, the energy absorption rate is related to the imaginary part of the dynamic susceptibility associated with the order parameter of the bond order wave, i.e. . Here the imaginary part of the dynamic susceptibility is determined by the Fourier transform of the retarded correlation function where denotes the expectation value with respect to the ground state.
We first consider the structure of the energy absorption rate under the effect of superlattice modulation at the Ising critical point . Within bosonization, is proportional to the Ising order parameter in the vicinity of the Ising transition Fabrizio et al. (1999, 2000). At the Ising quantum critical point, the scaling dimension of the order parameter is . Estimating its dynamic susceptibility at criticality by a scaling argument, we find the absorbed power to diverge as in the thermodynamic limit as the modulation frequency decreases to zero signaling the Ising transition. At frequencies lower than the spin gap, the charge fluctuations dominate causing the divergence. One should note that normal lattice modulation fails to detect the existence of the Ising phase transition. In this case, the energy absorption rate does not present a divergence at the Ising transition as this latter modulation scheme does not couple to the bond order wave.
The form of the divergence is affected by the system size. In a finite system, the imaginary part of the dynamic susceptibility is
with where is the lattice spacing and the sound velocity of the low energy excitations. Thus, for a finite system, the divergence will be signaled by the presence of a series of peaks occuring at with spectral weight scaling as .
In order to test these low energy predictions, we time-evolve systems of different sizes at the Ising critical point for a range of modulation frequencies and extract the energy absorption rates. At low energies (), our numerical results are in good agreement with bosonization and in particular the peak height follows well the predicted divergence. To identify values of near the Ising critical point , we find for each system size the location of the maximum of the derivative of the order parameter, (Fig. 1(b)). Analyzing the energy absorption rate at these values, we then identify the peak footnote2 . We estimate the peak position by fitting a Gaussian to the t-DMRG data for the system of size and modulation amplitude finding . From this we extract the sound velocity of excitations , a typical value for lattice systems. Using the value of the sound velocity extracted for , we then determine the peak positions for the other system sizes which we indicate in Fig. 1(d) by shaded regions. The agreement between these peaks predicted from bosonization and the t-DMRG ones is good. We attribute the disagreement in the peak position and height for to the breakdown of bosonization in the energy range where the corresponding peak appears. While the asymmetry of the peak at and is due to saturation effects in the numerics.
The approach to the Ising phase transition is also detected from the signal obtained on the band insulating side as one can follow the linear closing of the charge gap as the system approaches the critical point. In Fig. 1(c), we present the response deep within the band insulator. The absorption peak is located approximately at , it is very sharp and its width scales approximately as . A strong rise occurs at its left boundary corresponding to a divergence at the lower excitation band edge as also seen in the non-interacting model. The location, width and shape of the peak deep in the band insulator (see solid line in Fig. 1(c)) is understood within an effective model using a Schrieffer-Wolff transformation for the excited states inpreparation . When approaching the Ising transition by increasing , the peak broadens and shifts towards smaller energies. The position of the peak maximum as a function of is shown in Fig. 2, thus confirming that the charge gap closes when approaching the Ising phase transition.

By comparison to the Ising transition, the location of the KT quantum critical point is harder to pinpoint in finite size systems as the bond order wave order parameter falls off very slowly, see Fig. 1(b). Nevertheless, to the left of the KT transition on the bond order wave side, bosonization predicts a gapped response followed by a sharp increase of the energy absorption rate at twice the minimum energy (mass) of a soliton, , corresponding to the creation of a soliton-antisoliton pair
In the spontaneous dimerized phase, singlets form either on even or odd bonds giving rise to a doubly degenerate ground state and solitons are interpreted as domain walls between the two ground states. The operator is SU() invariant, and can only induce transitions from the singlet ground state to excited states within the same spin sector. The lowest available state is a pair of domain walls (solitons) of opposite spins giving a threshold at twice the soliton mass Lecheminant (2005).
To test this prediction, we time-evolve the system near this second phase boundary at for a range of modulation frequencies and extract the energy absorption rate. As shown in Fig. 1(e), we observe sharp rises of the absorption rate at multiples of the spin gap value. The spin gap is obtained from static DMRG calculations in different sectors, . For we find for converged in the matrix dimension. Note, that the normal lattice modulation does not couple to the soliton-antisoliton excitation. Approaching the KT transition from the bond order wave side, the soliton mass becomes smaller and smaller until at the transition the gap closes and a low energy feature, associated with spin excitations, arises on the Mott-insulating side. Hence, superlattice modulation succeeds in signaling the proximity of the KT quantum critical point.
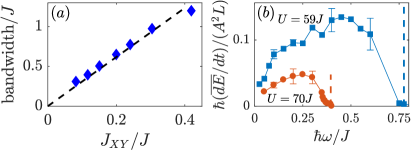
In the Mott insulating phase, the averaged energy absorption rate is predicted by bosonization to be constant at low modulation frequencies in the infinite size limit. In fact, in a finite system we expect equal weight peaks which blend into a constant spectrum when . This spectrum, whose amplitude decreases with increasing , is bounded by the low energy cutoff. Our numerical results for the case of the Mott insulator show at low energies a broad excitation spectrum (see Fig. 3 (b)). We also find that the width and height of the spectrum decrease with increasing . These different features corroborate the predictions from bosonization. Additionally, due to the dominant role played by the spin degrees of freedom in this region of the phase diagram, for , the ionic Hubbard model can be mapped at low energies onto an isotropic Heisenberg chain with exchange interaction Nagaosa and ichi Takimoto (1986). As seen in Fig. 3, the width of the spectrum increases linearly with the strength of the Heisenberg exchange interaction confirming the spin nature of this excitation spectrum. Substructures in the spectrum might arise at longer timescales as revealed in Massel et al. (2009) for the homogeneous Hubbard model.
In summary, we demonstrated that superlattice modulation spectroscopy can be used to detect features of both the Ising and KT transitions signaling the presence of the bond order wave phase. This approach would provide a first experimental glimpse into a phase that has evaded detection in the solid state context and highlights the versatility of spectroscopic methods.
Acknowledgment
We thank A. Sheikhan for insightful discussions. We acknowledge financial support of the DFG (SFB 1238 project C05), ERC Phonton (648166).
References
- Imada et al. (1998) M. Imada, A. Fujimori, and Y. Tokura, Rev. Mod. Phys. 70, 1039 (1998).
- Powell and McKenzie (2011) B. J. Powell and R. H. McKenzie, Reports on Progress in Physics 74, 056501 (2011).
- Witczak-Krempa et al. (2014) W. Witczak-Krempa, G. Chen, Y. B. Kim, and L. Balents, Annual Review of Condensed Matter Physics 5, 57 (2014) .
- (4) J. G. Bednorz and K. A. Mueller, Z. Physik B - Condensed Matter 64, 189 (1986).
- Torrance et al. (1981) J. B. Torrance, A. Girlando, J. J. Mayerle, J. I. Crowley, V. Y. Lee, P. Batail, and S. J. LaPlaca, Phys. Rev. Lett. 47, 1747 (1981).
- Nagaosa and ichi Takimoto (1986) N. Nagaosa and J. Takimoto, Journal of the Physical Society of Japan 55, 2735 (1986) .
- Egami et al. (1993) T. Egami, S. Ishihara, and M. Tachiki, Science 261, 1307 (1993) .
- Fabrizio et al. (1999) M. Fabrizio, A. O. Gogolin, and A. A. Nersesyan, Phys. Rev. Lett. 83, 2014 (1999).
- Fabrizio et al. (2000) M. Fabrizio, A. Gogolin, and A. Nersesyan, Nuclear Physics B 580, 647 (2000).
- Gidopoulos, N. et al. (2000) N. Gidopoulos, S. Sorella, and E. Tosatti, Eur. Phys. J. B 14, 217 (2000).
- Wilkens and Martin (2001) T. Wilkens and R. M. Martin, Phys. Rev. B 63, 235108 (2001).
- Torio et al. (2001) M. E. Torio, A. A. Aligia, and H. A. Ceccatto, Phys. Rev. B 64, 121105 (2001).
- Kampf et al. (2003) A. P. Kampf, M. Sekania, G. I. Japaridze, and P. Brune, Journal of Physics: Condensed Matter 15, 5895 (2003).
- Zhang et al. (2003) Y. Z. Zhang, C. Q. Wu, and H. Q. Lin, Phys. Rev. B 67, 205109 (2003).
- Batista and Aligia (2004) C. D. Batista and A. A. Aligia, Phys. Rev. Lett. 92, 246405 (2004).
- Manmana et al. (2004) S. R. Manmana, V. Meden, R. M. Noack, and K. Schönhammer, Phys. Rev. B 70, 155115 (2004).
- Otsuka and Nakamura (2005) H. Otsuka and M. Nakamura, Phys. Rev. B 71, 155105 (2005).
- Legeza et al. (2006) O. Legeza, K. Buchta, and J. Sólyom, Phys. Rev. B 73, 165124 (2006).
- Tincani et al. (2009) L. Tincani, R. M. Noack, and D. Baeriswyl, Phys. Rev. B 79, 165109 (2009).
- Aligia and Batista (2005) A. A. Aligia and C. D. Batista, Phys. Rev. B 71, 125110 (2005).
- Hafez and Jafari (2010) M. Hafez and S. A. Jafari, arXiv:1004.4265 (2010).
- Go and Jeon (2011) A. Go and G. S. Jeon, Phys. Rev. B 84, 195102 (2011).
- Hafez Torbati et al. (2014) M. Hafez-Torbati, N. A. Drescher, and G. S. Uhrig, Phys. Rev. B 89, 245126 (2014).
- Hafez-Torbati, Mohsen et al. (2015) M. Hafez-Torbati, N. A. Drescher, and G. S. Uhrig, Eur. Phys. J. B 88, 36 (2015).
- (25) It should be emphasized that the amplitude of the modulation , here , needs to be chosen carefully. For small frequencies the period of the modulation becomes large such that one can only observe a few periods within a realistic time interval. For amplitudes smaller than , the absorption onset shifts to later times: measuring the absorption rate then becomes even more difficult.
- Tarruell et al. (2012) L. Tarruell, D. Greif, T. Uehlinger, G. Jotzu, and T. Esslinger, Nature 483, 302 (2012).
- Bloch et al. (2008) I. Bloch, J. Dalibard, and W. Zwerger, Rev. Mod. Phys. 80, 885 (2008).
- (28) P. Törmä and L. Tarruel in Quantum Gas Experiments, edited by P. Törmä and K. Sengstock (Imperial College Press, London, 2015) Chap. 10-11, pp. 199–266.
- Kollath et al. (2006) C. Kollath, A. Iucci, I. P. McCulloch, and T. Giamarchi, Phys. Rev. A 74, 041604 (2006).
- Loida et al. (2015) K. Loida, A. Sheikhan, and C. Kollath, Phys. Rev. A 92, 043624 (2015).
- Huber and Rüegg (2009) S. D. Huber and A. Rüegg, Phys. Rev. Lett. 102, 065301 (2009).
- Sensarma et al. (2009) R. Sensarma, D. Pekker, M. D. Lukin, and E. Demler, Phys. Rev. Lett. 103, 035303 (2009).
- Massel et al. (2009) F. Massel, M. J. Leskinen, and P. Törmä, Phys. Rev. Lett. 103, 066404 (2009).
- Korolyuk et al. (2010) A. Korolyuk, F. Massel, and P. Törmä, Phys. Rev. Lett. 104, 236402 (2010).
- Xu et al. (2011) Z. Xu, S. Chiesa, S. Yang, S.-Q. Su, D. E. Sheehy, J. Moreno, R. T. Scalettar, and M. Jarrell, Phys. Rev. A 84, 021607 (2011).
- Tokuno et al. (2012) A. Tokuno, E. Demler, and T. Giamarchi, Phys. Rev. A 85, 053601 (2012).
- Tokuno and Giamarchi (2012) A. Tokuno and T. Giamarchi, Phys. Rev. A 85, 061603 (2012).
- Dirks et al. (2014) A. Dirks, K. Mikelsons, H. R. Krishnamurthy, and J. K. Freericks, Phys. Rev. A 89, 021602 (2014).
- Jördens et al. (2008) R. Jördens, N. Strohmaier, K. Günter, H. Moritz, and T. Esslinger, Nature 455, 204 (2008).
- Greif et al. (2011) D. Greif, L. Tarruell, T. Uehlinger, R. Jördens, and T. Esslinger, Phys. Rev. Lett. 106, 145302 (2011).
- Strohmaier et al. (2010) N. Strohmaier, D. Greif, R. Jördens, L. Tarruell, H. Moritz, T. Esslinger, R. Sensarma, D. Pekker, E. Altman, and E. Demler, Phys. Rev. Lett. 104, 080401 (2010).
- Heinze et al. (2011) J. Heinze, S. Götze, J. S. Krauser, B. Hundt, N. Fläschner, D.-S. Lühmann, C. Becker, and K. Sengstock, Phys. Rev. Lett. 107, 135303 (2011).
- Heinze et al. (2013) J. Heinze, J. S. Krauser, N. Fläschner, B. Hundt, S. Götze, A. P. Itin, L. Mathey, K. Sengstock, and C. Becker, Phys. Rev. Lett. 110, 085302 (2013).
- Messer et al. (2015) M. Messer, R. Desbuquois, T. Uehlinger, G. Jotzu, S. Huber, D. Greif, and T. Esslinger, Phys. Rev. Lett. 115, 115303 (2015).
- (45) A. J. Daley, C. Kollath, U. Schollwöck, G. Vidal, J. Stat. Mech.: Theor. Exp. (2004) P04005.
- (46) S. R. White and A. E. Feiguin, Phys. Rev. Lett. 93, 076401 (2004).
- Schollwöck (2011) U. Schollwöck, Annals of Physics 326, 96 (2011).
- Delfino and Mussardo (1998) G. Delfino and G. Mussardo, Nuclear Physics B 516, 675 (1998).
- Bajnok et al. (2001) Z. Bajnok, L. Palla, G. Takács, and F. Wágner, Nuclear Physics B 601, 503 (2001).
- Takacs and Wagner (2006) G. Takacs and F. Wagner, Nuclear Physics B 741, 353 (2006).
- (51) In contrast, the peaks are expected at energies which are too low in frequency to be resolved by our numerics.
- (52) K. Loida, J.-S. Bernier, R. Citro, E. Orignac, and C. Kollath, in preparation.
- Lecheminant (2005) P. Lecheminant, in Frustrated spin systems, edited by H. T. Diep (World Scientific, Singapore, 2005) Chap. 6, p. 307.