The peculiar GRB 110731A: Lorentz factor, jet composition, central engine, and progenitor
Abstract
The jet compositions, central engines, and progenitors of gamma-ray bursts (GRBs) remain open questions in GRB physics. Applying broadband observations, including GRB prompt emission and afterglow properties derived from Fermi and Swift data, as well as from Keck host-galaxy observations, we address these questions for the peculiar, bright GRB 110731A. By using the pair-opacity method, we derive during the prompt emission phase. Alternatively, we derive and by invoking the early-afterglow phase within the homogeneous density and wind cases, respectively. On the other hand, nondetection of a thermal component in the spectra suggests that the prompt emission is likely powered by dissipation of a Poynting-flux-dominated jet leading to synchrotron radiation in an optically thin region. The nondetection of a jet break in the X-ray and optical bands allows us to place a lower limit on the jet opening angle . Within a millisecond magnetar central engine scenario, we derive the period and polar magnetic field strength , which have extreme (but still allowed) values. The moderately short observed duration (7.3 s) and relatively large redshift () place the burst as a “rest-frame short” GRB, so the progenitor of the burst is subject to debate. Its relatively large parameter (ratio of the 1 s peak flux of a pseudo-GRB and the background flux) and a large physical offset from a potential host galaxy suggest that the progenitor of GRB 110731A may be a compact-star merger.
Subject headings:
gamma rays: bursts — radiation mechanisms: nonthermal1. Introduction
Despite decades of investigation, there still exist several open questions in gamma-ray burst (GRB) physics, particularly regarding their progenitors, central engines, and jet compositions (e.g., Zhang 2011; Kumar & Zhang 2015).
Traditionally, GRBs are classified into long/soft and short/hard categories based on their distributions in the vs. hardness-ratio plane (Kouveliotou et al. 1993). However, the measurement of is energy and instrument dependent (Qin et al. 2013). Observations of the host-galaxy properties and supernova associations of GRBs suggest that the majority of long-duration GRBs originate from core collapse of massive stars (“collapsars”; Woosley 1993), while the majority of short-duration GRBs originate from coalescence of two compact stars (Paczýnski 1986; Eichler et al. 1989). But with only duration information, the physical category of a GRB is sometimes misclassified (e.g., Gehrels et al. 2006; Levesque et al. 2010); multiwavelength data are needed to make correct classifications (Zhang et al. 2009). Correctly identifying compact-star merger systems is of great interest, since they are promising gravitational wave sources to be detected by advanced LIGO/Virgo (e.g., Chu et al. 2016).
Within both the collapsar and compact-star merger models, another interesting question is what central engine launches the relativistic outflow. A widely discussed scenario invokes a hyperaccreting stellar-mass black hole with an accretion rate of 0.1-1 s-1 (e.g., Popham et al. 1999; Narayan et al. 2001; Chen & Beloborodov 2007; Liu et al. 2008; Kumar et al. 2008; Lei et al. 2013). On the other hand, some GRBs, both long and short, have been discovered to have a plateau emission component in their X-ray afterglows (Zhang et al. 2006; O’Brien et al. 2006; Liang et al. 2007), some of them having an extremely steep drop following the plateau (known as internal plateaus; Troja et al. 2007; Liang et al. 2007; Lyons et al. 2010; Rawlinson et al. 2010, 2013; Lü & Zhang 2014; Lü et al. 2015). Such behavior is consistent with a millisecond magnetar central engine (Usov 1992; Dai & Lu 1998; Zhang & Mészáros 2001; Gao & Fan 2006; Fan & Xu 2006; Metzger et al. 2010). The steep drop at the end of the plateau may be consistent with the collapse of a supramassive neutron star (NS) to a black hole (e.g., Zhang 2014), which has profound implications for the inferred NS equation of state (Fan et al. 2013a; Lasky et al. 2014; Ravi & Lasky 2014; Lü et al. 2015; Gao et al. 2016). The existence of a supramassive NS as a compact-star merger product also enhances electromagnetic signals of gravitational wave sources (Zhang 2013; Gao et al. 2013a; Yu et al. 2013; Metzger & Piro 2014; Fan et al. 2013b), which gives encouraging prospects of confirming the astrophysical nature of gravitational wave sources detected by advanced LIGO/Virgo (e.g., Abbott et al. 2016). One challenging task is to distinguish millisecond magnetars (possibly supramassive) from hyperaccreting black holes based on data.
The next open question is regarding the composition of the relativistic jet launched from the central engine, as well as how energy is dissipated to give rise to prompt emission. Competing models include the fireball internal shock model (Rees & Mészáros 1994), dissipative photosphere models (Thompson 1994; Rees & Mészáros 2005; Pe’er et al. 2006), and the internal-collision-induced magnetic reconnection and turbulence (ICMART) model (Zhang & Yan 2011; Deng et al. 2015). The first two models have the magnetization parameter much less than unity at the GRB emission site, while the ICMART model has a moderately large at the emission site, with the GRB emission powered by directly dissipating the magnetic energy to radiation. These models have distinct predictions for GRB spectra, light curves, and other properties. Observations can be used to differentiate among them.
Finally, it is well known that most of the broadband afterglow emission is produced from forward and reverse external shocks (Mészáros & Rees 1997; Sari et al. 1998; Kobayashi 2000; Mészáros 2002; Zhang & Mészáros 2004; Gao et al. 2013b), but the properties of the ambient medium as well as the shock microphysics parameters remain poorly constrained (Santana et al. 2014; Wang et al. 2015).
GRB 110731A is a bright GRB jointly detected by the Swift and Fermi satellites. The abundant data collected from the burst make it a good target to address the open questions discussed above (e.g., Ackermann et al. 2013; Lemoine et al. 2013; Fraija 2015; Hascoet et al. 2015). In this paper, we reduce the available high-energy data and present new observations of the host galaxy of the GRB (§2). We use the broadband data to constrain the properties of the GRB, including its bulk Lorentz factor (§3), jet composition (§4), central engine (§5), and progenitor (§6). Our conclusions and discussion are given in §7.
2. Data Reduction and Analysis
2.1. Data Reduction
Both the Swift Burst Alert Telescope (BAT) and the Fermi Gamma-ray Burst Monitor (GBM) triggered GRB 110731A. The burst was also detected by the Large Area Telescope (LAT), so high-energy photons above 100 MeV were detected with significance (Ackermann et al. 2013). The Swift X-Ray Telescope (XRT) and Ultraviolet/Optical Telescope (UVOT) promptly slewed to the source 56 s and 62 s after the BAT trigger, respectively. Bright X-ray and optical afterglows were detected with a spectroscopic redshift identified (Tanvir et al. 2011).
2.2. Prompt Emission
The Fermi Gamma-ray Space Telescope comprises two science instruments, the GBM (Meegan et al. 2009) and the LAT (Atwood et al. 2009). The GBM has 12 sodium iodide (NaI) detectors covering an energy range from 8 keV to 1 MeV, and two bismuth germanate (BGO) scintillation detectors sensitive to higher energies between 200 keV and 40 MeV (Meegan et al. 2009). The signals from each of the 14 GBM detectors have three different types: CTIME, CSPEC, and TTE. The TTE event data files contain individual photons with time and energy tags. The LAT observes the energy of photons from 20 MeV to 300 GeV (Atwood et al. 2009). The standard LAT analysis is performed with the latest Pass 8 release data ( MeV). However, the LAT Low Energy (LLE) data are produced by increasing the effective area of the LAT at low energy ( MeV) and with very loose event selection. It required only minimal information, such as the existence of a reconstructed direction. Also, it is suitable for studying transient phenomena, such as GRBs. The LLE analysis also has been updated to the latest Pass 8 event reconstruction; for more information, refer to the official Fermi website111http://fermi.gsfc.nasa.gov/ssc/data/. As suggested by the Fermi team,222http://fermi.gsfc.nasa.gov/ssc/data/analysis/LAT_caveats.html , it is suitable to use standard LAT event data at high energies and LLE data at low energies.
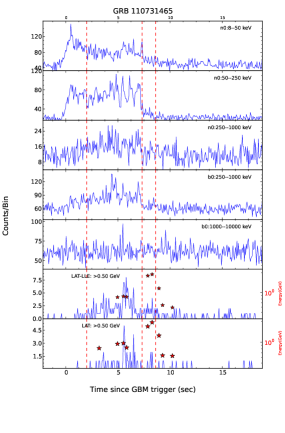
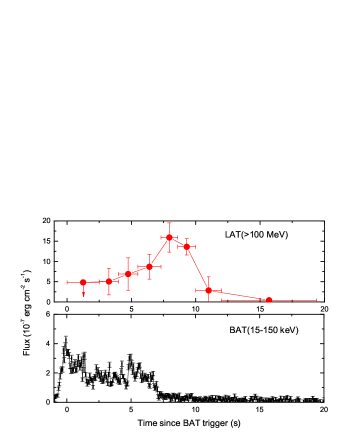
Based on the standard heasoft tools (v. 6.19) and the Fermi ScienceTool (v10r0p5), the PYTHON source package 333http://sourceforge.net/projects/gtburst/ is designed to analyze the GBM and LAT data, as well as the LLE data. A step-by-step guide to the can be found on the website444fermi.gsfc.nasa.gov/ssc/data/analysis/scitools/gtburst.html/. We downloaded GBM, LLE, and LAT data for GRB 110731A from the public science support center at the Fermi website. Then, we extracted the light curves and performed spectral analysis based on the package gtBurst. By invoking the heasoft command fselect and the ScienceTool command gtbin, we extracted light curves with a bin size of 0.064 s. However, for the standard LAT data, we employed an unblinded likelihood analysis method to build the LAT light curve based on gtBurst. By invoking the Standardcut function in , we adopted the photons above 100 MeV in a region of interest of and excluded the photons with zenith angle to avoid the contribution of Earth’s limb. Then, we extracted the light curve with a bin size of 0.1 s by using the command gtbin. The resulting light curves of the GBM, LAT, and LLE data for GRB 110731A are shown in Figure 1. The high-energy photons above 500 MeV from the LLE and LAT are also overplotted at the bottom of Figure 1.
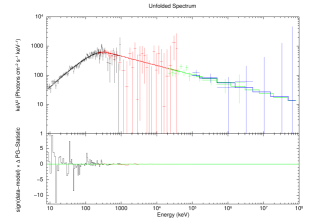
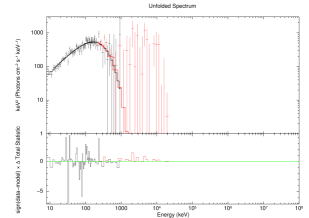
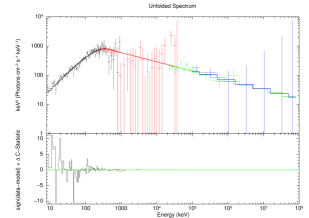
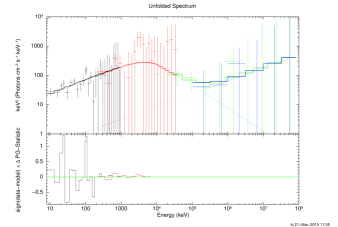
By invoking “TasksMake spectra for XSPEC” in , we extracted the source spectra of the GBM and LLE data. The background spectra are extracted from the time intervals before and after the prompt emission phase and modeled with a polynomial function. Then, we extracted the source spectra by applying the background model to the prompt emission phase. We derived the LAT spectrum files and response files by invoking “TasksMake likelihood analysis” in . First, a standard cut was performed as done above. The Galactic interstellar emission model (gll_iem_v06.fits) and the isotropic spectral template (iso_P8R2_SOURCE_V6_V06.txt) will be used to reduce the Galactic diffuse and isotropic emission background contamination. A simple three-component model (an isotropic diffuse component, a Galactic diffuse component, and a point source with a power-law spectrum) and the IRF P8R2_TRANSIENT020_V6 were used for unbinned likelihood analysis. Second, the corresponding response file and background spectrum file of the GRB’s PHA1 spectrum file were obtained by using the tools of gtbin, gtrspgen, and gtbkg. Finally, we adopted XSPEC to conduct a joint spectral fit with a CSTAT statistic method with the GBM, LLE, and LAT spectra. The results for three time-resolved spectra and a time-integrated spectrum are shown in Figure 2.
The duration of GRB 110731A is s in the energy band 50–300 keV (Gruber 2011), and the fluence is erg cm-2 in the energy band 10–1000 keV. The time-averaged (from s to s, where is the BAT trigger time) spectrum is shown in Figure 2, which can be well fit by a Band function with keV, , and without the need for an additional thermal component555In order to avoid confusion with temporal () and spectral () indices, we use and to indicate the low-energy and high-energy photon spectral indices of the Band function.. According to the concordance cosmology with parameters km s-1 Mpc-1, , and , the total isotropic-equivalent energy in the 10 keV–10 GeV band is erg with .
We also extracted light curves obtained with Swift/BAT. For this process, we developed an IDL script to automatically download and maintain the Swift/BAT data, and then we used standard HEASOFT tools (v. 6.12) to process the data. By running bateconvert from the HEASOFT software release, we obtain the energy scale for the BAT events. The light curves are extracted by running batbinevt in the 15–150 keV energy range (bottom panel in Fig. 3). The time-averaged spectrum can be best fit by a simple power-law model with photon index owing to the narrow energy range. No obvious spectral evolution was seen in the time-resolved spectral BAT data. The spectral index within the range 6.5–8.6 s is .
2.3. GeV Flare
Figure 3) shows the minute-scale structure of the LAT light curves. We fit the light curves with a model of multiple power-law components: a power-law function , or a broken power-law function , where , , and are the temporal slopes, is the peak time, and measures the sharpness of a peak of the light-curve component. One has a fast-rising () phase initially within the time interval 3.2–7.5 s, followed by a very rapid decay () phase within the time interval 7.5–16.5 s (see Figs. 3 and 4). Finally, one flat component follows the rapid decay phase. The peak of the GeV emission is at around 8 s. Two highest-energy photons ( GeV) were detected in the time interval of 8–9 s after the BAT trigger (see Fig. 2, which shows the arrival time for high-energy photons above 500 MeV). The LAT spectrum is fitted well by a single power-law model, , and a clear hard-to-soft spectral evolution during the decay phase is present.
Ackermann et al. (2013) and Fraija (2015) suggested that this GeV emission is the afterglow onset from the external shock. However, the steep temporal indices of both the rising and decaying phases, as well as the hard-to-soft spectral evolution, disfavor the afterglow onset scenario. Rather, it is more like flare emission, which is similar to the X-ray flare emission commonly observed in X-ray afterglows (Burrows et al. 2005; Chincarini et al. 2007; Margutti et al. 2010). We therefore define this GeV emission as a GeV flare and discuss its physical origin. The isotropic energy and luminosity of this GeV flare are erg and erg s-1 with . Figure 3 shows a comparison between the light curves in the LAT and BAT bands.
2.4. X-Ray Afterglow
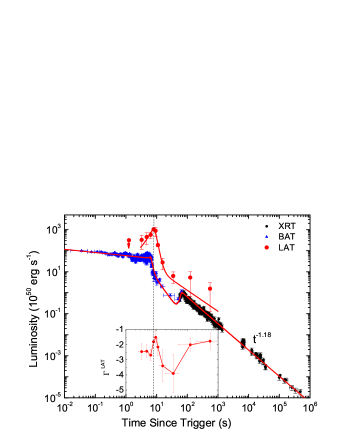
We take the XRT data from the Swift UK XRT team website666http://www.swift.ac.uk. The X-ray afterglow light curve shows a rapid increase () and then a normal decay (), with a peak time at s in the observed frame777Ackermann et al. (2013) explained the rapid flux increase in the XRT band around 65 s as an X-ray flare. However, since both the X-ray and optical light curves after the peak decay as a power-law function with a typical index, the initial rapid increase of the XRT light curve would be more like the onset of the afterglow with flickering contamination, as observed in GRB 061007 (Mundell et al. 2007).. No jet break feature was detected up to days. The photon index during the X-ray afterglow phase is , which is similar to the photon index in the LAT band. Figure 4 shows the BAT and XRT light curves from the GRB trigger to s later. One finds that the prompt emission phase is essentially a very short plateau with a decay index on a logarithmic scale. Then, it is followed by a sharp drop within the time interval 6.5–8.6 s888However, the temporal decay index is dependent on the zero-time (), which is more difficult to determine. In our calculation, we assume that the BAT trigger time is also the zero-time., and the break time is s.
2.5. Keck Observation of a Potential Host Galaxy
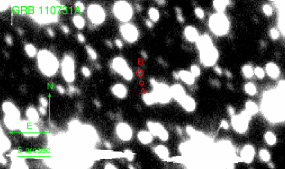
We took images of GRB 110731A using the Low Resolution Imaging Spectrometer (Oke et al. 1995) with the Keck I 10 m telescope on 15 June 2015 UT in the and filters with s exposures (see Fig. 5). We use the optical image from GROND to double-check the position of GRB 110731A, which is at (J2000) , (Ackermann et al. 2013). The foreground stars are very saturated and crowded; thus, in order to calibrate the magnitudes of stars in the field, we took an image with the 1.0 m Nickel telescope at Lick Observatory on 2015 June 30 UT. At the exact afterglow position, we did not find an apparent host galaxy of GRB 110731A, with a limiting magnitude of .
On the other hand, we found a potential extended source to the northeast of the afterglow position, which might be the host galaxy of GRB 110731A. The source has an -band magnitude of (as shown in Fig. 5 with circle B). Following Bloom et al. (2002) and Berger (2010), we calculate the probability of association for a given galaxy of brightness at a separation from a GRB position:
| (1) |
where the galaxy number counts are given by arcsec-2 (Hogg et al. 1997). Assuming a physical association, the offset between this putative host galaxy and the GRB afterglow is , which corresponds to kpc at . We find that the possibility that GRB 110731A resides in this host galaxy is about 3%.
3. Constraints on the Bulk Lorentz Factor
The broadband data allow us to constrain the bulk Lorentz factor of the GRB with two different methods.
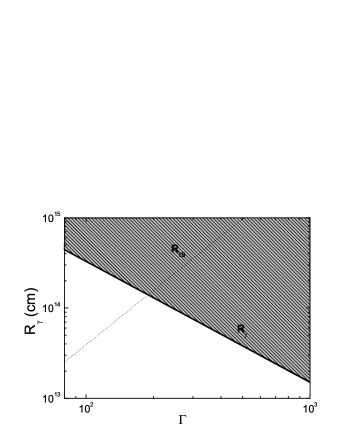
The first is the pair-opacity method. The broadband featureless Band-function spectra extending to very high energies ( MeV) pose a lower limit on to avoid two-photon pair production (). If a cutoff energy is detected in the spectrum, one may constrain and the radius of the emission region () by requiring the optical depth (Zhang & Pe’er 2009) to be
| (2) | |||||
where and are the luminosity distance and redshift, respectively, and , , and are the fundamental constants of electron mass, speed of light, and Thomson cross section, respectively. The parameter is related to the Band-function parameters as
| (3) |
where is the time interval for spectral fitting, 8.6 s. Also, , , and are the parameters of the time-integrated spectrum within 0–8.6 s by invoking a Band-function fit, and the fitting results are presented in Table 1. The Band-function normalization is ph cm-2 s-1 keV-1. The coefficient can be expressed as (Svensson 1987)
| (4) |
For the spectra of GRB 110731A, a cutoff power-law model is not consistent with the data. However, a Band function combined with an extra power-law component provides a good fit from 7.3 s to 8.6 s. There is no cutoff feature in the spectra when this extra power-law component extends to the GeV energy band. The highest-energy observed photon had GeV. Hence, we can use this maximum-energy photon to replace in Eq. 2, and we estimate the lower limit of the bulk Lorentz factor () by assuming that both MeV and sub-MeV photons are from the same zone. By using the condition, one derives within the internal-shock model, , where is the minimum variability timescale. But is subject to large uncertainties because GRB light curves are chaotic, without a characteristic timescale, and it also depends on the bin size and energy. In our calculation, s is adopted to get a higher signal-to-noise ratio for the GBM-LAT light curve. The constraints on the range of and are shown in Figure 6. However, if the MeV and sub-MeV photons are from different regions, then the estimated bulk Lorentz factor is more complex (Zhao et al. 2011; Zou et al. 2011).
The second method of estimating the initial Lorentz factor is to use the onset time of the early afterglow. According to a broken power-law fit, the early X-ray afterglow light curve of GRB 110731A peaks at s. The deceleration time is . We apply the standard afterglow model with a constant-density medium (i.e., the interstellar medium [ISM]) to derive the initial Lorentz factor, which reads
| (5) |
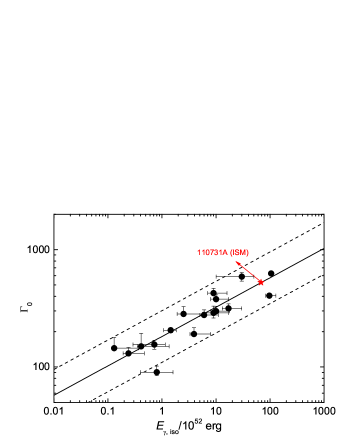
We take cm-3 and radiative efficiency in this analysis and derive999Sari & Piran (1999) derived . Lü et al. (2012) introduced a factor of 1.4 through numerical integration. A more precise treatment by including pressure in the energy-momentum tensor gives our numerical coefficient.. Liang et al. (2010) discovered a tight relation between and . We test to compare whether GRB 110731A is consistent with this correlation. The values cm-3 and % (performed by Liang et al. 2010) are adopted to recalculate the Lorentz factor of GRB 110731A. One has , which is consistent with the correlation between and discovered by Liang et al. (2010). Figure 7 shows the – plot and compares GRB 110731A in a constant-density ISM (filled star) with other typical long GRBs taken from Liang et al (2010). Alternatively, if the medium has a density that decays with radius (wind model), then
| (6) | |||||
where cm-1 is the wind parameter (Yi et al. 2015) and % is adopted. One has , which is much lower than in the ISM case.
4. Jet Composition
Different jet energy dissipation models of prompt emission predict different properties in the emission region, such as the magnetization parameter , the spectral shape, and the – relation. As shown in Figure 6, the condition places a tight lower limit on for the burst, which is much larger than the photosphere radius (typically at – cm). Also, the nondetection of a thermal component in the spectrum also suggests that the photosphere component is suppressed, suggesting that the outflow is Poynting flux dominated (e.g., Zhang & Pe’er 2009; Gao & Zhang 2015).
The rapid decay of X-ray emission at the end of prompt emission () is also consistent with such a picture. The standard model predicts that the decay slope cannot be steeper than a decay index , where is the spectral index (Kumar & Panaitescu 2000). Such a “curvature effect” prediction is valid if the outflow moves with a constant Lorentz factor. Uhm & Zhang (2015) pointed out that the decay slope can be steeper than this prediction if the outflow is undergoing acceleration. Applying the theory to X-ray flares by properly correcting the zero-time effect (Liang et al. 2006), Uhm & Zhang (2016) suggested that the X-ray flare emission region is undergoing rapid acceleration; see also Jia et al. (2016) for an extended analysis of a larger sample of X-ray flares. For GRB 110731A, the rapid decay of X-ray emission at the end of prompt emission is . However, this decay slope is dependent on the zero-time (), which is uncertain.
Owing to the short duration of the prompt emission, we reanalyze the temporal behavior of the X-ray emission at the end of the prompt emission; one has if s is adopted. On the other hand, the photon index of spectra () at the end of the prompt emission is about 1.5 by invoking the power-law model fit, so . Within the curvature-effect scenario, the temporal index and spectral index should satisfy . However, if s is adopted, so the curvature effect is unlikely. Instead, the data seem to be consistent with a model that invokes dissipation of a moderately high Poynting flux in the emission region (e.g., ICMART model; Zhang & Yan 2011). Alternatively, if s is adopted, then , only a little larger than . In this case, the curvature effect cannot be ruled out.
To summarize, the constraint on the emission region , the nondetection of a thermal component in the spectrum, and the possibility of bulk acceleration in the emission region all point toward a consistent picture regarding the jet composition of GRB 110731A: it is very likely Poynting flux dominated.
5. Central Engine
Two types of GRB central engine models have been discussed in the literature (see, e.g., Kumar & Zhang 2015, for a review). One type invokes a hyperaccreting stellar-mass black hole (e.g., Popham et al. 1999; Narayan et al. 2001; Lei et al. 2013). The second type invokes a rapidly spinning, strongly magnetized NS called a millisecond magnetar, which has been invoked to interpret the shallow-decay, long-lasting, early-afterglow phase (Dai & Lu 1998; Zhang & Meszaros 2001) in both long and short GRBs (Fan & Xu 2006; Troja et al. 2007; Rowlinson et al. 2010, 2013; Lü et al. 2015). Within the black hole central engine, the plateau and subsequent steep decay are more difficult to interpret. Here, we test whether the magnetar central engine can power GRB 110731A based on the observed properties of GRB 110731A — i.e., the plateau phase produced by energy injection from a magnetar wind, and the sharp drop thereafter being due to the collapse of the magnetar forming a black hole.
According to Zhang & Mészáros (2001), the energy reservoir is the total rotation energy of the millisecond magnetar,
| (7) |
where is the moment of inertia, is the initial angular frequency of the NS, , and the convention is adopted in cgs units for all other parameters throughout the paper. The characteristic spin-down luminosity and spin-down timescale are related to the magnetar initial parameters
| (8) |
| (9) |
where and correspond to the surface polar cap magnetic field and initial spin period, respectively.
Using Eq. 8 and Eq. 9, one can derive and as
| (10) |
| (11) |
Through light-curve fitting, one can derive the break-time luminosity as
| (12) |
where is flux at break time . For a plateau, the characteristic spin-down luminosity can be estimated as
| (13) |
The spin-down timescale can be generally identified as
| (14) |
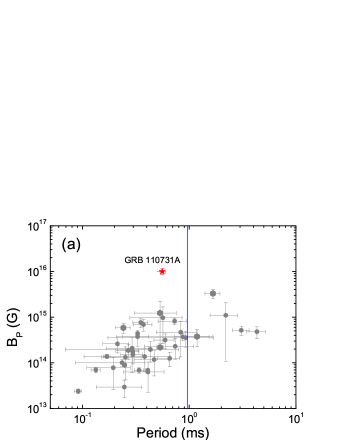
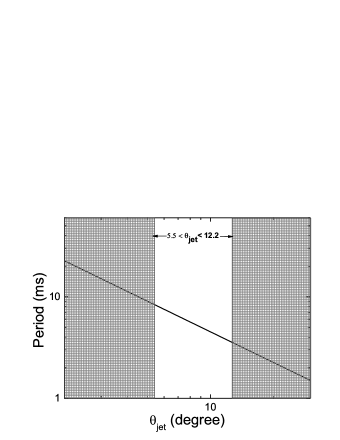
The “greater than” sign takes into account that the supramassive magnetar collapses to a black hole before it is significantly spun down. One can therefore derive G and ms if we assume that the magnetar wind is isotropic (see Fig. 8a). Since this value of is shorter than the breakup limit of an NS ( ms; Lattimer & Prakash 2004), we also consider a possible beaming factor () of the GRB outflow,
| (15) |
where is jet opening angle. The jet opening angle can be estimated as
| (16) | |||||
where cm-3 is the ambient-medium density and is the kinetic energy of the outflow. The temporal index of the normal decay segment is , and the spectral index is . They satisfy , suggesting a spectral regime . Following Zhang et al. (2007), we derive
where . With standard values of microphysics parameters (e.g., Panaitescu & Kumar 2002; Yost et al. 2003), such as , , and cm-3, we derive erg. No jet break feature was detected up to days of afterglow emission; we therefore set a lower limit on the jet opening angle, .
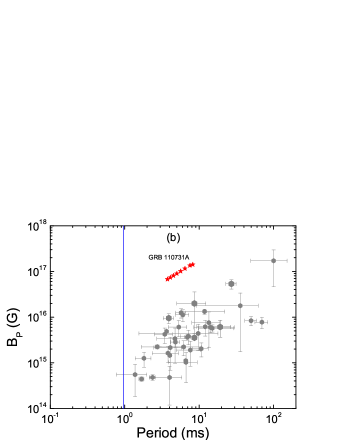
Within the magnetar model, one can also set an upper limit of by requiring that the total energy does not exceed the total spin energy of the magnetar: , where , , and is the energy of the GeV flare. This gives . By including the range of the opening angle , we rederive the magnetar parameters for GRB 110731A (red stars in Fig. 8b). We find that the upper limit is in the allowed range (longer than the breakup limit), but the inferred upper limit is significantly larger than the values inferred for other GRBs. In any case, since is an upper limit, the magnetar model is possible given that the spin-down time is much longer than .
Within this supramassive NS collapsing framework, there is another energy budget, the total magnetic field energy after the magnetosphere is expelled following the collapse of the NS. It may be estimated as (Zhang 2014)
| (18) | |||||
where is the light-cylinder radius. This is a relatively small energy for typical parameters, but can be important if is large (close to the upper limit inferred above).
Figure 9 gives all the energy components as a function of jet opening angle, with the allowed range marked.

6. Progenitors
With the measured , GRB 110731A has a rest-frame duration shorter than 2 s. This naturally raises the interesting question regarding the progenitor system of this burst (Type I vs. Type II; Zhang et al. 2009). In the past, there have been quite a few GRBs that are rest-frame short, including several high- GRBs such as GRB 080913 at with s (Greiner et al. 2009), GRB 090423 at with s (Salvaterra et al. 2009; Tanvir et al. 2009), and GRB 090429B at with s (Cucchiara et al. 2011). Multiwavelength observed properties suggested that those three high- GRBs are likely of a Type II (massive star) origin (Zhang et al. 2009).
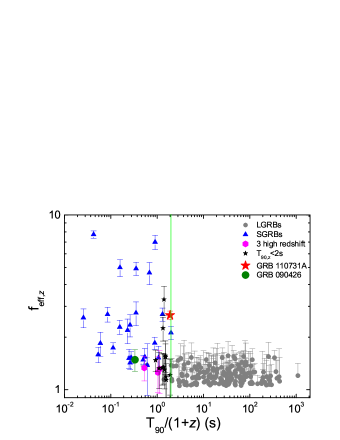
Lü et al. (2014) proposed a method to judge whether a rest-frame short GRB is more likely the “tip of iceberg” of a long-duration GRB. They move a specific long GRB to progressively larger redshifts until the rest-frame duration is shorter than 2 s and then define the ratio of the peak flux of this pseudo-GRB to the background flux as . The value of long GRBs is typically smaller than 2. The three high- GRBs all have smaller than 2, suggesting that they are consistent with being a long GRB as observed at high redshift. We perform the same analysis for GRB 110731A following Lü et al. (2014), and find that the value is . As shown in Figure 10, this value (red star) is higher than that of typical long GRBs (gray), but is consistent with short GRBs (blue triangles). Following Lü et al. (2014), we also calculate the probability () of this being a disguised short GRB: . In general, these arguments suggest that the GRB is consistent with having a Type I (compact-star merger) origin.
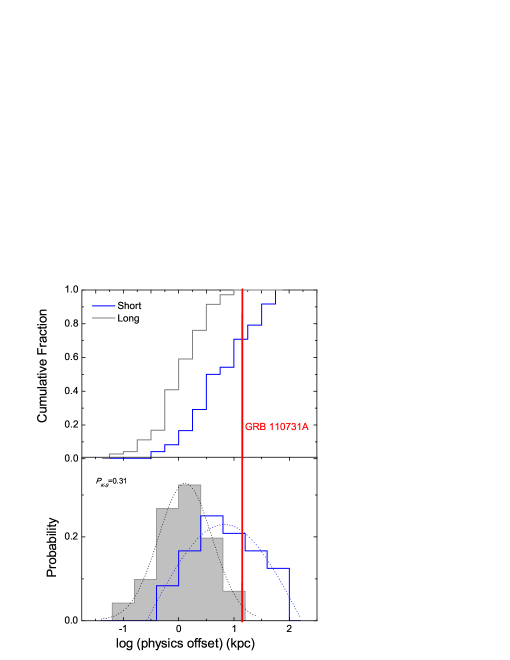
The host-galaxy information seems to also support a Type I origin for GRB 110731A. As discussed in § 2.5, our Keck observation revealed an extended source northeast of the afterglow position, which might be the host galaxy of GRB 110731A. The source has an -band magnitude . The offset between this source and the GRB afterglow is , which corresponds to kpc, with the possibility of a physical association being %. First, we compare the distribution of long GRB physical offsets with those of short GRBs; the K-S test yields , suggesting that the objects are not drawn from the same population. Then, we compare the offset of GRB 110721A with the distributions of the physical offsets of both long and short GRBs observed by the Hubble Space Telescope (Fong et al. 2010; Blanchard et al. 2016). We find that the physical offset of GRB 110731A is larger than that of almost all long GRBs, but is statistically consistent with typical short GRBs (see Fig. 11). This also supports the Type I origin of the burst, if the extended source is indeed the host galaxy of GRB 110731A.
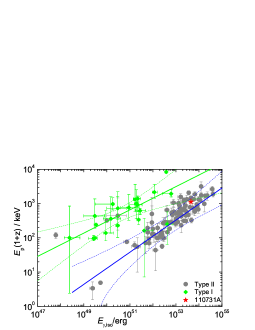
Empirically, most long GRBs are found to satisfy a relationship between and (; Amati et al. 2002), but outliers do exist (e.g., long GRBs 980425, 031203, and 050826). In contrast, most short GRBs are inconsistent with this empirical relation (Zhang et al. 2009) and seem to follow a different correlation with a larger dispersion. However, outliers to this relation also exist (e.g., short GRB 060121). In order to compare GRB 110731A with long and short GRBs, we calculate erg from 1 keV to keV based on the spectral properties and then plot it in the – diagram (see Fig. 12). GRB 110731A falls in the 3 confidence band of power-law fitting of long GRBs. However, this empirical relation does not provide persuasive evidence that GRB 110731A is from massive star core collapse (outliers do exist), and it may be caused by some selection effects.
7. The Origin of the GeV Flare
The origin of the GeV flare is mysterious. As shown in Figure 3, it rises during the prompt emission phase but peaks after the BAT-band emission finished. The time-integrated spectral energy distribution is fitted by a Band function alone, and it seems that the GeV emission has the same origin. However, when we analyze the time-resolved spectra during the GeV flare (from s to s), they are well fitted by a Band function with an additional power-law component (Table 1 and Fig. 2). This suggests that the GeV flare may have a distinct origin from the sub-MeV emission.
If this is the case, one possible scenario is to interpret the GeV flare within the framework of a supramassive NS collapsing into a black hole. Zhang (2014) suggested that the ejection of the magnetosphere may be accompanied by a fast radio burst. It is possible that such an ejection may power a GeV flare. However, the total amount of magnetospheric energy (Eq. 17) is typically smaller than the GeV flare energy, so one runs into an energy budget problem. Nonetheless, the uncertainty in the beaming factor makes it possible that in a certain range of jet opening angles. From Figure 9a, one can derive that the condition is . The specific emission mechanism depends on the particle acceleration details within the ejected magnetosphere, but the sudden acceleration of the magnetosphere makes it plausible to have a GeV peak right after the rapid decline in sub-MeV emission.
Alternatively, the GeV emission may be produced from the external shock (e.g., Kumar & Barniol-Duran 2009, 2010; Ghisellini et al. 2010; Zhang 2011; Maxham et al. 2011; He et al. 2012; Liu et al. 2012). The initial steep decay may suggest a reverse-shock component (e.g., Wang et al. 2001, 2002). However, this interpretation is in conflict with our suggestion of the X-ray peak at 65 s as the deceleration time.
8. Conclusions and Discussion
GRB 110731A is a peculiar GRB with a duration of s detected by Swift and Fermi, and a measured redshift of . The total isotropic-equivalent energy in the 10 keV–10 GeV range is erg for the prompt emission. One GeV flare was detected by LAT with its highest photon energy GeV, and the peak time of the GeV flare corresponds to the transition break time from the prompt emission (plateau) to a steeper decay. The total isotropic-equivalent energy of the GeV flare is erg. Our Keck -band image of the field placed an upper limit to the host-galaxy brightness ( mag) at the afterglow position and identified a putative galaxy with a physical offset of kpc. We analyze the broadband data and compare them with GRB theoretical models, finding the following results.
-
•
We apply both the pair-opacity method and afterglow deceleration time method to constrain the Lorentz factor of the ejecta. The former gives , while the latter gives and within the homogeneous and wind density profiles, respectively.
-
•
The broadband featureless Band-function spectra cover 5–6 orders of magnitude in energy, as well as the very high energy gamma-ray emission ( GeV). Nondetection of a thermal component may be consistent with a Poynting-flux-dominated flow as the jet composition of the burst. On the other hand, during the rapid decay phase following prompt emission, the temporal decay index () is steeper than the curvature-effect prediction , which supports possible acceleration of the emission region. However, this decay slope is dependent on the selected zero-time, which is uncertain.
-
•
The central engine of the GRB may be a millisecond magnetar, but with a relatively large upper limit of both and . With a beaming correction, the total observed energy (sum of , , and ) is within the energy budget provided by the spin energy of the millisecond magnetar ( erg) when the jet opening angle satisfies .
-
•
The burst has a rest-frame duration shorter than 2 s. A relatively large value and a substantial physical offset from the putative host galaxy suggest that the progenitor of GRB 110731A is likely to come from a compact-star merger.
-
•
The GeV flare is mysterious. However, within the magnetar central scenario, the GeV flare may be produced during the ejection of the magnetosphere when the magnetar collapses to form a black hole.
References
- Abbott et al. (2016) Abbott, B. P., Abbott, R., Abbott, T. D., et al. 2016, Physical Review Letters, 116, 061102
- Ackermann et al. (2013) Ackermann, M., Ajello, M., Asano, K., et al. 2013, ApJ, 763, 71
- Amati et al. (2002) Amati, L., Frontera, F., Tavani, M., et al. 2002, A&A, 390, 81
- Atwood et al. (2009) Atwood, W. B., Abdo, A. A., Ackermann, M., et al. 2009, ApJ, 697, 1071
- Berger (2010) Berger, E. 2010, ApJ, 722, 1946
- Blanchard et al. (2016) Blanchard, P. K., Berger, E., & Fong, W.-F. 2016, ApJ, 817, 144
- Bloom et al. (2002) Bloom, J. S., Kulkarni, S. R., & Djorgovski, S. G. 2002, AJ, 123, 1111
- Burrows et al. (2005) Burrows, D. N., Romano, P., Falcone, A., et al. 2005, Science, 309, 1833
- Chen & Beloborodov (2007) Chen, W.-X., & Beloborodov, A. M. 2007, ApJ, 657, 383
- Chincarini et al. (2007) Chincarini, G., Moretti, A., Romano, P., et al. 2007, ApJ, 671, 1903
- Chu et al. (2016) Chu, Q., Howell, E. J., Rowlinson, A., et al. 2016, MNRAS, 459, 121
- Cucchiara et al. (2011) Cucchiara, A., Levan, A. J., Fox, D. B., et al. 2011, ApJ, 736, 7
- Dai & Lu (1998) Dai, Z. G., & Lu, T. 1998, A&A, 333, L87
- Deng et al. (2015) Deng, W., Li, H., Zhang, B., & Li, S. 2015, ApJ, 805, 163
- Eichler et al. (1989) Eichler, D., Livio, M., Piran, T., & Schramm, D. N. 1989, Nature, 340, 126
- Fan et al. (2013) Fan, Y.-Z., Wu, X.-F., & Wei, D.-M. 2013a, Phys. Rev. D, 88, 067304
- Fan & Xu (2006) Fan, Y.-Z., & Xu, D. 2006, MNRAS, 372, L19
- Fan et al. (2013) Fan, Y.-Z., Yu, Y.-W., Xu, D., et al. 2013b, ApJ, 779, L25
- Fong et al. (2010) Fong, W., Berger, E., & Fox, D. B. 2010, ApJ, 708, 9
- Fraija (2015) Fraija, N. 2015, ApJ, 804, 105
- Gao et al. (2013) Gao, H., Ding, X., Wu, X.-F., Zhang, B., & Dai, Z.-G. 2013a, ApJ, 771, 86
- Gao et al. (2013) Gao, H., Lei W.-H., Zou Y.-C., Wu X.-F., Zhang B., 2013b, NewAR, 57, 141
- Gao & Zhang (2015) Gao, H., & Zhang, B. 2015, ApJ, 801, 103
- Gao et al. (2016) Gao, H., Zhang, B., Lü, H.-J. 2016, Phys. Rev. D, 93, 044065
- Gao & Fan (2006) Gao, W.-H., & Fan, Y.-Z. 2006, ChJAA, 6, 513
- Gehrels et al. (2006) Gehrels, N., Norris, J. P., Barthelmy, S. D., et al. 2006, Nature, 444, 1044
- Ghisellini et al. (2010) Ghisellini, G., Ghirlanda, G., Nava, L., & Celotti, A. 2010, MNRAS, 403, 926
- Greiner et al. (2009) Greiner, J., Krühler, T., Fynbo, J. P. U., et al. 2009, ApJ, 693, 1610
- Gruber (2011) Gruber, D. 2011, GRB Coordinates Network, 12221, 1
- Hascoët et al. (2015) Hascoët, R., Vurm, I., & Beloborodov, A. M. 2015, ApJ, 813, 63
- He et al. (2012) He, H.-N., Zhang, B.-B., Wang, X.-Y., Li, Z., & Mészáros, P. 2012, ApJ, 753, 178
- Hogg et al. (1997) Hogg, D. W., Pahre, M. A., McCarthy, J. K., et al. 1997, MNRAS, 288, 404
- Jia et al. (2016) Jia, L.-W., Uhm, Z. L., & Zhang, B. 2016, ApJS, 225, 17
- Kobayashi (2000) Kobayashi, S. 2000, ApJ, 545, 807
- Kouveliotou et al. (1993) Kouveliotou, C., Meegan, C. A., Fishman, G. J., et al. 1993, ApJ, 413, L101
- Kumar & Barniol Duran (2009) Kumar, P., & Barniol Duran, R. 2009, MNRAS, 400, L75
- Kumar & Barniol Duran (2010) Kumar, P., & Barniol Duran, R. 2010, MNRAS, 409, 226
- Kumar et al. (2008) Kumar, P., Narayan, R., & Johnson, J. L. 2008, Science, 321, 376
- Kumar & Panaitescu (2000) Kumar, P., & Panaitescu, A. 2000, ApJ, 541, L9
- Kumar & Zhang (2015) Kumar, P., & Zhang, B. 2015, Phys. Rep., 561, 1
- Lü & Zhang (2014) Lü, H.-J., & Zhang, B. 2014, ApJ, 785, 74
- Lü et al. (2015) Lü, H.-J., Zhang, B., Lei, W.-H., Li, Y., & Lasky, P. D. 2015, ApJ, 805, 89
- Lü et al. (2014) Lü, H.-J., Zhang, B., Liang, E.-W., Zhang, B.-B., & Sakamoto, T. 2014, MNRAS, 442, 1922
- Lü et al. (2012) Lü, J., Zou, Y.-C., Lei, W.-H., et al. 2012, ApJ, 751, 49
- Lasky et al. (2014) Lasky, P. D., Haskell, B., Ravi, V., Howell, E. J., & Coward, D. M. 2014, Phys. Rev. D, 89, 047302
- Lattimer & Prakash (2004) Lattimer, J. M., & Prakash, M. 2004, Science, 304, 536
- Lei et al. (2013) Lei, W.-H., Zhang, B., & Liang, E.-W. 2013, ApJ, 765, 125
- Lemoine et al. (2013) Lemoine, M., Li, Z., & Wang, X.-Y. 2013, MNRAS, 435, 3009
- Levesque et al. (2010) Levesque, E. M., Bloom, J. S., Butler, N. R., et al. 2010, MNRAS, 401, 963
- Liang et al. (2010) Liang, E.-W., Yi, S.-X., Zhang, J., et al. 2010, ApJ, 725, 2209
- Liang et al. (2006) Liang, E. W., Zhang, B., O’Brien, P. T., et al. 2006, ApJ, 646, 351
- Liang et al. (2007) Liang, E.-W., Zhang, B.-B., & Zhang, B. 2007, ApJ, 670, 565
- Liu et al. (2013) Liu, R.-Y., Wang, X.-Y., & Wu, X.-F. 2013, ApJ, 773, L20
- Liu et al. (2008) Liu, T., Gu, W.-M., Xue, L., Weng, S.-S., & Lu, J.-F. 2008, ApJ, 676, 545-548
- Lu et al. (2012) Lu, R.-J., Wei, J.-J., Liang, E.-W., et al. 2012, ApJ, 756, 112
- Lyons et al. (2010) Lyons, N., O’Brien, P. T., Zhang, B., et al. 2010, MNRAS, 402, 705
- Margutti et al. (2010) Margutti, R., Guidorzi, C., Chincarini, G., et al. 2010, MNRAS, 406, 2149
- Maxham et al. (2011) Maxham, A., Zhang, B.-B., & Zhang, B. 2011, MNRAS, 415, 77
- Meegan et al. (2009) Meegan, C., Lichti, G., Bhat, P. N., et al. 2009, ApJ, 702, 791-804
- Mészáros (2002) Mészáros, P. 2002, ARA&A, 40, 137
- Mészáros & Rees (1997) Mészáros, P., & Rees, M. J. 1997, ApJ, 476, 232
- Metzger et al. (2010) Metzger, B. D., Martínez-Pinedo, G., Darbha, S., et al. 2010, MNRAS, 406, 2650
- Metzger & Piro (2014) Metzger, B. D., & Piro, A. L. 2014, MNRAS, 439, 3916
- Mundell et al. (2007) Mundell, C. G., Melandri, A., Guidorzi, C., et al. 2007, ApJ, 660, 489
- Narayan et al. (2001) Narayan, R., Piran, T., & Kumar, P. 2001, ApJ, 557, 949
- O’Brien et al. (2006) O’Brien, P. T., Willingale, R., Osborne, J., et al. 2006, ApJ, 647, 1213
- Oke et al. (1995) Oke, J. B., Cohen, J. G., Carr, M., et al. 1995, PASP, 107, 375
- Paczynski (1986) Paczynski, B. 1986, ApJ, 308, L43
- Panaitescu & Kumar (2002) Panaitescu, A., & Kumar, P. 2002, ApJ, 571, 779
- Pe’er et al. (2006) Pe’er, A., Mészáros, P., & Rees, M. J. 2006, ApJ, 642, 995
- Popham et al. (1999) Popham, R., Woosley, S. E., & Fryer, C. 1999, ApJ, 518, 356
- Qin et al. (2013) Qin, Y., Liang, E.-W., Liang, Y.-F., et al. 2013, ApJ, 763, 15
- Ravi & Lasky (2014) Ravi, V., & Lasky, P. D. 2014, MNRAS, 441, 2433
- Rees & Meszaros (1994) Rees, M. J., & Meszaros, P. 1994, ApJ, 430, L93
- Rees & Mészáros (2005) Rees, M. J., & Mészáros, P. 2005, ApJ, 628, 847
- Rowlinson et al. (2013) Rowlinson, A., O’Brien, P. T., Metzger, B. D., Tanvir, N. R., & Levan, A. J. 2013, MNRAS, 430, 1061
- Rowlinson et al. (2010) Rowlinson, A., O’Brien, P. T., Tanvir, N. R., et al. 2010, MNRAS, 409, 531
- Salvaterra et al. (2009) Salvaterra, R., Della Valle, M., Campana, S., et al. 2009, Nature, 461, 1258
- Santana et al. (2014) Santana, R., Barniol Duran, R., & Kumar, P. 2014, ApJ, 785, 29
- Sari & Piran (1999) Sari, R., & Piran, T. 1999, ApJ, 517, L109
- Sari et al. (1998) Sari, R., Piran, T., & Narayan, R. 1998, ApJ, 497, L17
- Svensson (1987) Svensson, R. 1987, MNRAS, 227, 403
- Tanvir et al. (2009) Tanvir, N. R., Fox, D. B., Levan, A. J., et al. 2009, Nature, 461, 1254
- Tanvir et al. (2011) Tanvir, N. R., Wiersema, K., Levan, A. J., Cenko, S. B., & Geballe, T. 2011, GRB Coordinates Network, 12225, 1
- Thompson (1994) Thompson, C. 1994, MNRAS, 270, 480
- Troja et al. (2007) Troja, E., Cusumano, G., O’Brien, P. T., et al. 2007, ApJ, 665, 599
- Uhm & Zhang (2015) Uhm, Z. L., & Zhang, B. 2015, ApJ, 808, 33
- Uhm & Zhang (2016) Uhm, Z. L., & Zhang, B. 2016, ApJ, 824, L16
- Usov (1992) Usov, V. V. 1992, Nature, 357, 472
- Wang et al. (2001) Wang, X. Y., Dai, Z. G., & Lu, T. 2001, ApJ, 546, L33
- Wang et al. (2002) Wang, X. Y., Dai, Z. G., & Lu, T. 2002, MNRAS, 336, 803
- Wang et al. (2015) Wang, X.-G., Zhang, B., Liang, E.-W., et al. 2015, ApJS, 219, 9
- Woosley (1993) Woosley, S. E. 1993, ApJ, 405, 273
- Yi et al. (2015) Yi, S.-X., Wu, X.-F., Wang, F.-Y., & Dai, Z.-G. 2015, ApJ, 807, 92
- Yost et al. (2003) Yost, S. A., Harrison, F. A., Sari, R., & Frail, D. A. 2003, ApJ, 597, 459
- Yu et al. (2013) Yu, Y.-W., Zhang, B., & Gao, H. 2013, ApJ, 776, L40
- Zhang (2011) Zhang, B. 2011, Comptes Rendus Physique, 12, 206
- Zhang (2013) Zhang, B. 2013, ApJ, 763, L22
- Zhang (2014) Zhang, B. 2014, ApJ, 780, L21
- Zhang et al. (2006) Zhang, B., Fan, Y. Z., Dyks, J., et al. 2006, ApJ, 642, 354
- Zhang et al. (2007) Zhang, B., Liang, E., Page, K. L., et al. 2007, ApJ, 655, 989
- Zhang & Mészáros (2001) Zhang, B., & Mészáros, P. 2001, ApJ, 552, L35
- Zhang & Mészáros (2004) Zhang, B., & Mészáros, P. 2004, International Journal of Modern Physics A, 19, 2385
- Zhang & Pe’er (2009) Zhang, B., & Pe’er, A. 2009, ApJ, 700, L65
- Zhang & Yan (2011) Zhang, B., & Yan, H. 2011, ApJ, 726, 90
- Zhang et al. (2009) Zhang, B., Zhang, B.-B., Virgili, F. J., et al. 2009, ApJ, 703, 1696
- Zhao et al. (2011) Zhao, X.-H., Li, Z., & Bai, J.-M. 2011, ApJ, 726, 89
- Zou et al. (2011) Zou, Y.-C., Fan, Y.-Z., & Piran, T. 2011, ApJ, 726, L2
| Interval (s) | Band | Power-law | PGSTAT/dof | ||
|---|---|---|---|---|---|
| /dof | |||||
| – | 373/315 | ||||
| – | – | 228/242 | |||
| – | 254/315 | ||||
| 263/321 |