NEURAL NETWORK-BASED AUTOMATIC LIVER TUMOR SEGMENTATION WITH RANDOM FOREST-BASED CANDIDATE FILTERING
Abstract
We present a fully automatic method employing convolutional neural networks based on the 2D U-net architecture and random forest classifier to solve the automatic liver lesion segmentation problem of the ISBI 2017 Liver Tumor Segmentation Challenge (LiTS). In order to constrain the ROI in which the tumors could be located, a liver segmentation is performed first. For the organ segmentation an ensemble of convolutional networks is trained to segment a liver using a set of 179 liver CT datasets from liver surgery planning. Inside of the liver ROI a neural network, trained using 127 challenge training datasets, identifies tumor candidates, which are subsequently filtered with a random forest classifier yielding the final tumor segmentation. The evaluation on the 70 challenge test cases resulted in a mean Dice coefficient of 0.65, ranking our method in the second place.
Index Terms— U-net, Deep Learning, Object-based Image Analysis
1 Introduction
Primary and secondary liver lesions can have heterogeneous shape and appearance in image data and thus are very challenging to be segmented automatically. Currently, an acceptable quality level can only be achieved with interactive segmentation approaches.
In this paper, we describe a fully automatic method for liver tumor segmentation, which employs cascaded CNNs similar to [1], to provide a liver and tumor segmentation. We additionally filter the tumor candidates by means of shape- and image-based features computed for each candidate.
The rest of the paper is structured as follows. In Sec. 2 we describe our method for extracting a liver mask from a given CT volume, followed by the liver tumor segmentation outlined in Sec. 3. In Sec. 4, we report the training time and inference time per volume of our method together with results achieved on the challenge test data. We conclude in Sec. 5.
2 Automatic Liver Segmentation
Being able to segment the liver in a CT volume in a robust way plays a crucial role in our method, as the subsequent tumor segmentation is constrained to the liver ROI. For this organ segmentation, we use a two-step liver segmentation pipeline. The first step employs an ensemble of three orthogonal 2D neural networks based on the U-net architecture [2], the second uses a 3D U-net [3] to refine the liver mask. Both steps are given in detail in the following.
2.1 Data and Preprocessing
We trained the neural networks on a dataset containing 179 liver CT volumes used for surgery planning. The dataset was split randomly into two non-overlapping groups comprising 147 and 32 volumes, which were used for training and validation, respectively. The images were acquired on different scanners with a resolution of about 0.6 mm in-plane and a slice thickness of 0.8 mm. All cases were annotated by radiological experts on the venous phase using a slice-wise method based on live-wire, shape-based interpolation, and interactive contour correction [4].
As preprocessing step, we applied DICOM rescale parameters to get values in Hounsfield units, and the padding necessary for the convolutional networks was accordingly done with a fill value of -1000 HU. Resampling was applied only for the first step and will be described below.
2.2 Network Architecture and Training
The 2D U-net model employed in the first step of the liver segmentation pipeline works on 4 resolution levels, resulting in a receptive field of 99 voxels. The channel count is 64 on the first resolution level and is doubled (halved) on each resolution change along the downscaling (upscaling) path, respectively. All neural networks described in this work use ReLu activations followed by batch normalisation and are trained using the Dice loss function and the Adam optimizer on a GeForce GTX 1080.
For the first step, three instances of the 2D U-net model were trained using axial, sagittal and coronal slices resampled to isotropic 2 mm voxels, respectively. Training was stopped due to convergence after about 8 hours each (batch size 10 slices, learning rate 0.005).
The second step had the task of combining the three outputs to a final mask at full original resolution. For this, we employed a small 3D U-net with only two resolution levels and a receptive field of voxels. This network got four input channels: The softmax output of the three 2D U-nets resampled to the original resolution and the original CT volume image, after adapting its value range to a similar range (). For this network we used a batch size of voxels and a learning rate of 0.00035. Despite the higher dimensionality and resolution, convergence with this tiny model was even faster, so training was again stopped after less than 8 hours.
2.3 Postprocessing
We take the biggest connected component after applying a threshold value of 0.5 to the softmax output of the 3D U-net output to receive the final liver mask.
3 Automatic Tumor Segmentation
The liver mask serves as input to the two-step tumor segmentation pipeline to constrain the ROI in which the tumors are searched for. As discussed in the following sections, the first step utilizes a 2D U-net to produce an image containing tumor candidates, which are filtered in the second step using a random forest classifier trained on shape- and image-based features.
3.1 Data and Preprocessing
We used the training data provided by the challenge organizers amounting to 131 CT volumes from various clinical sites with a resolution of about 0.8 mm in-plane and slice thickness of 1.5 mm. The training data comes with reference liver and tumor segmentations. For the training of the neural network and random forest classifier we left 4 flawed cases out (e.g., due to missing reference tumor segmentation). The remaining 127 cases were divided into three non-overlapping groups containing 101, 15 and 11 cases, which were used for training, validation and testing, respectively.
Again, the CT volumes were rescaled to obtain values in Hounsfield units.
3.2 Network Architecture and Training
We used the same 2D U-net architecture as in Sec. 2 to train a model for tumor segmentation. We trained the model with axial slices in the original resolution with a batch size of 3 and 0.00035 learning rate, which took about 12 hours. The loss was restrained to a slightly dilated liver mask in order to focus the network on the liver region. Due to the high class imbalance (tumor class vs. background class), we trained the network using boundary patches only (i.e., patches containing voxels of both classes).
3.3 Postprocessing
Our tumor segmentation mask is based on the hard classification output of the neural network, masked with the liver mask. Subsequently, we compute tumor candidates by extracting 3D connected components of the result.
The network trained so far does not yet have high specificity, possibly due to the employed boundary patch sampling strategy. Therefore, we employ another classifier in order to filter out false positives among the tumor candidates. In this step, we trained a random forest classifier on all tumor candidates produced for the training cases, with features computed for the raw and a refined version of the segmentation mask. The refined version was created using a stroke-based liver tumor segmentation algorithm [5] initialised with the biggest diameter of the raw tumor candidate. We extracted 46 features for each version of tumor candidate using object-based image analysis methods based on the tumor candidate shape, original image intensity statistics and liver mask distance transformation [6]. The latter was added in order to discriminate tumor candidates at the border of the liver mask.
4 Results and Discussion
We computed tumor segmentations for the 70 challenge test cases, achieving a mean Dice coefficient of 0.65, which placed our method at the second place at the LiTS Challenge. The method needs on average 195 s for one case (65, 49 and 81 s for liver segmentation, tumor segmentation and tumor postprocessing, respectively).
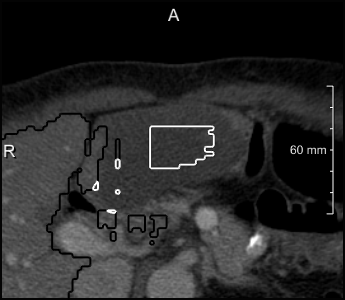
The masking of tumors with the liver region leads in some cases to either an insufficient or a completely wrong tumor segmentation (Fig. 1). We observed, that this problem occurs mainly for cases where bigger tumors are located at the liver boundary.
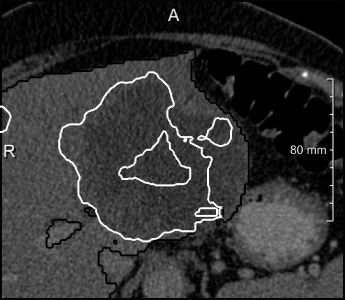
The fact that the loss function of the neural network trained to segment tumors was constrained to the liver mask resulted in a faster training time. The network did not learn how the voxels outside the liver mask should be classified, which leads in some cases to false positives, which cannot be filtered out with our random forest-based postprocessing (Fig. 2).

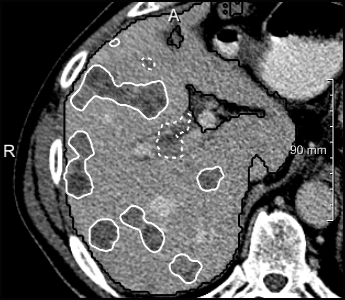
We also observed that the tumor segmentation network has problems with segmenting the center voxels of bigger tumors correctly (Fig. 3). A possible reason for this behavior may be missing context information thath could no be provided by the the effective receptive field [7].
The employed boundary patch sampling strategy results in a higher sensitivity at a cost of a lower specificity compared to a training on all patches. This increases the probability to find all tumors. The accuracy of tumor candidate classification with the random forest approach was 90% (Fig. 4).
5 Conclusions
We have implemented a fully automatic method for liver tumor segmentation in CT scans based on three steps: liver segmentation by classification of all voxels of the CT volume, tumor segmentation by classification of liver voxels, and tumor candidate filtering by classification of connected components. Altogether, our method ranked second according to the volumetric overlap. We would like to emphasize that the evaluation of the automatic tumor segmentation depends on the application scenario and that the Dice score only gives limited information. The best evaluation criterion may have to differentiate between a precise tumor volumetry required for e.g. radioembolisation planning and a tumor detection step that checks whether tumors are present.
In our future work, we plan to investigate 3D network architectures and multi-label approaches in order to overcome the problems faced by our current method.
References
- [1] Patrick Ferdinand Christ, Mohamed Ezzeldin A. Elshaer, Florian Ettlinger, Sunil Tatavarty, Marc Bickel, Patrick Bilic, Markus Rempfler, Marco Armbruster, Felix Hofmann, Melvin D’Anastasi, Wieland H. Sommer, Seyed-Ahmad Ahmadi, and Bjoern H. Menze, Automatic Liver and Lesion Segmentation in CT Using Cascaded Fully Convolutional Neural Networks and 3D Conditional Random Fields, pp. 415–423, Springer International Publishing, Cham, 2016.
- [2] Olaf Ronneberger, Philipp Fischer, and Thomas Brox, U-Net: Convolutional Networks for Biomedical Image Segmentation, pp. 234–241, Springer International Publishing, Cham, 2015.
- [3] Özgün Çiçek, Ahmed Abdulkadir, Soeren S. Lienkamp, Thomas Brox, and Olaf Ronneberger, 3D U-Net: Learning Dense Volumetric Segmentation from Sparse Annotation, pp. 424–432, Springer International Publishing, Cham, 2016.
- [4] Andrea Schenk, Guido Prause, and Heinz-Otto Peitgen, Efficient Semiautomatic Segmentation of 3D Objects in Medical Images, pp. 186–195, Springer Berlin Heidelberg, Berlin, Heidelberg, 2000.
- [5] J. H. Moltz, L. Bornemann, J. M. Kuhnigk, V. Dicken, E. Peitgen, S. Meier, H. Bolte, M. Fabel, H. C. Bauknecht, M. Hittinger, A. Kießling, M. Pusken, and H. O. Peitgen, “Advanced segmentation techniques for lung nodules, liver metastases, and enlarged lymph nodes in ct scans,” IEEE Journal of Selected Topics in Signal Processing, vol. 3, no. 1, pp. 122–134, Feb 2009.
- [6] Michael Schwier, Jan Hendrik Moltz, and Heinz-Otto Peitgen, “Object-based analysis of ct images for automatic detection and segmentation of hypodense liver lesions,” International Journal of Computer Assisted Radiology and Surgery, vol. 6, no. 6, pp. 737, 2011.
- [7] Wenjie Luo, Yujia Li, Raquel Urtasun, and Richard Zemel, “Understanding the effective receptive field in deep convolutional neural networks,” in Advances in Neural Information Processing Systems 29, D. D. Lee, M. Sugiyama, U. V. Luxburg, I. Guyon, and R. Garnett, Eds., pp. 4898–4906. Curran Associates, Inc., 2016.