Chromospheric impact of an exploding solar granule
Abstract
Context. Observations of multi-wavelength and therefore height-dependent information following events throughout the solar atmosphere and unambiguously assigning a relation between these rapidly evolving layers are rare and difficult to obtain. Yet, they are crucial for our understanding of the physical processes that couple the different regimes in the solar atmosphere.
Aims. We characterize the exploding granule event with simultaneous observations of spectroplarimetric data in the solar photosphere and broadband Ca ii H images combined with Interface Region Imaging Spectrograph () slit spectra. We follow the evolution of an exploding granule and its connectivity throughout the atmosphere and analyze the dynamics of a magnetic element that has been affected by the abnormal granule.
Methods. In addition to magnetic flux maps we use a local correlation tracking method to infer the horizontal velocity flows in the photosphere and apply a wavelet analysis on several chromospheric emission features such as Mg ii k2v and Mg ii k3 to detect oscillatory phenomena indicating wave propagation.
Results. During the vigorous expansion of the abnormal granule we detect radially outward horizontal flows, causing, together with the horizontal flows from the surrounding granules, the magnetic elements in the bordering intergranular lanes to be squeezed and elongated. In reaction to the squeezing, we detect a chromospheric intensity and velocity oscillation pulse which we identify as an upward traveling hot shock front propagating clearly through the spectral line diagnostics of Mg ii hk.
Conclusions. Exploding granules can trigger upward-propagating shock fronts that dissipate in the chromosphere.
Key Words.:
Sun: photosphere – Sun: chromosphere – Sun: oscillations1 Introduction
Exploding granules are a readily seen event in the granulation pattern in the photosphere estimated to cover of the solar surface at any given time (Namba, 1986). They are bright granules that show a rapid expansion with expansion rates of to km s-1 and reach diameters as large as ″. Further, they show a dark core in the center, giving them the overall appearance of a bright ring before splitting into smaller granules (see e.g., Namba, 1986; Rast, 1995; Hirzberger et al., 1999). Their temporal evolution in intensity and velocity are well described in Roudier et al. (2001).
More recently, Palacios et al. (2012) analyzed high-resolution spectropolarimetric IMaX/SUNRISE data and found that the evolution of several mesogranular-sized exploding granules is linked to magnetic flux emergence.
In the events described by Hirzberger et al. (1999) it becomes clear that the individual evolution of each exploding granule is shaped by the surrounding material and the conditions present when the granule expands. Often material is observed to be jammed at the borders of the exploding granule which cannot expand freely.
With the high-resolution IRIS spectrograph recording the Mg ii kh 2796 Å spectral region, we are able to link the evolution of a magnetic element trapped by an exploding granule and the neighboring granules with the formation of a shock wave in the chromospheric layer.
2 Observations
We analyzed data taken simultaneously with the Hinode (Tsuneta et al., 2008) and IRIS satellites (De Pontieu et al., 2014) on 28 April 2014 of a quiet Sun area at a heliocentric angle of . The Hinode data consisted of binned Hinode Spectropolarimeter (SP) full Stokes 6302 Å slit spectra (spatial sampling of ″) covering a region of about arcsec2, spectral sampling of 21.5 mÅ, and a cadence of s. The level 0 data were calibrated using the SolarSoft spprep.pro routine (Lites & Ichimoto, 2013). The calibration routine also provides a file with maps for the apparent magnetic flux densities (B and B), as well as continuum maps constructed from the continuum level of the Stokes spectra (Lites et al., 2008). Ca ii H images taken with the Hinode Broadband Filter Imager (BFI) at a cadence of s, exposure time of s, a field-of-view (FOV) of arcsec2, and a spatial sampling ″were processed using the fgprep.pro routine.
The IRIS satellite provided a slitjaw image time series in the Å band at a spatial sampling of ″, a FOV of arcsec2 and a cadence of s. Slit spectra were obtained in a two-step raster (IRIS-program: medium sparse 2-step raster) with a cadence of s for each of the two slit positions recording FUV and NUV spectra in several wavelengths of which we show results in the region of Mg ii hk at 2796 Å .
The spatial sampling along the slit was ″and the step size of the ″wide slit was ″. We obtain level data by running the irismakelev2.pro code. The code performs dark and flat calibration as well as an initial alignment between the slitjaw images and the spectra.
The data from both instruments were aligned using strong network magnetic elements appearing as brightenings in the Hinode Ca ii H images and IRIS slitjaw images and rebinned to the IRIS slitjaw pixel size of ″. We created data cubes at the cadence of the IRIS slitjaw images by selecting for all instruments for each IRIS slitjaw timestamp the images closest to this timestamp. We did not perform an interpolation in time, which leads to repetition in the images for the cubes with a lower cadence (as seen in the online movies). The maximum error T in assigning the frames in reference to the IRIS slitjaw images (fastest cadence) can arise for the Hinode SP and is of the order of one minute.
3 Results and discussion
In the first panel of the movie attached to Fig. 4 one can follow the temporal evolution of the exploding granule as seen in the constructed Hinode SP continuum maps. The time refers to the beginning of the IRIS sequence starting at 11:39:36 UT. A small bright granule (area of arcsec2) is seen in the Hinode SP continuum map cutout located at and just two and a half minutes into the co-observing sequence. The granule explodes by expanding with a rate of about arcsec2 per minute, and then develops a dark core before splitting into several fragments, finally reaching a ring shaped form with an overall size of about arcsec2 at . The morphological evolution of our exploding granule in the photosphere is consistent with Hirzberger et al. (1999).
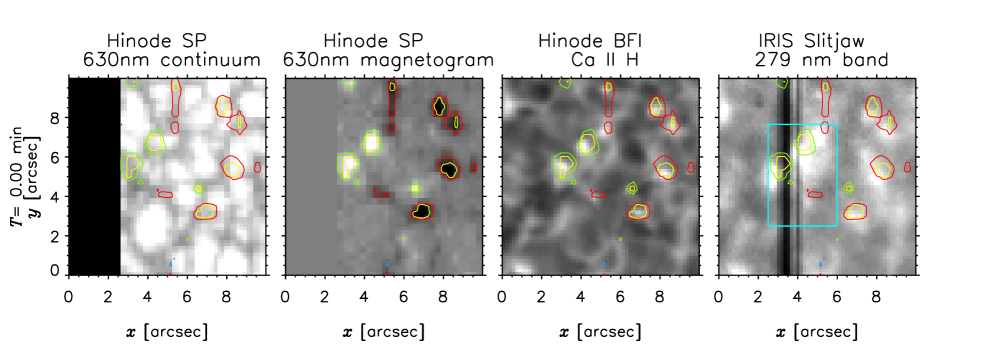
There is a group of mixed polarity strong magnetic elements (> G) that occupies the intergranular lanes in the vicinity of the exploding granule. After the exploding phase they are arranged in a circle around the granule, outlining its border and tracing the same ring-like pattern as seen in the Hinode SP continuum maps. The magnetic elements appear as bright points in the Ca ii H images (third panel in the movie) which again line up as a chain encompassing the exploded granule at the end of the sequence. The bright points are also visible in the IRIS Å band slitjaw images (last panel), as is the location of the slit at the edge of the exploding granule. By this point the interior features several dark lanes and after the maximum size is reached (at about - min) the shape looses coherency and, after a few minutes of granular evolution, cannot be traced anymore.
We use the Fourier Local-Correlation-Tracking (FLCT) code (Fisher & Welsch, 2008) to obtain two-dimensional (2D) velocity fields inferred from the Hinode SOT SP continuum images. These continuum images were constructed using the continuum intensity in Stokes I for each slit position and building up the map with a cadence for the entire FOV of about 70 s. We set the full width at half maximum (FWHM) of the Gaussian used to weigh the pixels for the cross-correlation to four pixels ().
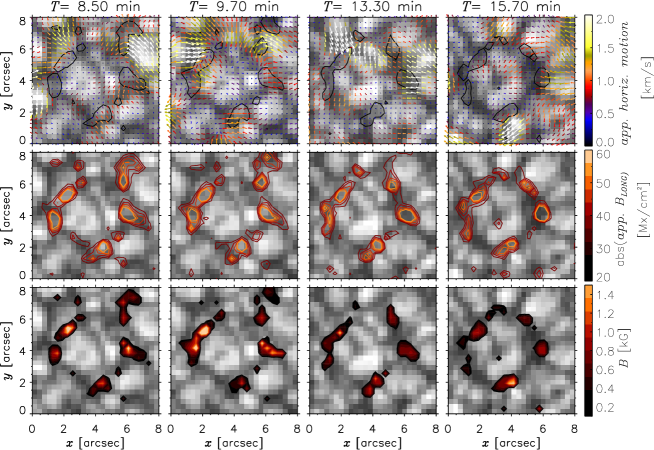
Running the code on pairs of two subsequent images of the time series, we obtain the apparent horizontal velocities for structures on a granular scale. The obtained results displayed in Fig. 1 show velocities greater than km s-1 from the outer granules impinging on the exploding granule. We note that these velocities are only apparent horizontal velocities and are highly dependent on the structure scale of the image and the choice of FWHM of the employed Gaussian weighing function. Especially in a bright expanding larger region, the velocities might be underestimated in the interior due to no apparent structure changes.
At min, the magnetic elements at the edge of the exploding granule at around and experience strong horizontal velocities from both sides; the interior of the exploding granule and the surrounding granules. This gives the impression of the magnetic elements being squeezed by the opposing flows. This is confirmed by the magnetic flux density evolution. The contours of the absolute B maps show a stretching out of the magnetic elements, leading to a more elongated shape (compare, for example, panel one at min and panel three at min in Fig. 1 and separation of the magnetic flux elements. This is accompanied by a decrease in the total magnetic field strength as seen in the last row of Fig. 1 and is therefore not due to a change of the inclination angle tilting the magnetic field.
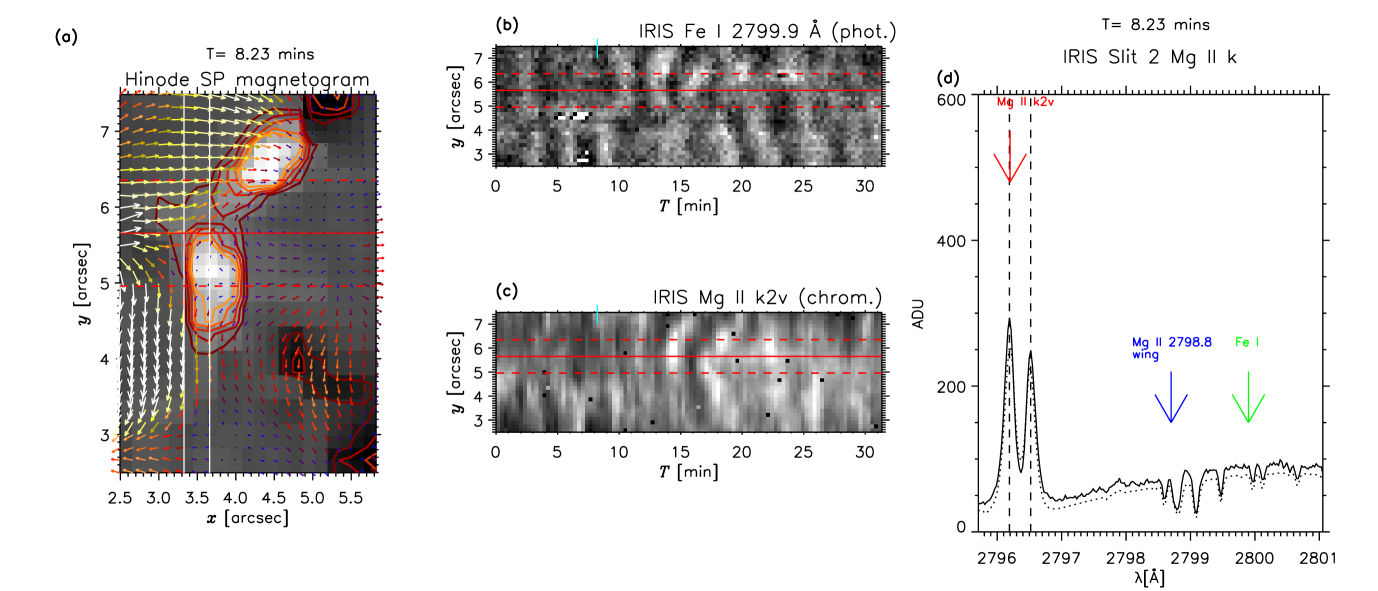
Figure 2 shows the time development of the (high) photospheric line-of-sight velocity from fits to the Fe i 2799.9 Å line and the IRIS Mg ii k2v peak intensity (a good indicator of the chromospheric temperature according to Pereira et al. (2013)) in a spatial section along the slit where blacked-out pixels indicate locations where the feature finding failed.
In both diagnostics, a similar oscillatory pattern is seen, although out of phase, and starting at around min for the photosphere and around 12 min for the chromosphere lasting for a few minutes and located at the area ″of the magnetic element location observed in the Hinode SP magnetic flux density maps. The oscillatory pattern appears one to two minutes after the previously described squeezing of the magnetic elements. As seen in the sample spectra in panel (d) we observe the wing of the Mg ii 2798.8 Å subordinate line going into emission. According to Pereira et al. (2015) this is a sign of heated material in the low chromosphere with cooler material above; a rare quiet Sun event (1% of pixels) also observed in simulations (see also Carlsson et al., 2015). Schmidt & Fisher (2013) have observed similarly rare emission in the Fe i 3969 Å line out of phase with the simultaneously observed Ca ii H2v intensity as a marker of chromospheric dynamics.
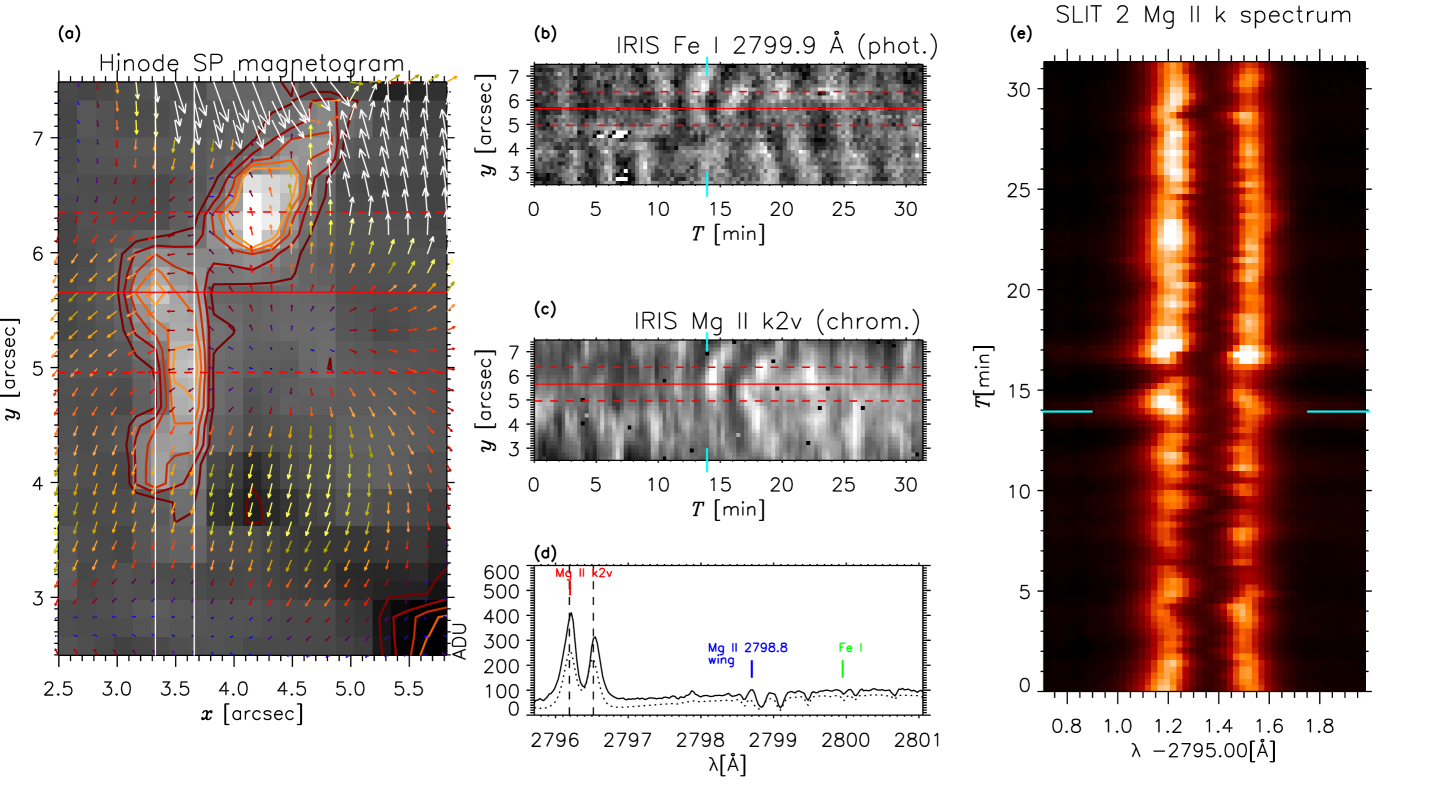
Panel (e) in Fig. 2 shows the Mg ii k spectra in time for the slit position marked with a red solid line in the previous panels. After an initial amplitude increase of the Mg ii k2v peak at about min, a dramatic sudden amplitude increase occurs at around min. At min the red emission peak Mg ii k2r brightens followed again by an increase of the Mg ii k2v peak.
We find a switching of the amplitude increases in the two k2 peaks (see spectrum between min and min). The ratio of the Mg ii k2v to Mg ii k2r peaks is a good indicator of the chromospheric velocity above the peak formation height (Pereira et al., 2013) with a higher peak in the blue emission peak corresponding to down flows. The movie attached to Fig. 5 shows the detailed temporal evolution of the spectra with an increase of the near continuum compared to the average profile clearly seen, for example, at min with the entire spectrum being shifted to higher intensity. These findings indicate a hot temperature front traveling through the high photosphere and throughout the low to mid chromosphere. This is compatible with a shock wave resulting from an oscillation induced at the location of the squeezed magnetic element.
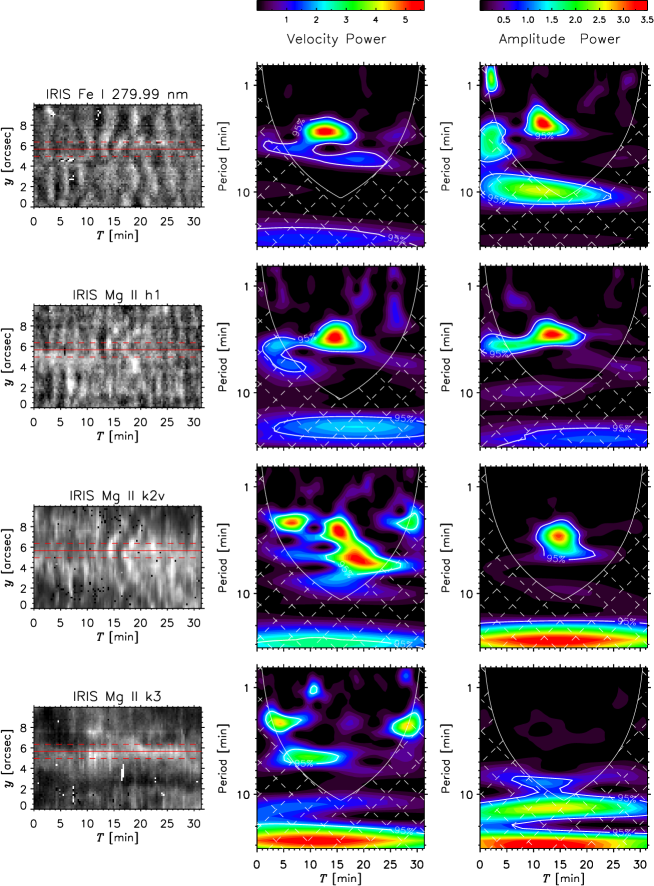
We apply a wavelet analysis on various parameters derived from the IRIS slit spectra using the code provided by C. Torrence and G. Compo (http://atoc.colorado.edu/research/wavelets/) using the default Morlet wavelet. In Fig. 3 we show the results for the velocity and intensity fluctuations in 1.) the photospheric Fe i 2799.9 Å line, 2.) the Mg ii h1 minimum, 3.) the Mg ii k2v peak sampling the low to mid chromosphere (Pereira et al., 2013), and 4.) the Mg ii k3 sampling the high chromosphere (Leenaarts et al., 2013). The wavelet analysis shows a power peak in both the velocity and intensity fluctuations of the photosphere to mid-chromosphere diagnostics, with a delay increasing with height between the maximum power. The maximum power is located at a period of between 2 and 3 minutes including also larger periods in the mid chromosphere of up to to minutes. The high chromospheric signatures, as seen with the Mg ii k3 amplitude (rightmost panel), show no power and only a weak response in the velocity power. As seen in the left panel mapping the amplitude in intensity, there is an increase visible in the amplitude which implies a change of the transition region height (Pereira et al., 2013). This could signify dissipation of the shock wave energy and local heating of the high chromosphere. Upward-propagating shock fronts are common in quiet Sun chromosphere, both in observations (Beck et al., 2008) and numerical simulations (Carlsson & Stein, 1997; Wedemeyer et al., 2004). We do not find a significant excess emission co-spatial with the chromospheric emission in the C ii 1335 Å line of IRIS, which is consistent with our finding that dissipation happens at the middle chromosphere.
4 Summary and conclusion
A magnetic element at the edge of an exploding granule is squeezed by opposing horizontal flows, resulting in an elongation of the isocontours in magnetic flux as seen with the Hinode SP, with a chromospheric response consequently being triggered and observed in the IRIS spectra. Signatures of an energy deposit in the middle chromosphere are seen through a wavelet analysis of different spectral features in the Mg ii h & k spectra. Our finding is consistent with an upward-propagating shock front triggered by the exploding granule.
Acknowledgements.
CEF has been funded by the DFG project Fi- 2059/1-1. NBG acknowledges financial support by the Senatsausschuss of the Leibniz-Gemeinschaft, Ref.-No. SAW-2012-KIS-5 within the CASSDA project. RR acknowledges financial support by the Spanish Ministry of Economy and Competitiveness through project AYA2014-60476-P. Wolfgang Schmidt has provided important and useful comments on the manuscript. Hinode is a Japanese mission developed and launched by ISAS/JAXA, collaborating with NAOJ as a domestic partner, NASA and STFC (UK) as international partners. IRIS is a NASA small explorer mission developed and operated by LMSAL with mission operations executed at NASA Ames Research center and major contributions to downlink communications funded by ESA and the Norwegian Space Centre.References
- Beck et al. (2008) Beck, C., Schmidt, W., Rezaei, R., & Rammacher, W. 2008, A&A, 479, 213
- Carlsson et al. (2015) Carlsson, M., Leenaarts, J., & De Pontieu, B. 2015, ApJ, 809, L30
- Carlsson & Stein (1997) Carlsson, M. & Stein, R. F. 1997, ApJ, 481, 500
- De Pontieu et al. (2014) De Pontieu, B., Title, A. M., Lemen, J. R., et al. 2014, Sol. Phys., 289, 2733
- Fisher & Welsch (2008) Fisher, G. H. & Welsch, B. T. 2008, ASP Conf. Ser., 383, 373
- Hirzberger et al. (1999) Hirzberger, J., Bonet, J. A., Vázquez, M., & Hanslmeier, A. 1999, ApJ, 527, 405
- Leenaarts et al. (2013) Leenaarts, J., Pereira, T. M. D., Carlsson, M., Uitenbroek, H., & De Pontieu, B. 2013, ApJ, 772, 90
- Lites & Ichimoto (2013) Lites, B. W. & Ichimoto, K. 2013, Sol. Phys., 283, 601
- Lites et al. (2008) Lites, B. W., Kubo, M., Socas-Navarro, H., et al. 2008, ApJ, 672, 1237
- Namba (1986) Namba, O. 1986, A&A, 161, 31
- Palacios et al. (2012) Palacios, J., Blanco Rodríguez, J., Vargas Domínguez, S., et al. 2012, A&A, 537, A21
- Pereira et al. (2015) Pereira, T. M. D., Carlsson, M., De Pontieu, B., & Hansteen, V. 2015, ApJ, 806, 14
- Pereira et al. (2013) Pereira, T. M. D., Leenaarts, J., De Pontieu, B., Carlsson, M., & Uitenbroek, H. 2013, ApJ, 778, 143
- Rast (1995) Rast, M. P. 1995, ApJ, 443, 863
- Rezaei (2017) Rezaei, R. 2017, ArXiv e-prints [arXiv:1701.04421]
- Roudier et al. (2001) Roudier, T., Eibe, M. T., Malherbe, J. M., et al. 2001, A&A, 368, 652
- Schmidt & Fisher (2013) Schmidt, W. & Fisher, J. 2013, A&A, 560, A50
- Tsuneta et al. (2008) Tsuneta, S., Ichimoto, K., Katsukawa, Y., et al. 2008, Sol. Phys., 249, 167
- Wedemeyer et al. (2004) Wedemeyer, S., Freytag, B., Steffen, M., Ludwig, H.-G., & Holweger, H. 2004, A&A, 414, 1121