font=small \SectionNumbersOn \alsoaffiliationInstitut für Physik, Humboldt-Universität zu Berlin, Newtonstr. 15, 12489 Berlin, Germany \alsoaffiliationMultifunctional Biomaterials for Medicine, Helmholtz Virtual Institute, Kantstr. 55, 14513 Teltow-Seehof, Germany \alsoaffiliationMultifunctional Biomaterials for Medicine, Helmholtz Virtual Institute, Kantstr. 55, 14513 Teltow-Seehof, Germany \alsoaffiliationInstitut für Chemie und Biochemie, Freie Universität Berlin, Takustr. 3, 14195 Berlin, Germany \alsoaffiliationInstitut für Chemie und Biochemie, Freie Universität Berlin, Takustr. 3, 14195 Berlin, Germany \alsoaffiliationInstitut für Physik, Humboldt-Universität zu Berlin, Newtonstr. 15, 12489 Berlin, Germany \alsoaffiliationMultifunctional Biomaterials for Medicine, Helmholtz Virtual Institute, Kantstr. 55, 14513 Teltow-Seehof, Germany \alsoaffiliationInstitut für Physik, Humboldt-Universität zu Berlin, Newtonstr. 15, 12489 Berlin, Germany \alsoaffiliationMultifunctional Biomaterials for Medicine, Helmholtz Virtual Institute, Kantstr. 55, 14513 Teltow-Seehof, Germany
Charged dendrimers revisited: Effective charge and surface potential of dendritic polyglycerol sulfate
Abstract
We investigate key electrostatic features of charged dendrimers at hand of the biomedically important dendritic polyglycerol sulfate (dPGS) macromolecule using multi-scale computer simulations and Zetasizer experiments. In our simulation study, we first develop an effective mesoscale Hamiltonian specific to dPGS based on input from all-atom, explicit-water simulations of dPGS of low generation. Employing this in coarse-grained, implicit-solvent/explicit-salt Langevin dynamics simulations, we then study dPGS structural and electrostatic properties up to the sixth generation. By systematically mapping then the calculated electrostatic potential onto the Debye-Hückel form – that serves as a basic defining equation for the effective charge – we determine well-defined effective net charges and corresponding radii, surface charge densities, and surface potentials of dPGS. The latter are found to be up to one order of magnitude smaller than the bare values and consistent with previously derived theories on charge renormalization and weak saturation for high dendrimer generations (charges). Finally, we find that the surface potential of the dendrimers estimated from the simulations compare very well with our new electrophoretic experiments.
![[Uncaptioned image]](/html/1706.00685/assets/x1.png)
1. Introduction
Charged dendritic macromolecules have attracted strong and broad interest from both academic and industrial researchers due to their versatile bioapplications, such as drug delivery, tissue engineering, and biological imaging 1, 2, 3. Recently, a high potential candidate for the use in future medical treatments has been identified based on dendritic polyglycerol sulfate (dPGS). 4 The latter has been found very efficient for the treatment of neurological disorders arising from inflammation 5, therapeutics for preventing the process of tissue damage 6, acting as delivery platform 7, 8, e.g., transporting to tumor cells, 9 and as imaging agent for the diagnosis of rheumatoid arthritis 8. Due to its charged terminal groups dPGS interacts mainly through electrostatics. The high anionic surface charge is therefore basis for dPGS’ high anti-inflammatory potential. 10, 11.
The important applications of dendrimeric macromolecules have initiated large efforts in their detailed microscopic characterization by theory and computer simulations 1, 3. While there is no simulation work yet in literature characterizing the basic structural features of dPGS, a large number of atomistic computer simulations, for example, of PAMAM [poly(amidoamine)]-based dendrimers have been performed. 12, 13, 14, 15, 16, 17 On the other hand, to overcome the limitation of the system size of atomistic simulations, coarse-grained (CG) monomer-resolved models with more or less inclusion of specific chemical features have led to plentiful structural insight 18, 19, 20, 21, 22, 23, 24, 25, 26, 27, 28, 29, 30, 31, 32, 33, 34, 35, 36, 37, 38, 39, 40, 41, 42, 43. For the case of (internally and surface) charged dendrimers, one focus has been set on the dominant role of condensed counterions and charge renormalization 44, 45, 46, 47, 48, 49, 50, 51 in modulating the conformation and effective charge of the dendrimers. 39, 40, 41, 42, 43
However, it has been hardly attempted to consistently calculate the effective surface potential (and its location) of charged dendrimers so far, despite its significance for electrostatic interactions. One reason could be that the identification of condensed counterions requires the definition of a cut-off region in space that contains condensed-types of ions distinct from those in the diffusive double layer, with highly varying definitions in the just cited literature. As a consequence, effective charges and the spatial delimitation of diffusive double-layer behavior have been inconsistently defined, hampering a meaningful comparison to analytical theory and experiments. Regarding specifically the calculation of surface potentials, one notable exception is the simulation report on charged PAMAM dendrimers that revealed a superlinear increase of the effective charge and the surface potential with generation number 17. In view of the theoretically predicted saturation (or at least very weak, sublinear increase) of the effective charge with bare charge for simple charged spheres 44, 45, 46, 47, 48, 49, 50, 51, this result, however, is unexpected and not well understood. In fact, in the case of carboxyl-terminated dendrimers capillary electrophoretic experiments demonstrated that higher generation dendrimers (generation 5) even have a smaller effective surface charge than lower generations (generation 2). 52 Hence, despite the large body of studies on charged dendrimers in the last two decades, key electrostatic features have not been yet consistently addressed.
Driven by the urgent need to develop accurate modeling tools and interpretation for the interactions between charged dendritic drugs that are predominantly of electrostatic nature, we here investigate dPGS with a particular focus on the determination of its electrostatic surface properties. Compared to the relatively large and steady growing number of experimental publications on dPGS, a deeper molecular characterization of dPGS is still lacking. Hence, in this paper, based on all-atom MD simulations, a CG model specific to dPGS is reported for its future modeling in biological environments (e.g., interacting with proteins or membranes). In particular, we introduce a simple but accurate scheme how to systematically calculate well-defined effective surface charges and potentials of charged dendrimers in the case of dPGS based on the most practical definition by mapping the calculated potentials directly to the Debye-Hückel potential in the far-field regime. We compare them to available theories and new experimental -potential measurements (also included in this contribution) with consistent outcome. Our study thus paves the way for future simulations and interpretations of the dPGS’ and related dendritic polyelectrolytes’ action in biological context (e.g., interacting with proteins or membranes) to understand and optimize their proven selective binding properties and efficacy in the medical treatment of inflammatory diseases.
2. Models and methods
2.1. All-atom model and explicit-water MD simulations
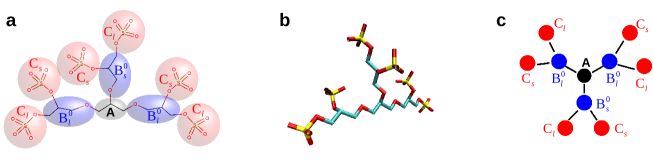
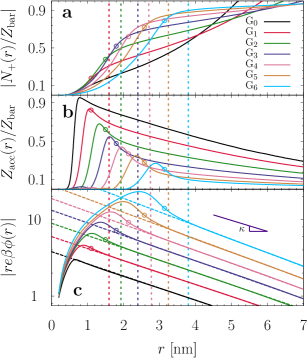
We start the development of the dPGS coarse-grained (CG) force–field from fully atomistic (explicit-water) MD simulations of dPGS of generations and 1 (i.e., G0 and G1) from which effective intra-bead potentials are derived. The constituting elements are the initiator core C3H5, repeating side chain units C3H5O, as well as the terminal sulfate groups, see the exemplary chemical structure of G0, in Fig. 1. All our simulations are carried out by the GROMACS 4.5.4 software package 53, where the GROMOS 45a3 force field 54 is applied. The latter is optimized to model lipids with long aliphatic chains or branches, which makes it an appropriate force field to model dPGS. The water is represented by the extended simple point charge (SPC/E) model 55. The partial charges of dPGS are calculated according to the Gaussian 09 software 56 with the cc-PVTZ DFT basis set and used here in combination with the GROMOS 45a3 force field. The assigned partial charges among the glycerol groups stay close to the re-optimized parameters for ethers. 57 And those for the sulfate group agree with recent work 58 which have been applied, for instance, in the simulation of sodium dodecyl sulfate micelles. 59 The calculations of partial charges of the dPGS atoms and the influence of their particular choices on the dendrimeric structure are summarized in the Supplementary Information (SI).
The initial configurations of G0 and G1-dPGS are constructed in vacuum with the program ChemDraw 60. A single dendrimer is then placed in the center of a cubic simulation cell with an initial side length nm with periodic boundary conditions in all three directions. The dendrimer is subsequently hydrated with 16543 water molecules. To preserve the overall charge neutrality of G0 and G1, six or twelve Na+-counterions are added, respectively. The electrostatic interactions are calculated via the Particle-Mesh-Ewald (PME) 61 summation where the long-range potential is evaluated in the reciprocal space using the Fast-Fourier Transform (FFT) with a grid spacing of nm and a cubic interpolation of fourth order. A cut-off radius of 1 nm is defined for both PME summation and van der Waals real-space interactions. After a 100 ns equilibration in the isobaric ensemble at conditions of bar and K, a production run of 1 s generates a working trajectory in a canonical simulation. We utilize the Berendsen thermostat and the Rahman-Parrinello barostat. To integrate Newton’s equation of motion we employ the leap-frog algorithm with a time step of 2 fs.
2.2. Coarse-graining procedure
For our CG model we now define three coarse-grained bead types A, B, and C, chosen to be located at the center-of-mass position of repeating units, cf. Fig. 1. While type A simply models the central core unit (C3H5), the natural choice for B and C is reflected in the chemical formula C3H5(C3H5S2O9)3 for G0-dPGS which defines the repeating units C3H5O as type B and the terminal group SO4 as monomer C. As one can see in the chemical structure in Fig. 1, the intra-bead potentials between B and C beads (as well as between B and B beads in higher generations) depend on how the corresponding atomistic groups are connected: in a given triplet of units around a connecting central hub unit, two units feature an extra bond so that it is needed to introduce ‘short’ and ‘long’ bead types B and C for intermediate branching cycles . In the following we therefore distinguish between B and B as well as Cs and Cl beads, respectively. Hence, for the coarse-grained force field we need to define bond potentials of types A-B, B-B, B-Cj, with and angle potentials for all relevant triplets, for example, A-B-B, B-B-B, B-B-B, B-B-Ck, etc. Note that there must be ’up-down’ symmetry in the potentials, e.g., B-B=B-B for the bond potentials and analogous rules for the angular potentials. Finally, non-bonded inter-bead interactions have to be defined between types A, B, and C.
We employ harmonic potentials for the intramolecular (bond and angular) interactions and use the Lennard-Jones (LJ) interaction for all inter-bead potentials. Additionally, the beads of type C and ions carry charges. Hence, the CG force field can be formally summarized by the CG Hamiltonian
| (1) | |||||
where is the bead–bead distance, and are the bond and angular spring constants, respectively, represents the distance between consecutive beads and is the equilibrium bond length. The variable refers to the angle formed by a triplet of consecutive beads and is the equilibrium value. Only the C bead, representing the terminal sulfate group, carries a bare Coulomb charge . It follows that the net charge valency for the CG dPGS molecule of generation is and thus the terminal beads number . The electrostatic interactions for all charged beads (type C and ions) are included in , via the Coulomb law
| (2) |
The variable () stands for the Bjerrum length, which is nm in this study at body temperature K and for water with a permittivity constant , denotes the number of ions, is the elementary charge, and is the permittivity of vacuum.
We derive the bonded potentials by Boltzmann–inverting the corresponding target spatial distribution functions of the beads we obtain from the atomistic MD simulation, via
| (3) |
where is either a bond length or angle variable and is an equilibrium average over the fluctuations of all identical groups in the dendrimer. All potentials involving beads A and C are derived from simulations of G0. All potentials involving beads only of type B are derived from simulations of G1 as B-B bonds are absent in G0. The results and final parameters of the bonded CG potentials are discussed and summarized in the next section.
The extraction of the non-bonded A-A, B-B and C-C potentials directly from the atomistic MD simulation of G0 or G1-dPGS is very difficult due to the convoluted spatial structure of the dendritic dPGS. Therefore, a mapping using the iterative Boltzmann inversion (IBI) scheme 62, 63 is out of reach. We therefore resort to the simplest approximation and perform explicit-water simulations of a one-component fluid of isolated A, B, and C monomers in explicit water, respectively, at relatively high dilution. The respective non-bonded pair potentials are then obtained by the simple Boltzmann–inversion according to Eq. (3), where then simply represents the radial distribution function. The charged sulfate monomers corresponding to subunit C are protonated to separate out approximately the electrostatic monopole repulsion which later in the CG simulation are added again. The partial charges of the A, B, C chemical subunits are calculated according to the Gaussian 09 software 56 with the cc-PVTZ DFT basis set, and used here in combination with the GROMOS 45a3 force field, see the data in the SI. We set the concentration of the one-component bead fluid to mM that is chosen high enough to obtain sufficient sampling and low enough to avoid large many-body effects and possibly aggregated states. After obtaining the LJ parameters and by fitting the LJ potentials to the obtained effective interaction (see next section) for the three subunits, A,B,C, the corresponding values for the cross interactions are obtained by the conventional Lorentz-Berthelot mixing rules, i.e., and .
The simple Boltzmann-inversion scheme for the inter-bead potentials that neglects many-body and connectivity effects is approximative. However, the excluded-volume part of the LJ is hardly affected by this treatment, only the attractive (van der Waals) part of the LJ interaction is expected to be affected by the many-body contributions. (Note that most CG simulations in the literature do not include the van der Waals attraction.) Therefore, we tested the influence of varying the bead on some of the key structural and electrostatic of the dendrimers. The results (presented in the SI) show hardly any influence on the results for dispersion variations in a reasonable window and therefore leave our results quantitatively essentially unchanged.
2.3. Coarse-grained potentials
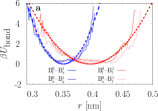
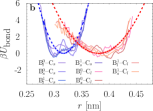
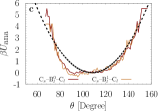
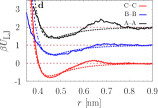
Selected results of our mapping procedure are plotted in Fig. 2. As we see in panels (a) to (c), the intra-bond potentials can be fitted well by a harmonic function. We find that the asymmetry in the glycerol repeat unit leads to an equilibrium bond length that differs if ‘short’ or ‘long’ beads are connected at the upper cycle branch . The shift between the bond lengths corresponds to a single covalent bond length on the Ångstrom scale. The structure asymmetry is also reflected in the angular potential (provided in the SI), although in that case the effect is less notable as compared to the bond potential. As shown in Fig. 2(c), the angle formed by a triplet of monomers C–B–C has a distribution ranging from to and is thus relatively broad when compared to typical atomistic potentials. Note that in all of the previous CG dendrimers models angular potentials were typically neglected. All bonded bead potentials are summarized in Table 1.
In Fig. 2(d), we present the non-bonded LJ potentials between pairwise groups A-A, B-B, and C-C. At small separation, nm, a strong repulsion demonstrates the excluded–volume interaction, while in the intermediate distance to 0.7 nm, a small energy barrier signifies effects of the first hydration shell around the beads. We neglect these small barriers and fit the curve via the LJ potentials, cf. the dashed lines in Fig. 2 (d). The final parameters for the CG and values for all three bead types are very similar. This can be seen as a justification to set a generic LJ potential for all CG beads as typically utilized in previous CG studies of monomer-resolved dendrimers 1, 30, 31, 33. We complement the CG force-field by effective potentials for a symmetric monovalent salt where, for simplicity, we chose the same LJ parameters as for the charged C bead. The corresponding LJ size for the ions is actually the same as for the effective CG sodium-chloride cross interaction in water 64, 65, so it seems a reasonable choice to model a simple monovalent salt. The relatively small energy parameter parameter of 0.1 kJ/mol models hard-sphere like ions without any strong ion pairing behavior. 65 The parameters for the non-bonded interaction are summarized in Table 2.
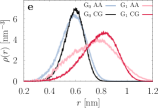
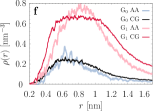
In order to further scrutinize the validity of the CG force field, we compare density profiles of the terminal sulfate groups, Fig. 2(e), and the cations, Fig. 2(f), extracted from atomistic and CG simulations (see next section for methods) of generation and 1. A good agreement is reached between the two approaches in both profiles for both generations, consolidating earlier conclusion on the validity of CG force field for charged dendrimers 42. For G1, we find that the width of the distribution of the terminal groups appears to be a bit narrower in the CG force field. Yet, the global structure represented by the location of the density peaks appears to be similar for both approaches. This similarity applies to the counterion distribution as well, indicated by the density peak at nm produced by both levels of modeling.
| group | ( nm-2) | (nm) | ( deg-2) | (deg) |
| A–B | 1381 | 0.380 | – | – |
| A–B | 5100 | 0.337 | – | – |
| B–B | 1052 | 0.395 | – | – |
| B–B | 3105 | 0.351 | – | – |
| B–Cl | 1633 | 0.380 | – | – |
| B–Cs | 6160 | 0.312 | – | – |
| B–A– B | – | – | 0.003 | 115 |
| B–B–A | – | – | 0.003 | 115 |
| Bs,l–Bs,l–Bs,l | – | – | 0.003 | 115 |
| Cs,l–B–B | – | – | 0.003 | 121 |
| Cs,l–B–A | – | – | 0.003 | 121 |
| Cs – B– Cl | – | – | 0.005 | 108 |
| group | (nm) | (T) |
|---|---|---|
| A | 0.41 | 0.60 |
| B | 0.41 | 0.53 |
| C | 0.40 | 0.70 |
| cation | 0.40 | 0.10 |
| anion | 0.40 | 0.10 |
2.4. Coarse-grained simulations
Having established a CG force field, all generations of dPGS can be now readily constructed. Higher generations Gn with index are created by iteratively bonding two extra glycerol units to the original one (dendritic segment) on the outer shell of generation Gn-1. This Cayley tree-like 66 structure gives an exponentially growing of the polymerization with its generation index , which thereby leads to the sulfate group number and the gross number of the CG segments. Note the above structure only fits to a perfect dendrimer, whereas an imperfect dendrimer bears a small number of linear segments that corresponds to most experimental dPGS realizations 10. In our work we investigate seven different generations up to , depicted and with some features summarized in Table 4.
For the CG simulations the dPGS macromolecules are placed in a cubic box with a side length of nm with periodic boundary conditions in all three directions. We treat the solvent implicitly via a uniform dielectric background, however, ions are treated explicitly to account for ionic correlation effects. In view of the charge status of dPGS, a number of monovalent counterions, , is added to maintain an electroneutral system. Apart from the counterions, in all simulations, dPGS is immersed in a salt solution with to 5140 pairs of monovalent cations and anions, resulting into bulk salt concentrations from mM to 200 mM. The initial dendrimer configuration is assembled according to the equilibrium bond length and angle appeared in Eq. (1).
We perform Langevin dynamics simulations on CG dPGS of generation number ranging from 0 to 6 also using the GROMACS package. All the implicit water simulations used the second-order stochastic dynamics (SD) integrator in GROMACS with the friction in the Langevin equation set with a time constant of ps and integration time of 2 fs. We set all CG beads to have a small mass of amu to decrease inertial effects and lower the intrinsic viscosity (i.e., internal relaxation time) of the dPGS. Equilibrium properties, as investigated in this work, are not affected by any reasonable mass choices as long as the simulations are ergodic. With an increasing number of the terminal beads the electrostatic interaction becomes more profound and the cut-off radius for the PME summation and short-range van der Waals interactions is extended to nm as compared to the above atomistic simulation. The choice of the cutoff is verified by reference simulations with increased cutoff value nm. Unless specifically stated otherwise, the temperature was set to 310 K as the default. The static dielectric constant of the solvent is at this temperature. After energy minimization of the initial structure and a 1 ns equilibration period, the production run of a simulation lasts around 60 ns. That time has been proven to be sufficient for equilibrium sampling for all generations as in detail verified in the SI by scrutinizing relaxation times and time unit scalings between all-atom and CG simulations.
2.5. Analysis of the CG simulations
2.5.1 dPGS radius of gyration and asphericity
The size of a dendrimer can be characterized by the radius of gyration which is defined as the trace of the gyration tensor () 29
| (4) |
where is the coordinate of the th segment and is the dPGS COM position along the direction. The square of the radius of gyration is then
| (5) |
where is the th eigenvalue of the gyration tensor, representing the characteristic length of the equivalent ellipsoid which mimics the dendrimer. stands for the ensemble average. The degree of asphericity of dPGS is defined in terms of the eigenvalue , which can be written as
| (6) |
with and . Fot a perfect sphere equals 0, whereas corresponds to the extreme of an infinitely thin rod.
2.5.2 The radial electrostatic potential
The electrostatic potential is available through the framework of Poisson’s equation
| (7) |
where in our CG system , and are the distance–resolved radial density profiles for all charged species, namely cations, anions and sulfate (C) beads, respectively. We integrate Poisson’s equation numerically feeding in the generated from simulation to obtain the local electrostatic potential . In addition to the potential profile, we calculate the running coordination number of charged beads of type :
| (8) |
Since dPGS is negatively charged, explicitly represents for the number of counterions located in a distance away from the dPGS COM. It follows that the total accumulated charge is
| (9) |
which gives the accumulated dPGS charge deduced from the structural one by adding the ionic shell.
For the definition of the effective charge of a dendrimer (and thus the effective surface potential) we take the basic Debye-Hückel (DH) theory for the radial electrostatic potential distribution around a charged sphere with radius and valency as reference 47,
| (10) |
where is the elementary charge and is the inverse Debye length for a symmetric, monovalent salt. This solution is derived with the Dirichlet boundary condition, i.e., fixing the surface potential and the one far away . The DH potential usually works well in the region far from the colloid, where nonlinear effects, such as ion–ion correlations and condensation, become irrelevant. For the “correlated Stern layer” at the interface of the charged sphere, the electrostatic potential is expected to deviate strongly from the DH potential and all nonlinear effects are adsorbed into the effective charge (as, e.g., based on solutions of the full non-linear Poisson-Boltzmann theory 44, 45, 46, 47, 48). By taking the logarithm of eq. (10) and mapping directly on the far-field behavior of the electrostatic decay calculated in the simulation, the double-layer behavior can be quantified with high accuracy. 67 This provides also the basis to define the position of the Stern layer, or better expressed, the exact location of the interface between the diffusive double layer in the DH sense and the correlated condensed ion layers. The effective surface potential is then simply .
2.6. Experimental Materials and Methods
| Label | G2 | G4 | G4.5 | G5.5 |
|---|---|---|---|---|
| [kD] | 2 | 7 | 10 | 20 |
| PDI | 1.7 | 1.7 | 1.5 | 1.2 |
| DS [%] | 100 | 100 | 99 | 98 |
| 28 | 102 | 135 | 266 | |
| [kD] | 5 | 18 | 24 | 47 |
| [mV] | -47.71 | -58.46 | -58.73 | -70.9 |
Dendritic polyglycerol (dPG) was synthesized by anionic ring opening polymerization of glycidol 68. Gel permeation chromatography (GPC) is empolyed to measure the number averaged molecular weight of the core and Polydispersity index (PDI). Afterwards dPGS was prepared by the sulfation of dPG with SO3-pyridine complex in dimethylformamide (DMF) according to reported procedure 69. The degree of sulfation (DS) was determined by elemental analysis. Properties of dPGS in different generations are summarized in Tab. 3.
Size and -potential (electrophoretic mobility) measurements were performed with a Zetasizer Nano ZS instrument (ZEN 3500, Malvern Instruments, Herrenberg, Germany) equipped with a 18 mW He-Ne laser (=633 nm). The molecule size was measured by dynamic light scattering (DLS) in UV-transparent disposable cuvettes (VWR, Germany) at a back scattering angle of 173∘. The compounds were dissolved in 10 mM MOPS buffer (adding NaCl to adjust ionic strength to 10 mM) pH 7.4 at concentration of 1 mg/ml and were filtered through 0.8 m polyethersulfone syringe filter (PALL, USA). Prior to measurement, each sample was equilibrated for 2 min at 37∘ and measured with 10 scans each lasting for 10 s. The stated values for the hydrodynamic diameter are the mean of three independent measurements. The electrophoretic mobility was measured at 5 mg/ml in the same buffer as above also in three independent measurements (with all values reported in the SI). The solutions were filtered through 0.2 m polyethersulfone syringe filter and equilibrated for 10 min at 37∘ in folded DTS 1060 capillary cells (Malvern, UK). The shown data for the -potential in the resulting figure are based on the Henry function with the Ohshima approximation
| (11) |
with for the conversion of mobilities to potentals 70. The following reported -potential are the mean of the three independent measurements.
3. Results and Discussion
3.1. Size, sphericity and molecular density distributions
|
|
|
|
|
|
|
|
|
|---|---|---|---|---|---|---|---|
| Label | G0 | G1 | G2 | G3 | G4 | G5 | G6 |
| MW [KDa] | 0.79 | 1.72 | 4.10 | 8.32 | 16.77 | 33.67 | 68.00 |
| 10 | 22 | 46 | 94 | 190 | 382 | 766 | |
| 6 | 12 | 24 | 48 | 96 | 192 | 384 | |
| [] | -6 | -12 | -24 | -48 | -96 | -192 | -384 |
| [nm] | 0.52 | 0.71 | 0.92 | 1.16 | 1.43 | 1.76 | 2.17 |
| [nm] | 0.65 | 0.83 | 1.10 | 1.35 | 1.65 | 2.05 | 2.55 |
| [/nm-2] | -1.28 | -1.34 | -1.58 | -2.10 | -2.81 | -3.64 | -4.70 |
| [nm] | 0.7 | 1.6 | 1.9 | 2.4 | 2.8 | 3.3 | 3.8 |
| [] | -6.0 | -7.3 | -10.6 | -14.3 | -18.7 | -24.5 | -32.9 |
| [/nm-2] | -0.97 | -0.23 | -0.23 | -0.20 | -0.19 | -0.18 | -0.18 |
| [] | -4.20 | -2.12 | -2.37 | -2.22 | -2.28 | -2.25 | -2.40 |
| [nm] | – | 1.1 | 1.5 | 1.8 | 2.1 | 2.6 | 3.1 |
| [] | – | -9.9 | -14.9 | -22.9 | -37.5 | -52.2 | -85.8 |
| [/nm-2] | – | -0.65 | -0.53 | -0.56 | -0.68 | -0.62 | -0.71 |
3.1.1 Radius of gyration and asphericity
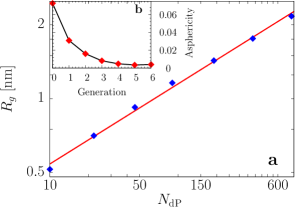
The radius of gyration of the dPGS macromolecules as a function of generation is summarized in Table 4. We find that increases from nm to nm from G0 to G6. A linear behavior is revealed in a log–log plot of in terms of the total number of the CG segments, , in Fig 3(a). Hence, the dPGS size follows the scaling law , where we find the scaling exponent if we fit all generations, while it decreases slightly to if we only fit through the larger generations to , cf. Fig 3(a). Such a scaling close to 1/3 is fully consistent with the now well established ’dense-core’ picture of dendrimers, where details, however, can depend on the particular dendrimer architecture, see the deeper discussions in exemplary previous work. 1, 3, 37, 41.
In Fig 3(b), we plot the asphericity versus the generation number. For all inspected generations we find values lower than , which suggests an almost perfect spherical shape for dPGS molecules. Larger generations show higher sphericity, very likely due to a more homogeneous distribution of the larger number of closer packed beads and a thus higher compactness. We show snapshots of the CG dendrimers for all investigated generations G0 to G6 in Table 4.
3.1.2 Density distributions and ‘intrinsic’ radius
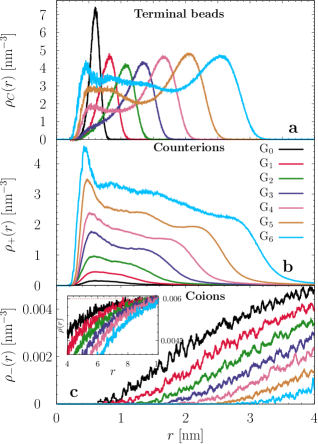
Figure 4 shows the radial density distributions of selected components with respect to the distance to the dendrimer core bead. Fig 4(a) shows the distribution of the terminal sulfate beads. For the smaller generations , we find a single-peaked distribution, corresponding to the picture that most of the charged terminal beads stay on the molecular surface 30, 31, 39, 41. For the larger generations, however, a bimodal distribution signified by a small peak at nm appears, indicating a small number of dendrons backfolding toward the dendrimer core. (Better visible in density plots re-scaled to refer to the position of the sulfate peak, see the SI.) The backfolding effect was already detected for other terminally-charged CG dendrimer models 30, 31, 39, 41 contributing to a dense-core in contrast to a dense-shell arrangement. 1 An ‘intrinsic’ dPGS radius can be roughly deduced from the location of maximum density of the terminal groups. As implied in Fig. 4(a), we find a dPGS radius nm for generation G0 increasing to nm for generation G6. All values are summarized in Table 4.
The radial density of the cations, shown in Fig. 4(b), is found to have qualitatively the expected response to the distribution of terminal beads and follows roughly the sulfate distribution. In particular, for all generations decreases as expected in an exponential (Yukawa or DH-like) fashion to the bulk concentration for large distances. For closer distances, highly nonlinear effects are visible, e.g., in the response to the backfolding of the terminal beads we observe the enrichment of cations at nm inside the dPGS, corresponding to the lower sulfate peaks close to the core in Fig. 4(a). On the contrary and as expected, coions are repelled by the dPGS due to the electrostatic repulsion.
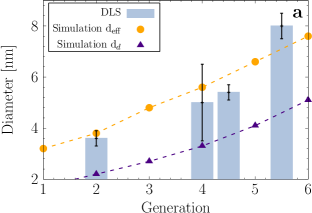
In Fig 5(a), we plot the hydrodynamic diameter measured via Zetasizer experiments of generation 2, 4, 4.5 and 5.5, respectively. As expected it increases with the molecular weight. A comparison to the dPGS size estimated from the sulfate peak in Fig. 4(a) from the simulation, , shows not a good agreement, probably because the correlated solvation layer, i.e., the Stern layer, is relatively thick and reaches out further into the bulk. The analysis in the next section, where an effective dPGS radius based on the ionic charge distribution is calculated, fully supports this conjecture.
3.2. Electrostatic properties of dPGS
3.2.1 Electrostatic potential, charge renormalization and effective ‘charge’ radius
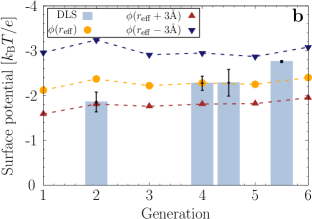
From the ionic density profiles we can now in detail investigate local charge accumulation and electrostatic potential distributions. The accumulated number of counterions and the locally total accumulated dPGS charge (i.e., the local effective charge according to Eq. (9)) are presented in Fig 6(a) and Fig 6(b), respectively. It is found that both and increase sharply with distance from the dPGS core due to the rising accumulation of charged beads. While naturally rises, jumps to a maximum at a distance and drops gradually. At this distance, a large portion of the sulfate charges are neutralized by counterions. As implied by Fig 6(b), we find for instance that more than 70 of the charges at for G6 are compensated by bound counterions. This charge renormalization effect has been extensively studied at hand of simple charged spheres with smooth surfaces, and theories for the effective charge and size have been developed 47, 51, 44, 48, 50. One important outcome is that one can define the critical location for counterion-condensation in terms of the inflection point in a plot of as a function of the inverse radial distance 47, 51. The equation leads to the inflection radius, , within ions are deemed condensed. We marked by circle symbols for all generations in Fig 6. Note that is larger than and could be used to read off an effective charge size and charge of the macromolecule.
A more practical concept to define an effective size and charge is to quantitatively map the double-layer decay of the potential onto the basic DH-theory, Eq. (10). Fig. 6(c) plots the rescaled potential versus distance in a log–linear scale. For the potential far away a homogeneously charged sphere, the DH potential with a renormalized charge should apply, yielding an exponential decay attributed to the electrostatic screening. The plot indeed shows the expected linear decay at large separations unambiguously for all presented dPGS with a slope as expected to be close to the standard inverse DH length nm-1 for the salt concentration mM. In detail, we find slopes of to monotonically increase with from nm-1 to nm-1. That slight increase is due to the increasing number of counterions in the finite system which also contribute to screening. In contrast to the simple exponential decay at large separations, for smaller distances the potential term climbs up quickly with decreasing distance to a maximum before it decays to almost vanishing potential close to the dPGS core. This highly nonlinear behavior is expected from the high electrostatic and steric correlations between sulfate beads and counterions in this dense Stern layer.
As indicated by Fig. 6(c), the potential can now be naturally divided into two parts: a DH-regime , where the DH potential describes correctly the potential, and a non-DH regime , where a non-monotonic and highly non-exponential behavior is revealed. In that sense, now acts as a measure of the dPGS effective radius at which we can attain an effective dPGS charge 47 (see also the SI). We depict the position of the DH radius by vertical dashed lines in Fig 6. We list and in the Table 4 for generations 0 to 6. We find an increase of both and with dPGS generation index and substantial charge renormalization effects. For instance, the bare charge for G6–dPGS is (still presents at a radius , cf. Fig. 5(b)) is effectively renormalized to at large distances . An exception is G0 in which case we find and hardly any renormalization by condensed counterions takes places. In agreement, the accumulated counterions profile for G0 in Fig 6(a) reveals DH behavior almost in the full range of and no inflection radius could be identified.
Note that both and can in principle be taken as definition for the effective size and charge of the charge-renormalized sphere. Although the difference between them appears not so large in Fig. 6, still a significant charge renormalization happens in between as the gradient at is relatively large, i.e., there is a marked density decrease of the counterions from distance to . In the following, we base our analysis only on as we believe that the inflection point criterion holds only for more idealized systems (smooth surfaces, no salt). The procedure to obtain rests on the assumption that we can treat the dPGS as simple DH spheres, so it exactly serves our purpose. Interestingly, a comparison of the corresponding effective diameter, to the size measured in the Zetasizer experiments in Fig 5(a) shows satisfying agreement. This demonstrates that the thickness of the correlated Stern layer in our simulation is of reasonable size and resembles the size of the bound solvation layer revealed by the experiments.
3.2.2 Effective surface charge density and potential
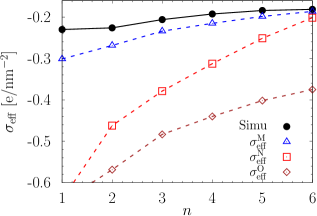
Considering the intrinsic radius and the DH radius , the estimates of and lead to the dPGS bare surface charge density and effective surface charge density , respectively. Numbers are also summarized in Table 4. We find a monotonic decrease on with generation , in response to the growing number of the surface beads. (The small portion of backfolding terminal beads increasing with generation decreases the surface charge valency slightly but not significant). Due to the large counterion-binding and charge renormalization effect, the effective charge density is about one order of magnitude smaller than the bare one. Interestingly, it virtually remains constant, even slightly decreases from nm-2 for G1 to a saturated value nm-2 for G5 and G6. Experiments of carboxyl-terminated dendrimers at much larger than the (i.e., almost full ionization) also found higher effective charge densities of a lower generation G2 than for G5 52.
The results for the effective surface charge can be compared to available theories of charge renormalization of highly charged spheres, typically valid in low or high salt limits. Early approaches are based on approximate solutions of the nonlinear Poisson-Boltzmann equation for isolated spheres at infinite dilution, e.g., improvements of the now classical Ohshima potential 44 lead to 48
| (12) |
and should be valid for large , i.e., large spheres and/or high screening by salt. In the framework of standard counterion-condensation theory, Manning later derived a different but related expression for the saturation surface charge density of an isolated sphere in the same regime () as 50
| (13) |
In the other limit (), Netz et al. 49 instead provide an estimate on the effective charge density explicitly dependent on the bare charge valency, , by means of variational techniques, via
| (14) |
For our dPGS systems, intermediate values are established, for which an accurate analytical description apparently is difficult to achieve. We plot in terms of generation number , together with and in Fig. 7. We find that simulation and theory both yield the same trend, i.e., the absolute effective surface charge density decreases with generation . Given the enormous charge renormalization effects of about one order of magnitude, the agreement to all theories is actually satisfactory, especially for the Manning theory. The relative error with respect to the magnitude of the bare surface charge is thus less than 10%. Based on this empirical comparison, the Manning approach can thus serve as a simple and analytical extrapolation to other systems and experiments.
Correspondingly, we define the dPGS surface potential , also summarized in Table 4. Similarly as the effective surface charge the surface potential is staying relatively constant with generation number. An inspection and comparison to -potentials derived from our electrophoretic mobility experiments is made in Fig 5(b). Recall that the shear plane, where the -potential is located, should lie beyond the Stern layer which refers to a position very close to where our effective surface potential is in the simulation 71, 72. Indeed, as we see in Fig 5(b), reproduces the experimental -potential very well at all generations. The sources of the remaining deviations can be of various origin, e.g., missing explicit water contributions to the electrostatic potential in the CG simulations or simply the lack of the exact knowledge of the shear plane. If, for instance, we assume an up- or down-shift of the location of the shear plane only about one solvation layer, say to be nm, the experimental range is well matched, cf. Fig 5(b). Note also that in the experiments not directly the potential is measured but the electrophoretic mobility (presented in the SI) and their conversion is based on idealized models 73, 52.
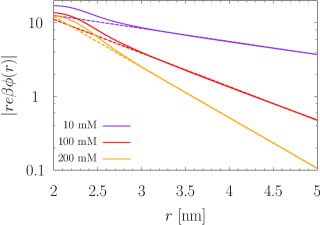
We finally inspect the dependence of the effective dPGS radius and charge density on the salt concentration. We plot the radial electrostatic potential for G5-dPGS under three salt concentrations mM, 100 mM, and 200 mM in Fig. 8. As one can see the exponential regime for large distances survives for all cases. Interestingly, a similar nm is found with hardly any dependence on the salt concentration. The effective surface charge density goes down from /nm-2 (10 mM) to /nm-2 (100 mM) and /nm-2 at 200 mM. Eq. (12) predicts an opposite trend than that and than Eqs. (13) and (14). The latter two treatments consistently point to the generic screening effect leading to a smaller surface potential for higher salt concentrations.
4. Conclusions
In summary, we have investigated the electrostatic (surface) properties of highly charged dendrimers for various generations at hand of the biomedically important dPGS polyelectrolyte. We have defined an effective charge, effective surface charge and potential of dPGS for various generations and salt concentrations by a direct mapping procedure of the calculated electrostatic potentials onto the long-range Debye-Hückel-like electrostatic decay which defines the effective charge in its most practical level. The dPGS effective radius is accordingly addressed as a distance separating double-layer and condensation regimes and therefore gives the dPGS effective charge without ambiguity. Evidently, with that procedure the effective charge and the surface potential and their trends with generation can be consistently described by counterion-condensation theory and show very good agreement with new experimental -potential measurements as well.
In future, our model can be easily applied to dPGS-involved intermolecular interaction studies in biological context (e.g., binding to proteins or membranes), quantifying electrostatic interactions, in particular counterion-release effects on binding 74, 75, 76. Those studies could serve as important references to guide experiments and optimize dPG-based particles as a potent anti-inflammatory drug in
biomedical applications. In particular, the strength of specific counterion binding and condensation has significant influence on binding affinity of dPGS or other charge-functionalized polyglycerol-based dendrimers, such a carboxylated or phosphorylated dPG 77, 78.
Xiao Xu thanks the Chinese Scholar Council for financial support. The authors acknowledge fruitful discussions with Rohit Nikam and Rafael Roa Chamorro.
References
- Ballauff and Likos 2004 Ballauff, M.; Likos, C. N. Dendrimers in Solution: Insight from Theory and Simulation. Angew. Chem., Int. Ed. 2004, 43, 2998
- Lee et al. 2005 Lee, C. C.; MacKay, J. A.; Fréchet, J. M.; Szoka, F. C. Designing dendrimers for biological applications. Nature Biotechnology 2005, 23, 1517–1526
- Tian and Ma 2013 Tian, W.; Ma, Y. Theoretical and computational studies of dendrimers as delivery vectors. Chem. Soc. Rev. 2013, 42, 705
- Khandare et al. 2012 Khandare, J.; Calderón, M.; Dagiaa, N. M.; Haag, R. Multifunctional dendritic polymers in nanomedicine: opportunities and challenges. Chem. Soc. Rev. 2012, 41, 2824
- Maysinger et al. 2015 Maysinger, D.; Gröger, D.; Lake, A.; Licha, K.; Weinhart, M.; Chang, P. K.-Y.; Mulvey, R.; Haag, R.; McKinney, R. A. Dendritic Polyglycerol Sulfate Inhibits Microglial Activation and Reduces Hippocampal CA1 Dendritic Spine Morphology Deficits. Biomacromolecules 2015, 16, 3073–3082
- Reimann et al. 2015 Reimann, S.; Gröger, D.; Kühne, C.; Riese, S. B.; Dernedde, J.; Haag, R. Shell Cleavable Dendritic Polyglycerol Sulfates Show High Anti-Inflammatory Properties by Inhibiting L-Selectin Binding and Complement Activation. Adv. Healthcare Mater 2015, 4, 2154–2162
- Gröger et al. 2013 Gröger, D.; Paulus, F.; Licha, K.; Welker, P.; Weinhart, M.; Holzhausen, C.; Mundhenk, L.; Gruber, A. D.; Abram, U.; Haag, R. Synthesis and Biological Evaluation of Radio and Dye Labeled Amino Functionalized Dendritic Polyglycerol Sulfates as Multivalent Anti-Inflammatory Compounds. Bioconjug. Chem. 2013, 24, 1507–1514
- Vonnemann et al. 2014 Vonnemann, J.; Beziere, N.; Böttcher, C.; Riese, S. B.; Kuehne, C.; Dernedde, J.; Licha, K.; von Schacky, C.; Kosanke, Y.; Kimm, M.; Meier, R.; Ntziachristos, V.; Haag, R. Polyglycerolsulfate Functionalized Gold Nanorods as Optoacoustic Signal Nanoamplifiers for In Vivo Bioimaging of Rheumatoid Arthritis. Theranostics 2014, 4, 629–641
- Sousa-Herves et al. 2015 Sousa-Herves, A.; Würfel, P.; Wegner, N.; Khandare, J.; Licha, K.; Haag, R.; Welker, P.; Calderón, M. Dendritic polyglycerol sulfate as a novel platform for paclitaxel delivery: pitfalls of ester linkage. Nanoscale 2015, 7, 3923–3932
- Dernedde et al. 2010 Dernedde, J.; Rausch, A.; Weinhart, M.; Enders, S.; Tauber, R.; Licha, K.; Schirner, M.; Zügel, U.; von Bonin, A.; Haag, R. Dendritic polyglycerol sulfates as multivalent inhibitors of inflammation. Proc. Natl. Acad. Sci. U. S. A. 2010, 107, 19679–19684
- Hoshino et al. 2014 Hoshino, Y.; Lee, H.; Miura, Y. Interaction between synthetic particles and biomacromolecules: fundamental study of nonspecific interaction and design of nanoparticles that recognize target molecules. Polym. J. 2014, 46, 537
- Maiti et al. 2004 Maiti, P. K.; Cagin, T.; Wang, G.; Goddard, W. A. Structure of PAMAM Dendrimers: Generations 1 through 11. Macromolecules 2004, 37, 6236
- Naylor et al. 1989 Naylor, A. M.; Goddard, W. A.; Kiefer, G. E.; Tomalia, D. A. Starburst dendrimers. 5. Molecular shape control. J. Am. Chem. Soc. 1989, 111, 2339–2341
- Lee et al. 2002 Lee, I.; Athey, B. D.; Wetzel, A. W.; Meixner, W.; James R. Baker, J. Structural molecular dynamics studies on polyamidoamine dendrimers for a therapeutic application: effects of pH and generation. Macromolecules 2002, 35, 4510–4520
- Han et al. 2005 Han, M.; Chen, P.; Yang, X. Molecular dynamics simulation of PAMAM dendrimer in aqueous solution. Polymer 2005, 10, 3481
- Maiti et al. 2005 Maiti, P. K.; Cagin, T. T.; Lin, S.-T.; Goddard, W. A. Effect of Solvent and pH on the Structure of PAMAM Dendrimers. Macromolecules 2005, 38, 979–991
- Maiti and Messina 2008 Maiti, P. K.; Messina, R. Counterion Distribution and -Potential in PAMAM Dendrimer. Macromolecules 2008, 41, 5002
- Muratt and Grest 1996 Murat, M.; Grest, G. S. Molecular Dynamics Study of Dendrimer Molecules in Solvents of Varying Quality. Macromolecules 1996, 29, 1278
- Welch and Muthukumar 1998 Welch, P.; Muthukumar, M. Tuning the Density Profile of Dendritic Polyelectrolytes. Macromolecules 1998, 31, 5892
- Lyulin et al. 2004 Lyulin, S. V.; Evers, L. J.; van der Schoot, P.; Darinskii, A. A.; Lyulin, A. V.; Michels, M. A. J. Effect of Solvent Quality and Electrostatic Interactions on Size and Structure of Dendrimers. Brownian Dynamics Simulation and Mean-Field Theory. Macromolecules 2004, 37, 3049–3063
- Lyulin et al. 2004 Lyulin, S. V.; Darinskii, A. A.; Lyulin, A. V.; Michels, M. A. J. Computer Simulation of the Dynamics of Neutral and Charged Dendrimers. Macromolecules 2004, 37, 4676–4685
- Giupponi and Buzza 2004 Giupponi, G.; Buzza, D. M. A. Monte Carlo simulation of dendrimers in variable solvent quality. J. Chem. Phys. 2004, 120, 10290
- Lee and Larson 2006 Lee, H.; Larson, R. G. Molecular Dynamics Simulations of PAMAM Dendrimer-Induced Pore Formation in DPPC Bilayers with a Coarse-Grained Model. J. Phys. Chem. B 2006, 110, 18204–18211
- Lee and Larson 2008 Lee, H.; Larson, R. G. Coarse-grained molecular dynamics studies of the concentration and size dependence of fifth- and seventh-generation PAMAM dendrimers on pore formation in DMPC bilayer. J. Phys. Chem. B 2008, 112, 7778–7784
- Lee and Larson 2009 Lee, H.; Larson, R. G. A molecular dynamics study of the structure and inter-particle interactions of polyethylene glycol-conjugated PAMAM dendrimers. J. Phys. Chem. B 2009, 113, 13202–13207
- Chong et al. 2016 Chong, L.; Aydin, F.; Dutt, M. Implicit solvent coarse-grained model of polyamidoamine dendrimers: Role of generation and pH. J. Comput. Chem. 2016, 37, 920–926
- Gurtovenko et al. 2006 Gurtovenko, A. A.; Lyulin, S. V.; Karttunen, M.; llpo Vattulainen, Molecular dynamics study of charged dendrimers in salt-free solution: Effect of counterions. J. Chem. Phys. 2006, 124, 094904
- Blaak et al. 2008 Blaak, R.; Lehmann, S.; Likos, C. N. Charge-Induced Conformational Changes of Dendrimers. Macromolecules 2008, 41, 4452–4458
- Carbone and Lue 2010 Carbone, P.; Lue, L. Prediction of Bulk Density and Molecular Packing in Model Dendrimers with Different Chain Stiffness. Macromolecules 2010, 43, 9191–9197
- Huißmann et al. 2010 Huißmann, S.; Wynveen, A.; Likos, C. N.; Blaak, R. The effects of pH, salt and bond stiffness on charged dendrimers. J. Phys.: Condens. Matter 2010, 22, 232101
- Huißmann et al. 2010 Huißmann, S.; Wynveen, A.; Likos, C. N.; Blaak, R. Conformations of high-generation dendritic polyelectrolytes. J. Mat. Chem. 2010, 20, 10486–10494
- Tian and Ma 2012 Tian, W.; Ma, Y. pH-responsive dendrimers interacting with lipid membranes. Soft Matter 2012, 8, 2627
- Das and Hsiao 2014 Das, A. K.; Hsiao, P.-Y. Charged Dendrimers in Trivalent Salt Solutions under the Action of DC Electric Fields. J. Phys. Chem. B 2014, 118, 6265–6276
- Welch and Muthukumar 2000 Welch, P.; Muthukumar, M. Dendrimer-Polyelectrolyte Complexation: A Model Guest-Host System. Macromolecules 2000, 33, 6159
- Lenz et al. 2012 Lenz, D. A.; Blaak, R.; Likos, C. N. Structural properties of dendrimer-colloid mixtures. J. Phys.: Condens. Matter 2012, 24, 284119
- Kłos and Sommer 2009 Kłos, J. S.; Sommer, J.-U. Properties of Dendrimers with Flexible Spacer-Chains: A Monte Carlo Study. Macromolecules 2009, 42, 4878
- Maiti et al. 2009 Maiti, P. K.; Li, Y.; Cagin, T.; Goddard, W. A. Structure of polyamidoamide dendrimers up to limiting generations: A mesoscale description. J. Chem. Phys. 2009, 130, 144902
- Tian and Ma 2011 Tian, W.; Ma, Y. Coarse-grained molecular simulation of interacting dendrimers. Soft Matter 2011, 7, 500
- Kłos and Sommer 2010 Kłos, J. S.; Sommer, J.-U. Simulations of Terminally Charged Dendrimers with Flexible Spacer Chains and Explicit Counterions. Macromolecules 2010, 43, 4418–4427
- Kłos and Sommer 2011 Kłos, J. S.; Sommer, J.-U. Monte Carlo simulations of charged dendrimer-linear polyelectrolyte complexes and explicit counterions. J. Chem. Phys. 2011, 134, 204902
- Kłos and Sommer 2013 Kłos, J. S.; Sommer, J.-U. Simulations of Neutral and Charged Dendrimers in Solvents of Varying Quality. Macromolecules 2013, 46, 3107–3117
- Huißmann et al. 2012 Huißmann, S.; Likos, C. N.; Blaak, R. Explicit vs Implicit Water Simulations of Charged Dendrimers. Macromolecules 2012, 45, 2562
- Tian and Ma 2010 Tian, W.; Ma, Y. Effects of valences of salt ions at various concentrations on charged dendrimers. Soft Matter 2010, 6, 1308
- Ohshima et al. 1982 Ohshima, H.; Healy, T. W.; White, L. R. Accurate analytic expressions for the surface charge density/surface potential relationship and double-layer potential distribution for a spherical colloidal particle. J. Colloid Interface Sci. 1982, 90, 17–26
- Alexander et al. 1983 Alexander, S.; Chaikin, P. M.; Grant, P.; Morales, G. J.; Pincus, P. Charge renormalization, osmostic pressure, and bulk modulus of colloidal crystals: Theory. J. Chem. Phys. 1983, 80, 5776
- Ramanathan 1988 Ramanathan, G. V. Counterion condensation in micellar and colloidal solutions. J. Chem. Phys. 1988, 88, 3887
- Belloni 1998 Belloni, L. Ionic condensation and charge renormalization in colloidal suspensions. Colloids Surf., A 1998, 140, 227–243
- Bocquet et al. 2002 Bocquet, L.; Trizac, E.; Aubouy, M. Effective charge saturation in colloidal suspensions. J. Chem. Phys. 2002, 117, 8138
- Netz and Orland 2003 Netz, R.; Orland, H. Variational charge renormalization in charged systems. Eur. Phys. J. E 2003, 11, 301
- Manning 2007 Manning, G. S. Counterion Condensation on Charged Spheres, Cylinders, and Planes. J. Phys. Chem. B 2007, 111, 8554–8559
- Gillespie et al. 2014 Gillespie, D. A. J.; Hallett, J. E.; Elujoba, O.; Hamzah, A. F. C.; Richardson, R. M.; Bartlett, P. Counterion condensation on spheres in the salt-free limit. Soft Matter 2014, 10, 566–577
- Huang et al. 2000 Huang, Q. R.; Dubin, P. L.; Moorefield, C. N.; Newkome, G. R. Counterion Binding on Charged Spheres: Effect of pH and Ionic Strength on the Mobility of Carboxyl-Terminated Dendrimers. J. Phys. Chem. B 2000, 104, 898–904
- Hess et al. 2008 Hess, B.; Kutzner, C.; van der Spoel, D.; Lindahl, E. GROMACS 4: Algorithms for Highly Efficient, Load-Balanced, and Scalable Molecular Simulation. J. Chem. Theory Comput. 2008, 4, 435–447
- Schuler et al. 2001 Schuler, L. D.; Daura, X.; van Gunsteren, W. F. An improved GROMOS96 force field for aliphatic hydrocarbons in the condensed phase. J. Comput. Chem. 2001, 22, 1205–128
- Berendsen et al. 1987 Berendsen, H. J. C.; Grigera, J. R.; Straatsma, T. P. The missing term in effective pair potentials. J. Phys. Chem. 1987, 91, 6269–6271
- Frisch 2009 Frisch, M. J. e. a. Gaussian 09 Revision D.01. 2009; Gaussian Inc. Wallingford CT 2009
- Horta et al. 2011 Horta, B. A. C.; Fuchs, P. F. J.; van Gunsteren, W. F.; Hünenberger, P. H. New Interaction Parameters for Oxygen Compounds in the GROMOS Force Field: Improved Pure-Liquid and Solvation Properties for Alcohols, Ethers, Aldehydes, Ketones, Carboxylic Acids, and Esters. J. Chem. Theory Comput. 2011, 7, 1016–1031
- Jozica 2013 Jozica, D. GROMOS Developer. Private Communication 2013,
- Tang et al. 2014 Tang, X.; Koenig, P. H.; Larson, R. G. Molecular Dynamics Simulations of Sodium Dodecyl Sulfate Micelles in Water - The Effect of the Force Field. J. Phys. Chem. B 2014, 118, 3864–3880
- Evans 2014 Evans, D. A. History of the Harvard ChemDraw Project. Angew. Chem., Int. Ed. 2014, 53, 11140
- Essmann et al. 1995 Essmann, U.; Perera, L.; Berkowitz, M. L.; Darden, T.; Lee, H.; Pedersen, L. G. A smooth particle mesh Ewald method. J. Chem. Phys. 1995, 103, 8577
- Müller-Plathe 2002 Müller-Plathe, F. Coarse-graining in polymer simulation: from the atomistic to the mesoscopic scale and back. ChemPhysChem 2002, 3, 754
- Reith et al. 2003 Reith, D.; Pütz, M.; Müller-Plathe, F. Deriving effective mesoscale potentials from atomistic simulations. J. Comput. Chem. 2003, 24, 1624
- Smith and Dang 1993 Smith, D. E.; Dang, L. X. Computer simulations of NaCI association in polarizable water. J. Chem. Phys. 1993, 100, 3757
- Kalcher et al. 2010 Kalcher, I.; Schulz, J. C. F.; Dzubiella, J. Electrolytes in a nanometer slab-confinement: Ion-specific structure and solvation forces. J. Chem. Phys. 2010, 133, 164511
- Voit 1995 Voit, B. I. Dendritic polymers: from aesthetic macromolecules to commercially interesting materials. Acta Polym. 1995, 46, 87–99
- Kalcher and Dzubiella 2009 Kalcher, I.; Dzubiella, J. Structure - thermodynamics relation of electrolyte solutions. J. Chem. Phys. 2009, 130, 134507
- Sunder et al. 1999 Sunder, A.; Hanselmann, R.; Frey, H.; Mülhaupt, R. Controlled synthesis of hyperbranched polyglycerols by ring-opening multibranching polymerization. Macromolecules 1999, 32, 4240–4246
- Türk et al. 2004 Türk, H.; Haag, R.; Alban, S. Dendritic polyglycerol sulfates as new heparin analogues and potent inhibitors of the complement system. Bioconjugate chemistry 2004, 15, 162–167
- Ohshima 1994 Ohshima, H. Electrophoretic mobility of soft particles. J Colloid Interface Sci 1994, 163, 474–483
- Lyklema 1995 Lyklema, J. Fundamentals of interface and colloid science: vol. II, Solid-liquid interfaces; Academic Press, London, 1995
- Ahualli et al. 2016 Ahualli, S.; Delgado, Á. V.; Carrique, F.; Jiménez, M. L. AC Electrokinetics of Concentrated Suspensions of Soft and Hairy Nanoparticles: Model and Experiments; John Wiley & Sons, Inc., 2016
- Hunter 2001 Hunter, R. J. Foundations of Colloid Science; Oxford University Press, Oxford, 2001
- Yu et al. 2015 Yu, S.; Xu, X.; , C.; van der Giet, M.; Zidek, W.; Jankowski, J.; Dzubiella, J.; Ballauff, M. Interaction of human serum albumin with short polyelectrolytes: a study by calorimetry and computer simulations. Soft Matter 2015, 11, 4630–4639
- Yigit et al. 2015 Yigit, C.; Heyda, J.; Ballauff, M.; Dzubiella, J. Like-charged protein-polyelectrolyte complexation driven by charge patches. J. Chem. Phys. 2015, 143, 064905
- Yigit et al. 2016 Yigit, C.; Kanduc, M.; Ballauff, M.; Dzubiella, J. Interaction of charged patchy protein models with like-charged polyelectrolyte brushes. Langmuir 2016, 33, 417–427
- Weinhart et al. 2011 Weinhart, M.; Gröger, D.; Enders, S.; Dernedde, J.; Haag, R. Synthesis of Dendritic Polyglycerol Anions and Their Efficiency Toward L-Selectin Inhibition. Biomacromolecules 2011, 12, 2502–2511
- Weinhart et al. 2011 Weinhart, M.; Gröger, D.; Enders, S.; Riese, S. B.; Dernedde, J.; Kainthan, R. K.; Brooks, D. E.; Haag, R. The Role of Dimension in Multivalent Binding Events: Structure-Activity Relationship of Dendritic Polyglycerol Sulfate Binding to L-Selectin in Correlation with Size and Surface Charge Density. Macromol. Biosci. 2011, 11, 1088–1098