Urban Dreams of Migrants: A Case Study of Migrant Integration in Shanghai
Abstract
Unprecedented human mobility has driven the rapid urbanization around the world. In China, the fraction of population dwelling in cities increased from 17.9% to 52.6% between 1978 and 2012. Such large-scale migration poses challenges for policymakers and important questions for researchers.
To investigate the process of migrant integration, we employ a one-month complete dataset of telecommunication metadata in Shanghai with 54 million users and 698 million call logs. We find systematic differences between locals and migrants in their mobile communication networks and geographical locations. For instance, migrants have more diverse contacts and move around the city with a larger radius than locals after they settle down. By distinguishing new migrants (who recently moved to Shanghai) from settled migrants (who have been in Shanghai for a while), we demonstrate the integration process of new migrants in their first three weeks. Moreover, we formulate classification problems to predict whether a person is a migrant. Our classifier is able to achieve an F1-score of 0.82 when distinguishing settled migrants from locals, but it remains challenging to identify new migrants because of class imbalance. This classification setup holds promise for identifying new migrants who will successfully integrate into locals (new migrants that misclassified as locals).
1 Introduction
More than half of the world’s population are now living in urban areas (?). This rapid urbanization process involves a continuous flow of migrants into the cities. For example, the number of migrants now live in China is 236 million, 17% of the country’s entire population (?). These migrants play an important role in a city’s rapid development by strengthening its political and economic status and bringing diverse cultures to the city (?). However, great challenges arise because of the fast rate of migration. Policymakers need to address a multitude of issues regarding migrants in modern cities, including environment, land, labor, segregation, and social inequality (?; ?; ?; ?). It is thus an important research question to understand how migrants integrate into a city.
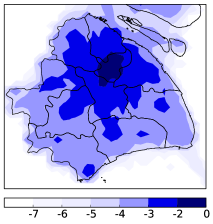
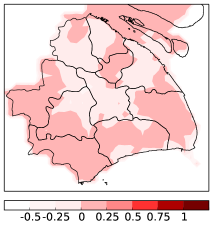
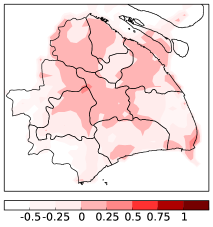
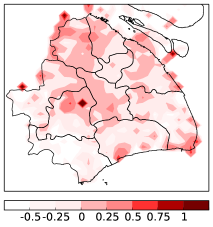
In this work, we are interested in two central components of migrant integration: the locations where a migrant lives and moves around, and people that a migrant interacts with and befriend. First, because cities are divided into neighborhoods with varying characteristics, there may exist systematic differences between locals and migrants in where they live. For example, Fig. 1 shows the geographical distributions of locals and migrants compared to the overall average in Shanghai. Somewhat surprisingly, locals are more active in the periphery of the city, whereas migrants relatively concentrate in the center of Shanghai. This observation echoes previous findings that existing residents flee from central cities, known as “white flight” (?). It yet remains an open question how migrants’ active areas evolve as they integrate into the city.
Another important aspect of migrant integration is how migrants establish their personal connections. As humans are social animals, whether a migrant can successfully develop a personal network is crucial in her integration process (?). In particular, ? show that migrant-resident ties are significantly associated with migrant integration (?). However, it remains unclear how a migrant makes initial friends and then gradually build a personal network in a new city. It is also unknown what characteristics differentiate the social networks of migrants from those of locals.
In order to investigate the above two aspects, we conduct a case study of Shanghai, one of the biggest cities in China, and present the first large-scale quantitative exploration of migrant integration. We employ a one-month complete dataset of telecommunication metadata from China Telecom,111China Telecom Corporation is a Chinese state-owned telecommunication company and the third largest mobile service providers in China. which contains 698 million call logs between 54 million mobile users in Shanghai. To identify a comparison point of migrants, we define locals as the persons that were born in Shanghai, the counterpart of migrants. As migrants may undergo different stages in their integration, we further differentiate migrants that have been in a new city for a while, settled migrants, from migrants that recently moved to a new city, new migrants (Section 2).
First, we explore how locals, settled migrants, and new migrants differ in their mobile communication networks and geographical locations in Section 3. We find interesting differences between these three groups. For instance, in terms of communication networks, a substantial fraction of new migrants’ contacts are fellow townsmen, people who were born in the same province. This pattern suggests that townsmen are essential for new migrants to build their initial personal networks in a new city. Surprisingly, settled migrants have an even higher fraction of townsman contacts, indicating that they may have grown their townsman network as they stay longer in Shanghai. In terms of locations, in addition to the differences in Fig. 1, we find that settled migrants tend to have a larger radius.
| Feature | Description |
| Demographics of user ’s friends in | |
| similar-age | The fraction of ’s friends that are at similar ages with ( years). |
| same-sex | The fraction of ’s friends having the same sex with . |
| local | The fraction of ’s friends who were born in Shanghai. |
| townsmen | The fraction of ’s friends that were born in the same province with but not in Shanghai. |
| Ego-network characteristics of user in | |
| degree | The number of ’s unique contacts. |
| weighted degree | The number of calls makes. |
| neighbor degree | The average degree of ’s contacts. |
| CC | Local clustering coefficient of , i.e., , where and are ’s friends, and is ’s degree. |
| Call behavior in | |
| call duration | ’s average call duration. |
| duration variance | variance of ’s call duration. |
| province diversity | Entropy of the birth provinces distribution among ’s contacts, , where is the probability that ’s contact was born in province . |
| reciprocal call | The probability that ’s contacts also call in week . |
| Geographical features of at week | |
| center | The latitude and longitude of a user ’s center of mass , . |
| max radius | The maximal distance of from her center of mass, i.e., . |
| average radius | The average distance of from her center of mass, i.e., . |
| moving distance | The total distance that moves, i.e., . |
| average distance | The average distance that moves, i.e., . |
Second, we use the calling logs over different time periods to give a brief dynamic view of the integration process in Section 4. Despite the short time span, we observe that new migrants become increasingly similar to settled migrants in most characteristics, while features of settled migrants and locals tend to be stable over time. This contrast suggests that the features that we employ can indeed reflect the integration process to some extent. Meanwhile, we observe that the integration slows down in the final week. One possible explanation is that not all new migrants eventually become settled migrants and the slow integration is due to the ones that encounter difficulty fitting into the city. This hypothesis is worth further investigation.
Finally, we formulate prediction tasks to distinguish migrants from locals in Section 5. Using the features that we propose, we are able to build a classifier that significantly outperforms the baselines and achieve an F1-score of on predicting settled migrants, indicating that it is not a difficult prediction task to separate settled migrants from locals. We also observe that if we apply this classifier to new migrants, an increasing fraction of new migrants is classified as locals over time. However, it remains challenging to identify new migrants because the number of new migrants is very small compared to settled migrants and locals.
2 Experimental Setup
In this section, we introduce our dataset and the framework that we use to study mobile communication networks and geographical information of locals and migrants.
2.1 Dataset
Our dataset contains complete telecommunication records between mobile users using China Telecom in Shanghai, spanning a month from September 3rd, 2016, to September 30th, 2016 (four weeks). The data is provided by China Telecom, the third largest mobile service provider in China. Our dataset consists of about 54 million users and 698 million call logs between them. A call log was recorded as long as it was made in Shanghai and either the caller or the callee was a user of China Telecom (some of the 54 million users use other mobile services). Each call log contains the caller’s number, the callee’s number, the starting time, and the ending time. Since personal identification is required to obtain a mobile number, we are able to retrieve personal attributes, including age, sex, and birthplace, for users of China Telecom that opened their accounts in Shanghai.222We obtain a person’s birthplace based on the personal identity card number. Moreover, we can differentiate local numbers in Shanghai from numbers in other regions and getting a local number is a first step in the migrant integration process due to long-distance costs. In addition, we have the GPS location of the corresponding telecommunications tower used during the call for users of China Telecom, which roughly approximates the locations of them. Our dataset was anonymized by China Telecom for privacy concerns. Throughout the paper, we report only average statistics without revealing any identifiable information of individuals.
2.2 Framework
We categorize users in our dataset into three groups based on their birthplaces and this categorization constitutes the basis for our computational framework. We refer to people that were born in Shanghai as locals. The rest people who were not born in Shanghai are migrants. To assess different stages of migrant integration, we separate migrants that have no call logs in the first week (new migrants), from migrants that have at least one call log in the first week (settled migrants). We further require each local and settled migrant to have call logs at every week, and each new migrant to have call logs at each of the last three weeks, to make sure that these users lived in Shanghai during our four-week span. We filtered around users that have abnormally high degrees, who likely corresponded to fraudsters, delivery persons, or customer services according to a user type list provided by China Telecom. In the end, we have 1.7M locals, 1.0M settled migrants, and 22K new migrants.
One concern is that new migrants in our dataset are simply temporal visitors to Shanghai. However, obtaining a phone number is nontrivial and requires personal identification in China, so it is uncommon for a temporary visitor to obtain a local number.
Mobile communication networks. One core component of our study is a weekly mobile communication network based on the call logs. Grouping by weeks allows us to account for variations between weekdays and weekends. Formally, we build a directed graph for each week (), where is the set of users, and each directed edge indicates that calls (). Note that only a subset of users in are labeled as locals, settled migrants or new migrants (in total around 3 million users). This subset is the focus of our study.
Geographical locations. Another component is the geographical locations that a person is active at. Specifically, for each call a person makes, we have access to the GPS location from the corresponding telecommunications tower. We use each week as a window and collect all the locations that a person makes calls in that week, and refer to this ordered list of locations for user at week as , where contains the latitude and the longitude. We have geographical locations for the subset of users with labels since they are all users of China Telecom by definition.
We will computationally characterize these two components using features in Section 3.
3 Locals, Settled Migrants, New Migrants
To understand how locals, settled migrants and new migrants differ from each other, we examine a wide range of features from people’s mobile communication networks and geographical locations. To observe the initial state of urban migrants without much integration, we use the data from the first week after new migrants joined China Telecom (week 2) in this section. We will focus on the integration process in Section 4, in which we also show that most features do not change for locals and settled migrants in future weeks. Table 1 provides an overview of the features that we consider. Demographics of users’ friends,333Note that although we do not have demographics information for users using other service providers, we have demographics information for a much larger set than the ones labeled locals, settled migrants or new migrants because we require these three groups to be active in each week. ego-networks features, and call behavior derive from the mobile communication networks, while geographical features come from location information. In the following, we will explain the motivation and related theories of each feature.
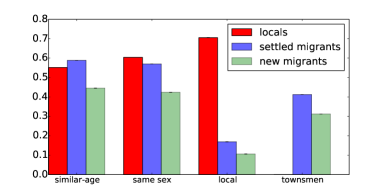
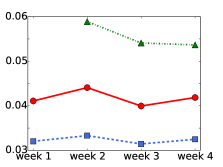
Demographics of contacts (Fig. 2(a)). A person’s mobile communication network can reasonably approximate her social network. Locals likely maintain very different social networks from migrants since they have grown up in this city. Also, as a person settle down in a new city, her social network may change dramatically. Existing studies suggest that kin relationships play an important role in determining the destination of migration (?) and relationship with locals are crucial for migrant integration (?). We look at the demographics of contacts in age, sex, and birthplaces.
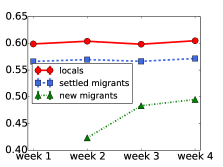
Homophily in sex and age. It is well recognized that people tend to make friends with those who are similar to themselves, also known as homophily (?). We observe interesting contrasts regarding homophily of age and sex. Locals show the strongest homophily in sex, i.e., locals have the largest fraction of contacts with the same sex. Surprisingly, in terms of the absolute fraction, new migrants have more contacts with a different sex than with the same sex (only around 40%). In contrast, locals are less likely to have contacts at similar ages than settled migrants, but more than new migrants.
Birthplaces. The most striking difference lies in that 70% of a local’s contacts are also locals. This number is much lower for settled migrants, and the lowest for new migrants.
Townsmen, people who share the same hometown (exclude Shanghai), are an important component of a new migrant’s initial network (30% of new migrants’ contacts are townsmen). This observation echoes existing findings regarding kin relationships. In comparison, settled migrants have an even higher fraction of townsmen in their contacts, which suggests that new migrants get to know more people from the same hometown as they integrate into a city. These observations are consistent with homophily, but they also indicate that urban migrants maintain a relatively separate personal network from locals.
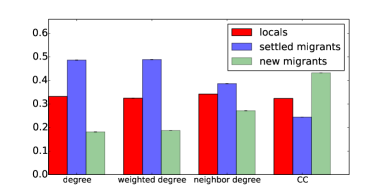
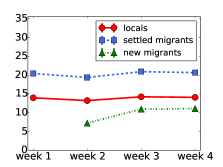
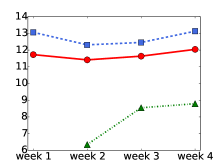
Ego-network characteristics (Fig. 2(b)). As expected, new migrants have the smallest degree and weighted degree. However, settled migrants tend to have the largest degree, larger than locals. This indicates an interesting transition that migrants may undergo. Maybe because of homophily, neighbors of settled migrants also have the largest average degree, and neighbors of new migrants have the smallest degree.
Clustering coefficient measures the fraction of triangles in the ego-networks. It roughly reflects how connected a person’s contacts are to each other. Interestingly, new migrants present the largest clustering coefficient, while settled migrants have the lowest. It may suggest that new migrants start with a close-knit group when they move to a big city like Shanghai. Connecting with our previous observations, this close-knit group tend to come from the same province as the new migrants. It is worth noting that this could also relate to that new migrants have the smallest ego-networks.
| new migrants move towards settled migrants and both move towards locals | |||
| new migrants move towards locals initially, but will likely eventually move away from locals | |||
| new migrants move towards settled migrants but away from locals | |||
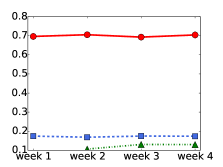

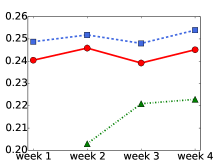
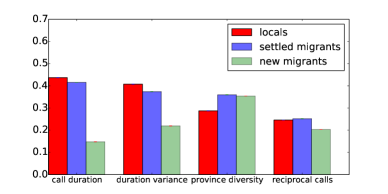
Calling behavior (Fig. 2(c)). The duration of calls reflects the nature of relations between a person and her contacts. Calls of long duration likely involve intimate relations or are driven by substantial businesses, while calls of short duration tend to be quick check-ins or relate to small incidences. We find that locals and settled migrants have similar levels of average call duration, much larger than new migrants. Similar trends show up in the variance of call duration.
Regarding the diversity of provinces in a person’s contacts, settled migrants have the most diverse group of contacts, while locals have the lowest. This pattern resonates with previous observations that locals have about 70% of contacts that are also locals.
Finally, we find that locals and settled migrants are more likely to have reciprocal relationships with their contacts, while the fraction of reciprocal calls is the lowest for new migrants. This again shows that the personal networks of new migrants are still nascent. Note that the difference is much less dramatic than that in call duration.
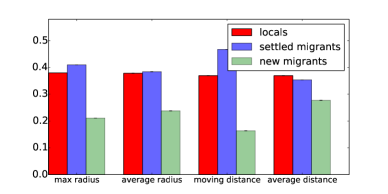
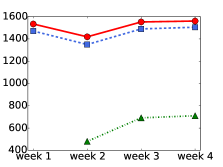
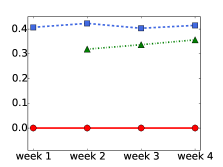
Geographical patterns (Fig. 2(d)). The mobility of people in different groups can be reflected by their locations over time. As we have discussed in the introduction, both settled migrants and new migrants tend to move around the central part of Shanghai, while locals are more disproportionally frequent in the periphery. Regarding the radius of a person’s movement around her own center, we observe that settled migrants have the largest radius both in terms of max radius and average radius. This suggests that although new migrants start with a smaller active area than locals, settled migrants move in an even larger area than locals.
Total moving distance is correlated with the total number of calls that a person makes. We thus discover the same ordering as in weighted degree. However, locals tend to move the most distance between calls on average, while new migrants move the shortest distance. This further suggests that new migrants have a smaller active area than locals.
Summary. Comparing settled migrants to locals, we observe that settled migrants have more active and diverse behavior patterns both in mobile communication networks and in geographical movements. Meanwhile, new migrants present different characteristics from both settled migrants and locals. This suggests that new migrants go through significant changes in their communication networks and geographical locations as they slowly settle down.
4 Integration of New Migrants
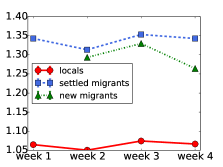
Given the differences between locals, settled migrants and new migrants that we have observed, we now investigate the integration process of new migrants. Since a subset of new migrants eventually become settled migrants, we hypothesize that the features of new migrants will grow more similar to those of settled migrants in week 3 and week 4. Indeed, we find that new migrants are slowly “becoming” settled migrants in most features. Fig. 3 presents how some features of locals, settled migrants and new migrants change over the four weeks (new migrants only moved to Shanghai in week 2). Although existing studies have argued that different generations of migrants can exhibit different characteristics (?; ?), our observation shows that the features that we propose are robust to generation differences, or Shanghai is too young a city to observe generation gaps from telecommunication records.
The more interesting comparison is with locals. One possible way to evaluate migrant integration is whether they become more similar to locals over time. Depending on how the features of locals compare to new migrants and settled migrants, we can observe several possible trajectories as shown in Table 2.
An ideal integration process suggests that new migrants become more similar to locals, and settled migrants represent a middle state in this process, i.e., the orderings should follow or , and we should observe that the features of new migrants move towards settled migrants in week 3 and week 4. Some features indeed show consistent trajectories with this ideal integration process, including fraction of same-sex contacts, fraction of local contacts, call duration, duration variance, and average moving distance. It makes sense that migrants are probably never going to match locals in the fraction of local contacts, but such matching may happen in average moving distance and call duration.
However, for the majority of features, we observe that although new migrants initially move towards locals, they may eventually become further away from locals after settling down. These features include degree, weighted degree, average degree of neighbors, clustering coefficient, fraction of friends with similar age, fraction of reciprocal calls, max radius, average radius, total moving distance. In particular, all features in ego-network characteristics follow this trajectory, suggesting that new migrants eventually build quite different communication networks from locals.
It is rare that new migrants do not move towards locals at all but become more different from locals in the integration process. This only happens in province diversity and townsmen.444It is tricky for townsmen, since locals do not have townsmen that are not from Shanghai and always have 0 in this feature. Both features point to the fact that new migrants start with a more diverse communication network in terms of birthplaces than locals, and their networks get even more diverse over their stay in Shanghai. Note that there is a decline in province diversity for new migrants in week 4 but they are still closer to settled migrants than to locals.
| , | New migrants are moving towards locals and settled migrants are in the middle of this process. |
| , | New migrants move towards locals initially, but eventually move away from them and remain different from locals after they settle down. |
| , | Settled migrants and locals are different, and new migrants never move towards locals. |
Interestingly, in some features, we observe that the integration slows down or converges in week 4 for new migrants. This is likely due to the fact that not all new migrants are going to become settled migrants. As a result, we can already see that the integration process stops or slows down in week 4 for a subset of these people.
Discussion. Overall, we find that new migrants are settling down and gradually becoming settled migrants, and this observation is robust with potential generation gaps. However, in a substantial fraction of the features, although new migrants are temporarily moving towards locals, they are probably going to become different from locals as settled migrants do. In other words, despite settling down, settled migrants remain fairly different from locals.
5 Distinguishing Migrants from Locals
We set up two prediction tasks to assess the difficulty of distinguishing migrants from locals with the features that we propose. Since the number of new migrants is much smaller compared to settled migrants and locals (22K vs. 1.0M and 1.7M), we employ two formulations in this section. First, we propose a binary classification task to distinguish settled migrants from locals. We then apply this binary classifier to new migrants to evaluate how often a new migrant would be mistakenly considered as a local. This misclassification rate can reflect how well new migrants have integrated, at least in terms of fooling our classifier. Second, we work on the more challenging three-way classification problem to identify new migrants, settled migrants, and locals.
Experiment setup. In both prediction tasks, each instance consists of features based on a user’s calling logs within one week. We randomly draw of users and use their calling logs in week 2 to train the classifier. The remaining data is used to test the classifier ( of data in week 2, and of data in week 3 and week 4). In particular, we use all features listed in Table 1 except “townsmen”, as measuring the fraction of townsmen relies on the user’s label (the user’s birthplace). We use precision, recall, and F1-score for evaluation, with the minority class (i.e., migrants) as the target class. For the classifier, we use -regularized logistic regression. We choose the best penalty coefficient using 5-fold cross-validation in training data.
5.1 Settled Migrants vs. Locals
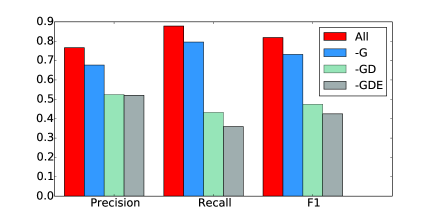
Prediction performance (Fig. 4(a)). It turns out to be relatively easy to distinguish settled migrants from locals. We can achieve an F1-score of 0.82 with all the features that we propose. We further analyze the contribution of each type of features by removing them one by one. In the first removal step, we find that geographical features were the most influential feature set, i.e., F1 drops the most (0.11) if we remove geographical features (-G). Demographics is the most important in the second step (-GD). In the third step, removing ego-network features is the choice, leaving us with a classifier that only uses call behavior (-GDE). F1 drops almost 50% after removing these three types of features. In addition, the prediction performance of the classifier is robust over time: F1-scores on each week vary little (0.0007).
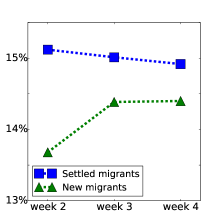
Integration of new migrants (Fig. 4(b)). One way to evaluate the integration of new migrants is to measure how often this binary classifier would mistakenly classify a new migrant as a local. We present the fraction of misclassified locals among settled migrants as a comparison point. Overall, settled migrants are more likely to be misclassified as locals than new migrants (e.g., 15.2% vs 13.6% in week 2). However, we observe an increasing trend for new migrants over the three weeks. In week 3, the misclassified fraction of new migrants increases to 14.4%, suggesting that they become more similar to locals over time. The growth slows down in week 4, which is consistent with our findings in Section 4. To our surprise, the faction of settled migrants misclassified as locals slightly decreases over time. This suggests that some settled migrants could have stopped integrating with locals after settling down, but build their own communities and keep their own lifestyles instead.
5.2 Identifying New Migrants
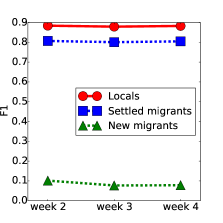
The three-way classification problem is challenging due to the relatively small number of new migrants (about of all instances). The classifier only achieves an F1-score of on identifying new migrants and this performance drops over time, while the performance on settled migrants and locals remains similar to the binary classification task (Fig. 4(c)). We find that more new migrants are classified as settled migrants or locals incorrectly by the classifier over time. This is consistent with the observation that new migrants are becoming similar to settled migrants or locals in most characteristics despite the short time span, while settled migrants and locals tend to stay constant.
6 Related Work
Migrant integration is a well-recognized research question in many disciplines. Most relevant to our work is the study of urban migration (?; ?; ?; ?; ?; ?; ?; ?; ?). In addition to the effect of nation-states and demographics (ethnic groups, rural vs. urban) on urban migrant integration, Schiller et al. argue that the role of migrants in the cities depends on the rescaling of the cities themselves (?). Government policy and agenda-setting also play an important role in the integration process (?). Beyond our scope, immigrants (migrants to a new country) and refugees (a subgroup of immigrants) have also received significant interests (?; ?; ?; ?; ?). Our work is also related to data-driven studies related to cities, urban computing (?; ?; ?; ?; ?; ?; ?; ?).
7 Concluding Discussions
We present the first large-scale study on migrant integration based on telecommunication metadata. By studying the differences between locals, settled migrants, and new migrants, we demonstrate the evolution of a migrant’s communication network and geographical locations in the integration process. Migrants are indeed approaching locals in most characteristics despite the short time span.
We further formulate prediction problems to distinguish migrants from locals. A classifier based on the features that we propose can achieve an F1-score of around 0.82 on settled migrants. This confirms that migrants are still fairly different from locals in their behavior patterns, supporting studies on the segregation of migrants. Meanwhile, we also observe that a larger fraction of new migrants is classified as locals over time, partly documenting the integration process.
We hope that our study can encourage more researchers in our community to examine the problem of migrant integration from different perspectives and eventually lead to methodologies and applications that benefit policymaking and millions of migrants.
Acknowledgements. We sincerely thank China Telecom for providing the data. The work is supported by the Fundamental Research Funds for the Central Universities, 973 Program (2015CB352302), NSFC (U1611461, 61625107), and key program of Zhejiang Province (2015C01027). Tan was partly supported by a University of Washington Innovation Award.
References
- [Afridi, Li, and Ren 2015] Afridi, F.; Li, S. X.; and Ren, Y. 2015. Social identity and inequality: The impact of China’s hukou system. Journal of Public Economics 123:17–29.
- [Bai, Shi, and Liu 2014] Bai, X.; Shi, P.; and Liu, Y. a. 2014. Society: Realizing China’s urban dream. Nature News 509(7499):158.
- [Bean and Stevens 2003] Bean, F. D., and Stevens, G. 2003. America’s Newcomers and the Dynamics of Diversity. Russell Sage Foundation.
- [Becker and Coyle 2011] Becker, G. S., and Coyle, D. 2011. The challenge of immigration: a radical solution. Institute of Economic Affairs Monographs Occasional Paper (145).
- [Brockerhoff 1995] Brockerhoff, M. 1995. Child survival in big cities: the disadvantages of migrants. Social Science & Medicine 40(10):1371–1383.
- [Brown and Moore 1970] Brown, L. A., and Moore, E. G. 1970. The intra-urban migration process: a perspective. Geografiska Annaler. Series B, Human Geography 52(1):1–13.
- [Chiswick and DebBurman 2004] Chiswick, B. R., and DebBurman, N. 2004. Educational attainment: analysis by immigrant generation. Economics of Education Review 23(4):361–379.
- [Dredze et al. 2016] Dredze, M.; García-Herranz, M.; Rutherford, A.; and Mann, G. 2016. Twitter as a source of global mobility patterns for social good. CoRR abs/1606.06343.
- [Fischer 1982] Fischer, C. S. 1982. To dwell among friends : personal networks in town and city. Chicago: University of Chicago Press.
- [Frey 1979] Frey, W. H. 1979. Central city white flight: Racial and nonracial causes. American Sociological Review 425–448.
- [Glaeser and Mare 2001] Glaeser, E. L., and Mare, D. C. 2001. Cities and skills. Journal of labor economics 19(2):316–342.
- [Goodburn 2009] Goodburn, C. 2009. Learning from migrant education: A case study of the schooling of rural migrant children in Beijing. International Journal of Educational Development 29(5):495–504.
- [Gurak and Caces 1992] Gurak, D. T., and Caces, F. 1992. Migration networks and the shaping of migration systems. International migration systems: A global approach 150–176.
- [Hristova et al. 2016] Hristova, D.; Williams, M. J.; Musolesi, M.; Panzarasa, P.; and Mascolo, C. 2016. Measuring Urban Social Diversity Using Interconnected Geo-Social Networks. In Proceedings of WWW.
- [Jacobsen and Landau 2003] Jacobsen, K., and Landau, L. B. 2003. The dual imperative in refugee research: some methodological and ethical considerations in social science research on forced migration. Disasters 27(3):185–206.
- [Jiang et al. 2013] Jiang, S.; Fiore, G. A.; Yang, Y.; Ferreira Jr, J.; Frazzoli, E.; and González, M. C. 2013. A review of urban computing for mobile phone traces: current methods, challenges and opportunities. In Proceedings of the 2nd ACM SIGKDD international workshop on Urban Computing.
- [Lee 2015] Lee, J. J. 2015. World migration report 2015: Migrants and Cities: New Partnerships to manage mobility.
- [Lin 2013] Lin, L. 2013. Chinese migrants struggle to find urban dream. http://chinadialogue.org.cn/article/show/single/en/6426.
- [Liu, Li, and Breitung 2012] Liu, Y.; Li, Z.; and Breitung, W. 2012. The social networks of new-generation migrants in China’s urbanized villages: A case study of Guangzhou. Habitat International 36(1):192–200.
- [McPherson, Smith-Lovin, and Cook 2001] McPherson, M.; Smith-Lovin, L.; and Cook, J. M. 2001. Birds of a feather: Homophily in social networks. Annual review of sociology 27(1):415–444.
- [Nations 2014] Nations, U. 2014. Worlds population increasingly urban with more than half living in urban areas. United Nations.
- [Portes and Hao 2002] Portes, A., and Hao, L. 2002. The price of uniformity: Language, family and personality adjustment in the immigrant second generation. Ethnic and Racial Studies 25(6):889–912.
- [Quercia et al. 2015] Quercia, D.; Aiello, L. M.; Schifanella, R.; and Davies, A. 2015. The Digital Life of Walkable Streets. In Proceedings of WWW.
- [Razavi and Staab 2010] Razavi, S., and Staab, S. 2010. Underpaid and overworked: A cross-national perspective on care workers. International Labour Review 149(4):407–422.
- [Reades et al. 2007] Reades, J.; Calabrese, F.; Sevtsuk, A.; and Ratti, C. 2007. Cellular census: Explorations in urban data collection. IEEE Pervasive Computing 6(3).
- [Schiller and Çauglar 2009] Schiller, N. G., and Çauglar, A. 2009. Towards a comparative theory of locality in migration studies: Migrant incorporation and city scale. Journal of ethnic and migration studies 35(2):177–202.
- [Schiller and Simsek-Caglar 2011] Schiller, N. G., and Simsek-Caglar, A. 2011. Locating migration: Rescaling cities and migrants. Cornell University Press.
- [Scholten 2013] Scholten, P. W. 2013. Agenda dynamics and the multi-level governance of intractable policy controversies: the case of migrant integration policies in the Netherlands. Policy Sciences 46(3):217–236.
- [Strang and Ager 2010] Strang, A., and Ager, A. 2010. Refugee integration: Emerging trends and remaining agendas. Journal of Refugee Studies 23(4):589–607.
- [Waters and Jiménez 2005] Waters, M. C., and Jiménez, T. R. 2005. Assessing immigrant assimilation: New empirical and theoretical challenges. Annu. Rev. Sociol. 31:105–125.
- [Whitzman 2006] Whitzman, C. 2006. At the intersection of invisibilities: Canadian women, homelessness and health outside the ‘big city’. Gender, Place & Culture 13(4):383–399.
- [Yue et al. 2013] Yue, Z.; Li, S.; Jin, X.; and Feldman, M. W. 2013. The role of social networks in the integration of Chinese rural–urban migrants: A migrant–resident tie perspective. Urban Studies 50(9):1704–1723.
- [Zheng et al. 2011] Zheng, Y.; Liu, Y.; Yuan, J.; and Xie, X. 2011. Urban computing with taxicabs. In Proceedings of UbiComp.
- [Zheng et al. 2014] Zheng, Y.; Capra, L.; Wolfson, O.; and Yang, H. 2014. Urban Computing: Concepts, Methodologies, and Applications. ACM Transactions of Intelligent System and Technology 5(3):38:1–38:55.