Magmatic focusing to mid-ocean ridges: the role of grain size variability and non-Newtonian viscosity
Abstract
Melting beneath mid-ocean ridges occurs over a region that is much broader than the zone of magmatic emplacement to form the oceanic crust. Magma is focused into this zone by lateral transport. This focusing has typically been explained by dynamic pressure gradients associated with corner flow, or by a sub-lithospheric channel sloping upward toward the ridge axis. Here we discuss a novel mechanism for magmatic focusing: lateral transport driven by gradients in compaction pressure within the asthenosphere. These gradients arise from the co-variation of melting rate and compaction viscosity. The compaction viscosity, in previous models, was given as a function of melt fraction and temperature. In contrast, we show that the viscosity variations relevant to melt focusing arise from grain-size variability and non-Newtonian creep. The asthenospheric distribution of melt fraction predicted by our models provides an improved explanation of the electrical resistivity structure beneath one location on the East Pacific Rise. More generally, although grain size and non-Newtonian viscosity are properties of the solid phase, we find that in the context of mid-ocean ridges, their effect on melt transport is more profound than their effect on the mantle corner-flow.
1 Introduction
Melting beneath mid-ocean ridges occurs over a broad region, of order 100 km width in the plate-spreading direction. By contrast, magmatic emplacement to form the oceanic crust is limited to a zone that is 5 km in width, centered on the ridge axis. Magmatic focusing refers to the process or processes by which magma is extracted from the broad source region and transported to the narrow emplacement zone. The mechanism, lateral extent, and efficiency of magmatic focusing have been a subject of considerable interest in theoretical models of mid-ocean ridge magmatism.
There are two dominant hypotheses for magmatic focusing in that literature. The first argues that the dynamic pressure gradient arising from plate-driven, asthenospheric corner-flow sucks melt laterally toward the ridge axis (Spiegelman and McKenzie, 1987; Phipps Morgan, 1987). The second argues that crystallisation at the base of the thermal lithosphere creates an impermeable layer sloping upward toward the ridge axis; magma is then channelised along this barrier toward the ridge axis (Sparks and Parmentier, 1991; Spiegelman, 1993b; Hebert and Montési, 2010). This latter mechanism has been used to model melt focusing in 3-D along specific ridge systems (e.g., Magde and Sparks, 1997; Montesi et al., 2011) and oceanic transform faults (Gregg et al., 2009; Bai and Montesi, 2015). Keller et al. (2017) describe two-phase flow models indicating that both mechanisms contribute to focusing. However, it is unclear whether either corner-flow suction or the sublithospheric-permeability-barrier mechanism are supported by observations. To focus melt over distances of 60 km, the former requires asthenospheric viscosities (1021 Pa-sec) that are unrealistically high, based on laboratory estimates (Hirth and Kohlstedt, 2003). The latter predicts a high-porosity layer (melt volume fractions of several percent) beneath the lithosphere that should be detectable by seismic or magnetotelluric methods, but to date has not been detected in the vicinity of a mid-ocean ridge. Indeed, a recent magnetotelluric inversion of electrical resistivity beneath the northern East Pacific Rise suggests a style of magmatic flow than has not been predicted by any models of melt focusing at mid-ocean ridges (Key et al., 2013).
Key et al. (2013) image a triangular region of diminished resistivity between about 10 and 100 km depth beneath the ridge axis. The sides of this region are relatively sharp and dip at about 45∘ away from the ridge axis. Assuming that this resistivity structure is broadly representative of the volume fraction of silicate melts, this observation is inconsistent with the sublithospheric-permeability-barrier mechanism for melt focusing: there is no evidence for an off-axis, low-resistivity layer at depths immediately beneath the thermal lithosphere. Rather, there is a high-resistivity region that extends off-axis from 5 km depth to the sides of the low-resistivity triangle. Previous focusing hypotheses (Spiegelman and McKenzie, 1987; Sparks and Parmentier, 1991) and more recent computational models (Ghods and Arkani-Hamed, 2000; Katz, 2008; Keller and Katz, 2016) predict non-zero or even upward-increasing melt fraction in these regions, which should be associated with modest to low resistivity (Miller et al., 2015).
These observations motivate a re-examination of the mechanisms by which melt is focused beneath mid-ocean ridges. Permeability, which is a key control on melt segregation, is highly sensitive to grain size (Miller et al., 2014; von Bargen and Waff, 1986). As such, several studies have analysed the effects of grain-size variability on magmatic focusing in subduction zones (Cagnioncle et al., 2007; Wada et al., 2011; Wada and Behn, 2015). For mid-ocean ridges, Turner et al. (2015) coupled single-phase, passive mantle flow with composite, non-Newtonian viscosity and grain size evolution. Steady state solutions predicted an upward decrease in grain size within an elongated zone that slopes toward the ridge axis. Although the model by Turner et al. (2015) did not include an explicit prediction of magmatic flow, the layer of small grain size was interpreted as a barrier to vertical magmatic segregation (albeit a leaky one). Intriugingly, this layer is coincident with the margin of the low-resistivity region in the Key et al. (2013) MT observations. This led Turner et al. (2015) to hypothesise that grain size plays an important role in focusing magma toward the axis at mid-ocean ridges.
In the present manuscript, we develop two-phase flow models of magma/mantle interaction in a variable grain-size mantle to investigate the focusing hypothesis of Turner et al. (2015). Our models compute the mean grain-size field as in that work, but further couple it with conservation of mass, momentum, and energy for a liquid phase (the magma) and a solid phase (the mantle) (McKenzie, 1984; Keller and Katz, 2016). We obtain a pattern of magmatic segregation that exhibits strong focusing toward the ridge axis. However, the focusing mechanism is more complex than envisioned by Turner et al. (2015) and cannot be explained by the spatial structure of permeability that arises from the grain-size field. In particular, focusing is linked to variations in melting rate and asthenospheric viscosity; it is linked to grain size, but through its influence on viscosity. The resulting focusing mechanism is previously unrecognised and predicts melt distributions beneath the ridge axis that are broadly consistent with the resistivity structure of Key et al. (2013). Below we present our numerical two-phase results after a brief exposition of theory and methods used in this study. These results are followed by a discussion of the causative physical mechanisms for melt focusing.
2 Methods
The overall method used in this work is computational modelling of geodynamic processes by solution of partial differential equations. In this section we describe the physical processes that are incorporated in the governing equations and the assumptions that are used to simplify those equations. We provide a brief overview of the numerical methods used to discretise and solve the system.
2.1 Mechanics and thermochemistry
The two-phase model comprises statements of conservation of mass and momentum for a liquid () and a solid () phase. The volume fraction of liquid within a representative volume element is . The density of each phase is considered constant and the two densities are considered equal (to ) except in terms representing the body force, where the solid-minus-liquid difference is denoted (the extended Boussinesq approximation). Following McKenzie (1984),
| (1a) | ||||
| (1b) | ||||
| (1c) | ||||
| (1d) | ||||
The first equation, in which , is a continuity equation that expresses conservation of mass for the bulk, two-phase system. The second equation represents conservation of mass for the solid phase; is the melting rate in mass/volume/time. The third equation represents Stokesian momentum conservation for the aggregate; is a dynamic pressure gradient; is the strain-rate tensor; and are the shear and compaction viscosity, respectively; is the accelleration of gravity. The fourth equation represents Darcian momentum conservation in the liquid phase; is the ratio of permeability to magma viscosity.
The general characteristics and behaviour of this system of equations is discussed in the literature. Of particular interest here is the Darcian segregation flux, , which is driven by dynamic pressure gradients and magma buoyancy associated with the interphase density difference, according to equation (1d).
This system of equations is closed by equations for the melting rate , the liquid mobility and the aggregate shear and compaction viscosities. The melting rate is computed by coupling the mechanical system (1) with a thermochemical system that represents conservation of energy and species mass, and with a kinetic formulation for melting reactions called R_DMC (see Keller and Katz, 2016, for details). We use a two-pseudocomponent system, where the pseudocomponents are the product and residual of MORB-type mantle melting (Ribe, 1985; Shorttle et al., 2014).
2.2 Constitutive laws
The permeability of the solid aggregate is parameterised on empirical and theoretical grounds as , where is the mean grain size; and are empirical constants, taken as 2 and 500 here (Miller et al., 2014, and refs. therein). This is valid at porosities below the disaggregation threshold of about .
The viscosity of the aggregate is treated by Turner et al. (2015) as a harmonic mean of flow laws for diffusion creep, dislocation creep, and dislocation-accommodated grain-boundary sliding (GBS). All of these creep processes are thermally activated, but only dislocation creep and GBS are non-Newtonian, and only diffusion creep and GBS are grain-size sensitive. To simplify the calculation of viscosity for present purposes while retaining the generality to incorporate all of these dependencies, we adopt a single shear-viscosity law,
| (2) |
where is the second invariant of the strain-rate tensor, and are constants, is activation energy, is the universal gas constant, and is temperature. Quantities in angular brackets are normalised by a reference value, e.g., . Variations in shear viscosity with melt fraction are neglected because for small , they are smaller than other variations. See table 1 for parameter and reference values.
| Symbol | Description | Value | Units |
|---|---|---|---|
| Grain size | 0.003 or calculated | m | |
| Reference grain size | m | ||
| Second invariant of strain rate | calculated | s-1 | |
| Reference second invariant of strain rate | s-1 | ||
| Activation energy | J mol-1 | ||
| Temperature | calculated | K | |
| Reference temperature | K | ||
| Reference shear viscosity | Pa s | ||
| Bulk viscosity constant | - | ||
| Permeability melt fraction exponent | 2 | - | |
| Permeability constant | 500 | - | |
| Grain growth exponent | 5 | - | |
| Grain rheology exponent | See text | - | |
| Stress exponent | See text | - | |
| Grain growth constant | m5 s-1 | ||
| Grain growth activation energy | J mol-1 | ||
| Surface energy density of grain boundaries | J m-2 | ||
| Density (Boussinesq) | kg m-3 | ||
| Density difference (Boussinesq) | kg m-3 | ||
| Melt fraction | calculated | - | |
| Melting rate | calculated | Kg m-3 s-1 | |
| Liquid viscosity | 10 | Pa s | |
| Solid velocity | calculated | m s-1 | |
| Fluid velocity | calculated | m s-1 | |
| Separation flux | calculated | m s-1 |
2.3 Grain-size dynamics
The permeability and the shear viscosity have an explicit dependence on grain size, which is fundamental to the focusing hypothesis of Turner et al. (2015). Hence we follow Turner et al. (2015) in incorporating a model of variations in the mean grain size based on the Wattmeter formulation of Austin and Evans (2007, 2009). We give a brief review of the model and refer the reader to Turner et al. (2015) and Behn et al. (2009) for details.
The mean grain size varies according to
| (4) |
This equation states that grain-size variation along mantle flow lines is due to independent processes of growth by material diffusion between grains and reduction by recrystallisation. and are the grain-growth prefactor and activation energy for grain growth, respectively. is an exponent that, for an unpinned, single-phase polycrystalline aggregate is in the range 2–3 (Burke and Turnbull, 1952; Hillert, 1965; Atkinson, 1988). Experiments suggest, however, that in the presence of a minor, pinning phase, the grain-growth exponent should be taken as 4–6 or even greater (Hiraga et al., 2010; Tasaka and Hiraga, 2013; Thielmann et al., 2015). We adopt the value of here.
The second term on the right-hand side of equation (4) represents grain-size reduction by conversion of viscous work into formation of new grain boundaries. is a coefficient representing the energetic cost of grain boundaries. In models with composite viscosity, this term is multiplied by a fraction representing the portion of deformational work that is achieved by dislocation-based creep mechanisms. for the simplified, non-Newtonian flow law used here that fraction is unity, but we assume that 25% of the dissipated power goes into heating.
2.4 Boundary conditions and numerical methods
The model is formulated as equations (1) and (4) with constitutive laws (2) and (3), and with the thermo-chemical model of Keller and Katz (2016). The body force in the aggregate force balance equation (1c) is of order and hence we neglect it for simplicity. The domain is two-dimensional, rectangular, and aligned vertically and with the spreading direction. One lateral edge is directly beneath the mid-ocean ridge axis and is assumed to be a line of bilateral symmetry. The top boundary represents the surface of the oceanic crust and has an imposed velocity of , where is the width of distributed extension by normal faulting at the ridge axis. The bottom (inflow) and side (outflow) boundaries have zero normal stress gradient. The temperature on the top boundary is set to zero Celcius, while the mantle potential temperature (on the bottom boundary) is set to 1350∘C. Grain size has an imposed value of 3 mm on the bottom boundary. The fertile component is assumed to comprise 20% of the unmelted mantle source. Magma is allowed to leave the domain at the ridge axis by enforcing no melting or freezing within a region of width beneath the ridge axis. Over this width, the pressure on the top boundary is set to enforce zero normal gradient in the Darcy segregation flux.
The governing equations are discretised by finite volume and finite difference methods on a staggered grid (Katz et al., 2007; Keller and Katz, 2016) of model dimensions 400 km wide by 250 km deep with grid resolution of 0.75 km. Time-stepping is semi-implicit and time-step size is computed adaptively according to the magnitude of the maximum liquid velocity over the domain. The system of discrete equations is solved at each timestep with an outer iteration in which the mechanics, the thermo-chemistry, and the grain size solutions are each updated separately. The mechanical solution is obtained using the sparse direct solver MUMPS (Amestoy et al., 2001), while the other equations are solved using block-Jacobi preconditioned GMRES. The data structures and parallel methods are provided by the Portable Extensible Toolkit for Scientific Computation (Balay et al., 2016a, b).
3 Results of end-member models
The theory described above is used to calculate grain size evolution and two-phase flow in two end-member cases. The first case is a base model with Newtonian rheology and spatially uniform grain-size. In the second, the full model, we solve for a fully coupled system with non-Newtonian rheology and dynamic grain-size evolution. Below we summarize the results of both sets of simulations and their predictions for melt migration beneath the ridge axis.
3.1 Newtonian; constant grain size (base model)
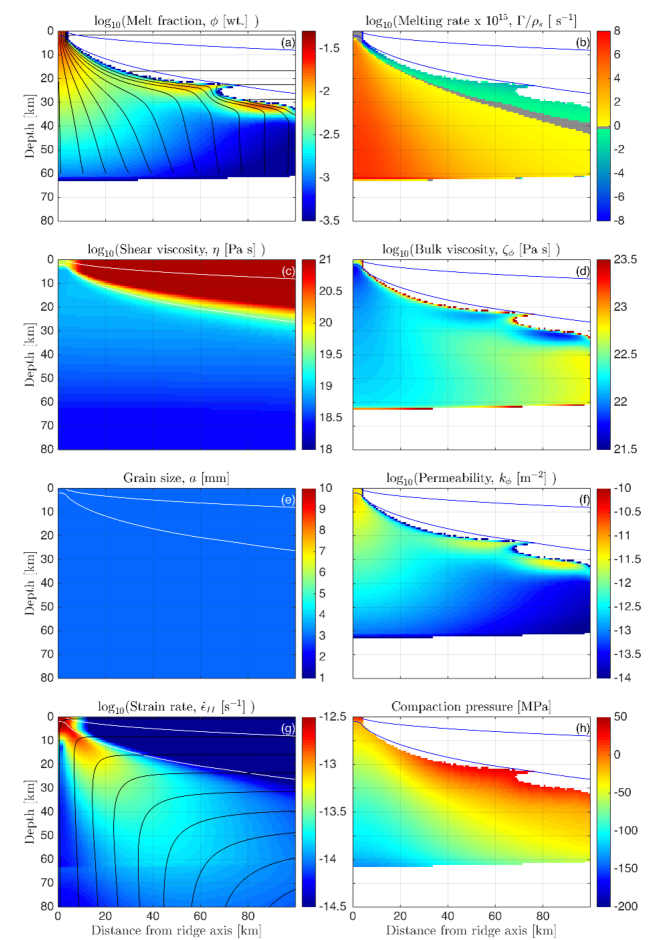
The base model is constructed by imposing a static and spatially uniform grain size of 3 mm. Mantle rheology is constrained to be Newtonian () and grain-size insensitive (). In this case, the shear viscosity and permeability are solely functions of the temperature and melt fraction, respectively. This model setup is similar to that originally proposed by Sparks and Parmentier (1991) and calculated numerically by Katz (2010).
Melt migration in the base model is sub-vertical throughout much of the melting region (Fig. 1a). Immediately below the lithospheric thermal boundary layer, melt is deflected toward the ridge axis in a narrow zone, 5 km wide. Melt fractions in the mantle are generally low (%), increasing gradually upward and toward the ridge axis. The location of the zone in which melt flow is deflected horizontally is determine by the balance between the compaction length, the rate of melt supply from below, and crystallization from above (Spiegelman, 1993b). The depth at which the crystallization rate exceeds the melt supply closely follows the 1250∘C isotherm (Fig. 1b). The deflection of melt along this boundary results from the vertical gradient in compaction pressure, which produces a net force that retards the upward, buoyancy-driven transport of melt and deflects it laterally toward the ridge axis. This result is consistent with the decompaction channel model originally proposed by Sparks and Parmentier (1991), however, our calculations predict lower melt fractions in the channel. Two possible reasons for this discrepancy are, first, a longer compaction length in our models and, second, that our boundary condition for melt extraction at the ridge axis adds an additional component of suction toward the ridge.
Toward the margins of the melting region, solitary waves are observed to arrive along the base of thermal boundary layer. These features are suppressed near the ridge axis due to the higher melting rates (Fig. 1b) associated with enhanced mantle upwelling directly beneath the axis (Spiegelman, 1993a). On the limbs of the partially molten region, however, the melting rate is insufficient to suppress the formation of solitary waves, leading to a time-dependence in the solutions, but only at distances 50 km from the ridge axis.
3.2 Non-Newtonian; variable grain size (full model)
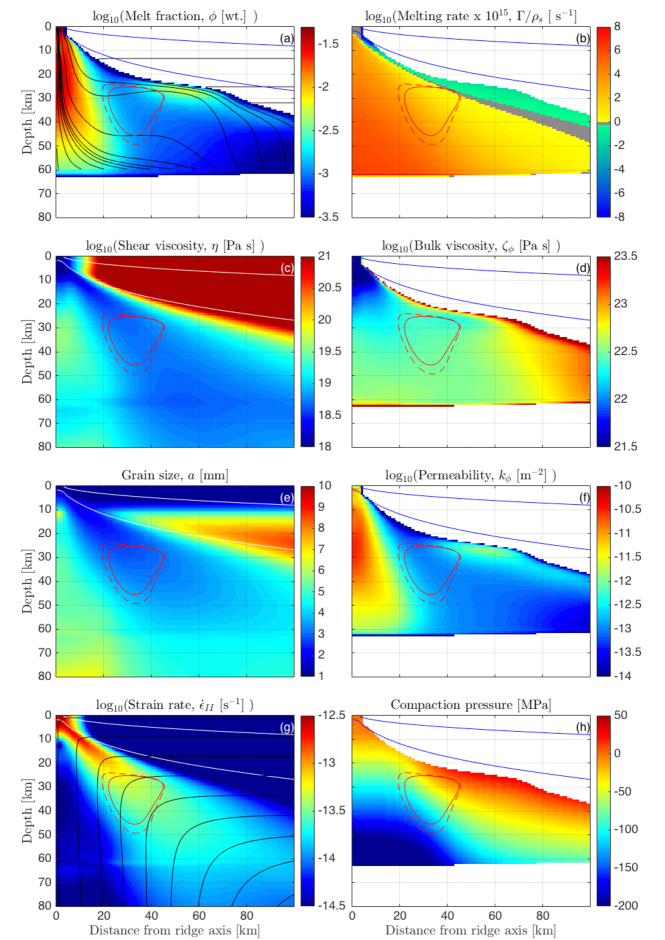
We next considered the full model in which grain size evolution is coupled to the mantle deformation field (Fig. 2). Mantle viscosity is non-Newtonian with a stress exponent () and grain size sensitivity (). The resulting grain size field is characterized by relatively large grain sizes directly beneath the ridge axis and within the lower lithosphere (Fig. 2e). Grain sizes are smallest near the surface and within a portion of the melting region that extends downward from the ridge axis at an angle of . This grain size distribution is consistent with earlier single-phase simulations that did not incorporate melt migration (Turner et al., 2015). The dipping layer of reduced grain size is the result of high strain-rates caused by the corner flow; it corresponds to a region of low permeability (Fig. 2e) that is not observed in the base model (Fig. 1e). However, the variability in permeability more closely mirrors the porosity (Fig. 2a). Establishing causality, in this context, appears to be a “chicken/egg” problem, but an analysis in the next section clarifies the minimal importance of the permeability in the overall dynamics.
The distribution of melt beneath the axis (Fig. 2a) is dramatically different in the full model as compared to the base model. Specifically, melt is concentrated in a relatively narrow region (20 km wide) directly beneath the ridge axis, while the melt fraction in the off-axis mantle decreases relative to the base model. These variations in melt fraction correspond to changes in the trajectories of melt transport. In the fully coupled model, melt flow is directed vertically beneath the ridge axis, where melt fractions are highest. However, at distances km from the ridge, melt flow is sharply deflected towards the axis and follows horizontal trajectories. Indeed, at distances 20–40 km from the axis, melts are predicted to travel slightly downward as they approach the ridge axis (Fig. 2a). A small zone of high melt fraction is observed 40–70 km off-axis at the base of the thermal boundary layer, but it is not a continuous feature that connects to the ridge axis, as would be expected for a decompaction channel.
4 Model sensitivity
The full model end-member shown in Figure 2 illustrates a striking difference in melt transport from the canonical view associated with the base model, which has Newtonian viscosity and constant grain size (Fig. 1). These two calculations differ in several ways: the permeability and the viscosity structure associated with grain-size variation, as well as the viscosity structure associated with the strain-rate dependence. Turner et al. (2015) considered that only the permeability structure would modify melt segregation, but from these end-member models, it is impossible to disentangle the contributions of these different factors.
To analyse the role of each factor, we focus attention on the sub-domain at lateral distances of 20 and 40 km from the ridge axis at depths less than 60 km. There, the segregation of melt in the full model is dominantly lateral, indicating that buoyancy is not the primary driver of segregation. In fact there is a region, enclosed by a dashed line, in which the segregation flux , meaning that the vertical component of the liquid velocity is less than that of the solid, though it may still be positive. Within that region, there is a smaller region in which , which means that melt is driven downward, against buoyancy. Downward melt flow was also obtained by Spiegelman and McKenzie (1987), though in that case it was driven by the large dynamic pressure gradients of unrealistically high-viscosity corner flow. Under these conditions, where buoyancy is balanced by a vertical pressure gradient, lateral melt transport can become dominant. Hence the problem of understanding focusing can be approximately reduced to understanding the vertical pressure gradient that balances buoyancy.
To this end it is helpful to consider a scaling analysis of governing equations (1) in the direction. Starting with the force balance of the aggregate, eqn. (1c), we neglect body forces that are of order and pressure gradients arising from corner flow, which are small at these distances and at small shear viscosity (Spiegelman and McKenzie, 1987). This gives us , where we have inferred that because the porosity is small, . Then, taking , expanding conservation of mass eqn. (1b) at steady state, and using it to eliminate , we find that
| (5) |
This states that dynamic pressure is associated with the compaction needed to balance melting and maintain constant porosity.
Substituting (5) into eqn. (1d) and rearranging gives . The case we are interested in is and hence we have . The first term on the right-hand side represents advection of porosity by the solid flow. This flow is dominantly upward beneath the lithosphere in the region of interest. Moreover, because melt extraction is efficient, the vertical advection of porosity is much smaller than the production of melt (e.g., Ribe, 1985). Hence, within the zone of negative melt segregation (), it must be the case that
| (6) |
Term-by-term evaluation of the numerical solution for the full model confirms that this approximate balance holds.
It is evident from this analysis that changes in permeability cannot balance the buoyancy of the magma. The permeability (in terms of mobility, ) modulates the segregation flux but, because permeability is scalar and strictly positive, it cannot explain the downward segregation of magma. When the porosity is in steady state, compaction must be in approximate balance with melting (); this means that the dynamic pressure scales as . This pressure is typically referred to as the compaction pressure and its gradient can drive magmatic segregation. Equation (6) shows that compaction-pressure gradients, arising from melting-rate variations, can drive segregation downward, against buoyancy. But the melting-rate field, shown for each of the end-member models in panel (b) of Figures 1 and 2, is nearly identical. Therefore the melting rate by itself cannot explain the difference in segregation between these two models.
Covariation of the melting rate and the compaction viscosity can explain this difference. In particular, this variation can explain the emergence of lateral melt transport in the full model. is the viscous resistance to compaction and is shown in panel (d) of Figures 1 and 2. In the base model, increases upward where decreases upward, leading to a product that is roughly constant. In the full model, both and decrease upwards. The product is thus not constant; instead it has a vertical gradient that is sufficiently negative that the inequality (6) is satisfied.
Hence the crucial distinction between the base model and the full model is not the grain-size control on melt mobility , as was hypothesised by Turner et al. (2015). Rather it is the variation in compaction viscosity through its dependence on grain size and strain rate, which it inherits from the shear viscosity . The grain size itself is sensitive to the strain rate; indeed the rate of grain-size reduction scales with the square of the strain rate. This raises the question of whether the strain-rate field, through its influence on viscosity and grain size, can explain melt focusing in the full model. Rudge and Bercovici (2015) showed that if there is an instantaneous balance of the rates of grain growth and reduction on the right-hand side of eqn. (4), then the mean grain size is given by a power law of the strain rate. This can be substituted into eqn. (2) for shear viscosity, and hence the grain-size dependence can be combined with the strain-rate dependence into a single power-law with an exponent . We will refer to as the effective stress exponent.
Assuming reasonable values for the stress exponent , grain rheology exponent , and grain growth exponent (Karato, 1989; Hirth and Kohlstedt, 2003), the effective stress exponents for dislocation, diffusion, and grain-boundary sliding are calculated to be 3.5, 7, and 8, respectively ( in the Full model, above in Fig. 2). A similar analysis was used by Hansen et al. (2012) to obtain an empirical flow law for deformation in the grain-boundary sliding regime. They obtained an effective stress exponent of 4. These differences are likely related to uncertainities in the grain growth exponent and grain rheology exponent . Moreover, in natural systems where deformation is accommodated by a composite of deformation mechanisms, will take on an intermediate value.
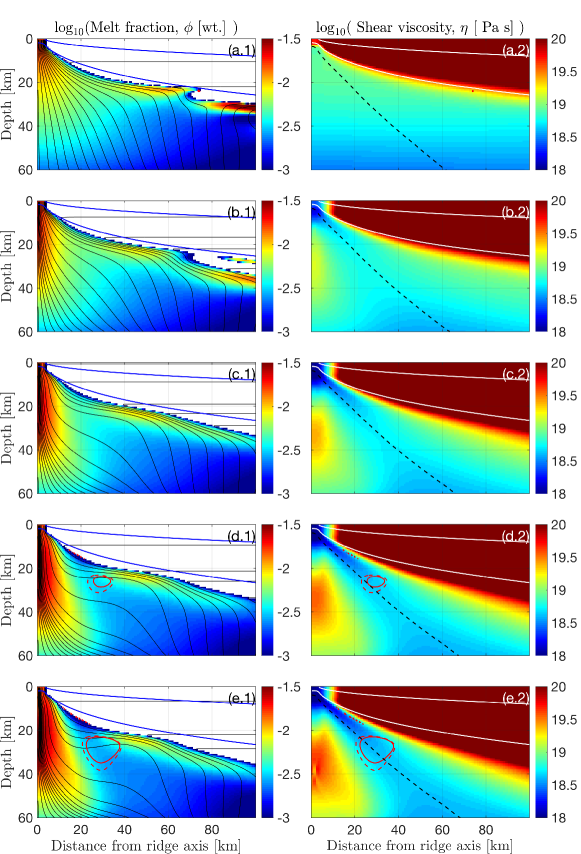
Figure 3 shows output from simulations with different values of the effective stress exponent, run to steady state. The grain size is constant and uniform in these models, and hence does not affect the permeability or viscosity structure. The top row of panels has , making it identical to the base model shown in Fig. 1. Subsequent rows have and . These values for are based on experimental constraints on the viscosity parameters and the grain-growth exponent for the dominant deformation mechanisms in olivine, and thus represent the sensitivty of the shear viscosity to stress or strain rate.
The shear viscosity field is shown in the second column of Figure 3. With increasing , a low-viscosity layer dipping at about emerges. The position of this layer is set by the kinematic structure of corner flow; namely, where the solid turns from upwelling to lateral motion there is a larger strain rate that reduces the viscosity. This variation in is mirrored in the compaction viscosity.
The first column in Fig. 3 shows porosity and magma streamlines for increasing values of . At larger effective stress exponent, viscosity variations give rise to compaction pressure gradients (eqn. (6)) that focus melt. The pattern of melt transport looks increasingly similar to the pattern in the full model of Fig. 2, even resulting in a region of downward melt segregation. This demonstrates that the difference between the full model and the base model is a consequence of the strain-rate control (or, equivalently, the stress control) on viscosity and not the influence of grain size on permeability.
This finding is interesting, in part, because it is in stark contrast to the invariance of the solid flow under changes to the effective stress exponent. This invariance is evident in the comparison of the melting-rate field in panel (b) of Figs. 1 and 2, which reflects the solid upwelling rate. The solid flow is tightly constrained by the kinematic boundary conditions and the thermally imposed structure of the lithosphere. The liquid flow, however, is free to respond to pressure gradients arising from the dynamics and, in this case, from the compaction pressure associated with melt extraction. The connection between melting, compaction viscosity, and compaction pressure that was highlighted in the scaling analysis, above, is the crucial link between rheology and melt extraction.
5 Discussion and conclusion
The results presented above represent a previously unexamined form of magmatic focusing at mid-ocean ridges. This mechanism does not rely on the dynamic pressure gradient associated with corner-flow (Spiegelman and McKenzie, 1987) or melt transport along a sublithospheric channel (Sparks and Parmentier, 1991), though both of these mechanisms can and do play a minor role in the full model shown in Figure 2. Instead, this focusing mechanism relies on gradients in compaction pressure that arise from variations in viscosity and melting rate. These variations are, in turn, controlled by the characteristic corner-flow structure of mantle deformation beneath mid-ocean ridges. To zeroth order, this flow structure is controlled by the boundary conditions associated with plate separation and is insensitive to viscosity variations. Specifically, corner-flow leads to a triangular region of upwelling with its apex at the mid-ocean ridge axis. This upwelling controls the melting rate field . The transition from upwelling to horizontal flow occurs along the sides of the triangle, which slope downward away from the ridge axis at an angle of 45∘. The enhanced strain rate associated with this transition controls both the variation in grain size and non-Newtonian viscosity (and ).
In the full model, the melting rate increases toward the ridge axis, while the bulk viscosity remains roughly constant. This results in a spatial structure of that drives melt flow laterally from the flanks of the melting region toward the ridge. This can be understood by considering the balance of compaction and melting when the melt fraction is constant. At this steady state, melt must segregate as fast as it is produced (neglecting the advection of melt fraction, which is small). In other words, the solid phase must converge at a rate that is given by the volume production rate of magma, . A convergent solid flow means the magma is underpressured, i.e., that the compaction pressure is negative. This underpressure increases in magnitude with the compaction viscosity. Hence regions with slower melting rates and/or lower viscosities have larger (less negative) compaction pressure. The resulting compaction pressure gradient drives melt toward regions of larger .
The compaction pressure gradient associated with in the full model is enhanced by the focusing process itself. Focusing concentrates melt into a column of mantle directly beneath the ridge axis. The larger melt fractions in this column produce a high-permeability connection between the surface and the melting region below. High permeability promotes a larger compaction length, and hence the transmission of low compaction pressure from the ridge axis to depth.
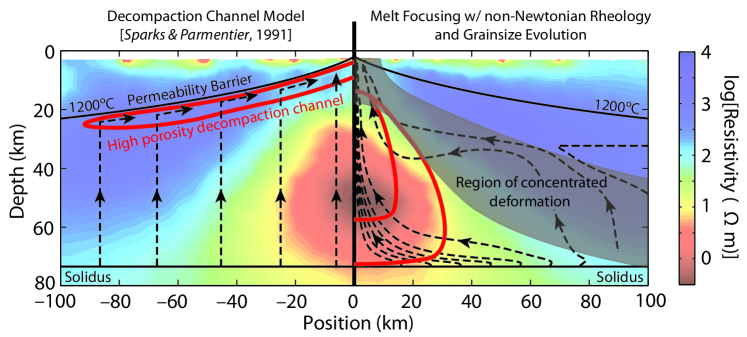
Figure 4 is a schematic illustration of our hypothesised focusing mechanism compared to the sublithospheric decompaction-channel mechanism (Sparks and Parmentier, 1991). The resistivity field obtained by Key et al. (2013) is shown in the background. Focusing associated with a sublithospheric channel predicts a distribution of melt fraction that is inconsistent with that implied by the resistivity data. In particular, the rapid, vertical extraction of melt below the decompaction channel should result in higher and more uniform resistivity throughout the melting region. Thus this model cannot explain the steep-sided shape of the low resistivity region beneath the axis. By contrast, the full model predicts magma to move laterally at depths above the onset of silicate melting and concentrate beneath the ridge axis (Fig. 4). This melt distribution is more consistent, qualitatively, with the MT inversion, which shows a minimum in resisitivity directly beneath the ridge axis.
The focusing mechanism we propose is different in many of its details from that suggested by Turner et al. (2015). Their hypothesis was based on the permeability structure arising from variations in mean grain size. The grain size variations obtained in the full model above (Fig. 2) are largely consistent with Turner et al. (2015). However, our numerical experiments using constant grain size and large in section 4 show that focusing is not a direct consequence of the permeability structure. Furthermore, the scaling analysis presented above supports the idea that viscosity and melting-rate variations are most important in promoting melt focusing. Thus, while grain size can be important in influencing mantle viscosity, its effect on mantle permeability does not exert a significant control on melt focusing.
This conclusion raises a more general point regarding two-phase models of coupled magma/mantle flow. For convenience and simplicity, those models have generally neglected the non-Newtonian stress dependence that arises from dislocation-based creep mechanisms when computing two-phase flow (e.g., Katz, 2010). This has been justified on the grounds that the kinematically-driven mantle flow field is little affected by this exclusion. However, the results presented here suggest that despite the invariance of the solid flow, the pattern of magmatic segregation is sensitive to the stress dependence of mantle viscosity. Although this has been noted in models of laboratory-scale two-phase flow (Katz et al., 2006), it was unrecognised in the context of larger-scale tectonic models. Future work should more thoroughly explore the consequences of non-Newtonian viscosity for melt segregation in different geologic environments.
Acknowledgements
The research leading to these results has received funding from the European Research Council under the European Union’s Seventh Framework Programme (FP7/2007–2013)/ERC grant agreement 279925. The authors acknowledge the use of the University of Oxford Advanced Research Computing (ARC) facility in carrying out this work. Support for Behn was provided by grant OCE-14-58201 from the US National Science Foundation. The authors thank the Isaac Newton Institute for Mathematical Sciences for its hospitality during the programme Melt in the Mantle, which was supported by EPSRC Grant Number EP/K032208/1.
References
- Amestoy et al. [2001] P. R. Amestoy, I. S. Duff, J. Koster, and J.-Y. L’Excellent. A fully asynchronous multifrontal solver using distributed dynamic scheduling. SIAM Journal on Matrix Analysis and Applications, 23(1):15–41, 2001.
- Atkinson [1988] H. Atkinson. Overview no. 65: Theories of normal grain growth in pure single phase systems. Acta Metallurgica, 36:469–491, 1988.
- Austin and Evans [2009] N. Austin and B. Evans. The kinetics of microstructural evolution during deformation of calcite. Journal of Geophysical Research, 114, 2009. doi: 10.1029/2008JB006138.
- Austin and Evans [2007] N. J. Austin and B. Evans. Paleowattmeters: A scaling relation for dynamically recrystallized grain size. Geology, 35(4):343–346, 2007.
- Bai and Montesi [2015] H. Bai and L. Montesi. Slip-rate-dependent melt extraction at oceanic transform faults. Geochemistry, Geophysics, Geosystems, 16:401–419, 2015. doi: 10.1002/2014GC005579.
- Balay et al. [2016b] S. Balay, S. Abhyankar, M. F. Adams, J. Brown, P. Brune, K. Buschelman, L. Dalcin, V. Eijkhout, W. D. Gropp, D. Kaushik, M. G. Knepley, L. C. McInnes, K. Rupp, B. F. Smith, S. Zampini, H. Zhang, and H. Zhang. PETSc users manual. Technical Report ANL-95/11 - Revision 3.7, Argonne National Laboratory, 2016b. URL http://www.mcs.anl.gov/petsc.
- Balay et al. [2016a] S. Balay, S. Abhyankar, M. F. Adams, J. Brown, P. Brune, K. Buschelman, L. Dalcin, V. Eijkhout, W. D. Gropp, D. Kaushik, M. G. Knepley, L. C. McInnes, K. Rupp, B. F. Smith, S. Zampini, H. Zhang, and H. Zhang. PETSc Web page. http://www.mcs.anl.gov/petsc, 2016a. URL http://www.mcs.anl.gov/petsc.
- Behn et al. [2009] M. D. Behn, G. Hirth, and J. R. Elsenbeck. Implications of grain size evolution on the seismic structure of the oceanic upper mantle. Earth And Planetary Science Letters, 282(1-4):178–189, 2009.
- Burke and Turnbull [1952] J. Burke and D. Turnbull. Recrystallization and grain growth. Progress in Metal Physics, 3:220–292, 1952.
- Cagnioncle et al. [2007] A.-M. Cagnioncle, E. Parmentier, and L. Elkins-Tanton. Effect of solid flow above a subducting slab on water distribution and melting at convergent plate boundaries. J. Geophys. Res., 112, 2007. doi: 10.1029/2007JB004934.
- Ghods and Arkani-Hamed [2000] A. Ghods and J. Arkani-Hamed. Melt migration beneath mid-ocean ridges. Geophysical Journal International, 140(3):687–697, 2000. doi: 10.1046/j.1365-246X.2000.00032.x.
- Gregg et al. [2009] P. M. Gregg, M. D. Behn, and T. L. Grove. Melt generation, crystallization, and extraction beneath segmented oceanic transform faults. Journal of Geophysical Research, 114(B11102), 2009. doi: 10.1029/2008JB006100.
- Hansen et al. [2012] L. N. Hansen, M. E. Zimmerman, and D. L. Kohlstedt. The influence of microstructure on deformation of olivine in the grain-boundary sliding regime. Journal of Geophysical Research: Solid Earth (1978–2012), 117(B9), 2012.
- Hebert and Montési [2010] L. B. Hebert and L. G. J. Montési. Generation of permeability barriers during melt extraction at mid-ocean ridges. Geochemistry, Geophysics, Geosystems, 11(12), 2010. doi: 10.1029/2010GC003270.
- Hillert [1965] M. Hillert. On the theory of normal and abnormal grain growth. Acta Metallurgica, 13:227–238, 1965.
- Hiraga et al. [2010] T. Hiraga, C. Tachibana, N. Ohashi, and S. Sano. Grain growth systematics for forsteriteenstatite aggregates: Effect of lithology on grain size in the upper mantle. Earth and Planetary Science Letters, 291(1):10–20, 2010.
- Hirth and Kohlstedt [2003] G. Hirth and D. Kohlstedt. Rheology of the upper mantle and the mantle wedge: A view from the experimentalists. Inside the subduction Factory, pages 83–105, 2003.
- Karato [1989] S.-I. Karato. Grain growth kinetics in olivine aggregates. Tectonophysics, 168:255–273, 1989.
- Katz [2008] R. Katz. Magma dynamics with the enthalpy method: Benchmark solutions and magmatic focusing at mid-ocean ridges. Journal of Petrology, 49(12):2099–2121, 2008.
- Katz et al. [2007] R. Katz, M. Knepley, B. Smith, M. Spiegelman, and E. Coon. Numerical simulation of geodynamic processes with the Portable Extensible Toolkit for Scientific Computation. Phys. Earth Planet. In., 163:52–68, 2007. doi: 10.1016/j.pepi.2007.04.016.
- Katz [2010] R. F. Katz. Porosity-driven convection and asymmetry beneath mid-ocean ridges. Geochemistry, Geophysics, Geosystems, 11(11), 2010. doi: 10.1029/2010GC003282.
- Katz et al. [2006] R. F. Katz, M. Spiegelman, and B. Holtzman. The dynamics of melt and shear localization in partially molten aggregates. Nature, 442:676–679, 2006.
- Keller and Katz [2016] T. Keller and R. Katz. The role of volatiles in reactive melt transport in the asthenosphere. Journal Of Petrology, 57(6):1073–1108, 2016. doi: 10.1093/petrology/egw030.
- Keller et al. [2017] T. Keller, R. Katz, and M. M. Hirschmann. Volatiles beneath mid-ocean ridges: Deep melting, channelised transport, focusing, and metasomatism. Earth And Planetary Science Letters, 464:55–68, 2017.
- Key et al. [2013] K. Key, S. Constable, L. Liu, and A. Pommier. Electrical image of passive mantle upwelling beneath the northern East Pacific Rise. Nature, 495:499–502, 2013.
- Magde and Sparks [1997] L. S. Magde and D. W. Sparks. Three-dimensional mantle upwelling, melt generation, and melt migration beneath segment slow spreading ridges. Journal of Geophysical Research, 102(B9):20571–20583, 1997.
- McKenzie [1984] D. McKenzie. The generation and compaction of partially molten rock. Journal of Petrology, 25(3):713–765, 1984. doi: 10.1093/petrology/25.3.713.
- Miller et al. [2014] K. J. Miller, W. Zhu, L. G. Montési, and G. A. Gaetani. Experimental quantification of permeability of partially molten mantle rock. Earth and Planetary Science Letters, 388”:273 – 282, 2014. doi: http://dx.doi.org/10.1016/j.epsl.2013.12.003.
- Miller et al. [2015] K. J. Miller, L. G. Montési, and W. Zhu. Estimates of olivine–basaltic melt electrical conductivity using a digital rock physics approach. Earth and Planetary Science Letters, 432:332 – 341, 2015. doi: http://dx.doi.org/10.1016/j.epsl.2015.10.004.
- Montesi et al. [2011] L. G. J. Montesi, M. D. Behn, L. B. Hebert, J. Lin, and J. L. Barry. Controls on melt migration and extraction at the ultraslow southwest indian ridge 10∘–16∘e. Journal of Geophysical Research, 116(B10102), 2011. doi: 10.1029/2011JB008259.
- Phipps Morgan [1987] J. Phipps Morgan. Melt migration beneath mid-ocean spreading centers. Geophysical Research Letters, 14(12):1238–1241, 1987.
- Ribe [1985] N. M. Ribe. The deformation and compaction of partial molten zones. Geophysical Journal International, 83(2):487–501, 1985. doi: 10.1111/j.1365-246X.1985.tb06499.x.
- Rudge and Bercovici [2015] J. F. Rudge and D. Bercovici. Melt-band instabilities with two-phase damage. Geophysical Journal International, 201:640–651, May 2015. doi: 10.1093/gji/ggv040.
- Shorttle et al. [2014] O. Shorttle, J. Maclennan, and S. Lambart. Quantifying lithological variability in the mantle. Earth And Planetary Science Letters, 395:24–40, 2014.
- Simpson et al. [2010a] G. Simpson, M. W. Spiegelman, and M. Weinstein. A multiscale model of partial melts: 1. Effective equations. Journal Of Geophysical Research, 115, 2010a.
- Simpson et al. [2010b] G. Simpson, M. W. Spiegelman, and M. Weinstein. A multiscale model of partial melts: 2. Numerical results. Journal Of Geophysical Research, 115, 2010b.
- Sparks and Parmentier [1991] D. W. Sparks and E. Parmentier. Melt extraction from the mantle beneath spreading centers. Earth and Planetary Science Letters, 105(4):368 – 377, 1991. doi: 10.1016/0012-821X(91)90178-K.
- Spiegelman and McKenzie [1987] M. Spiegelman and D. McKenzie. Simple 2-d models for melt extraction at mid-ocean ridges and island arcs. Earth and Planetary Science Letters, 83(1–4):137 – 152, 1987. doi: 10.1016/0012-821X(87)90057-4.
- Spiegelman [1993a] M. W. Spiegelman. Flow in Deformable Porous-Media. 2. Numerical-Analysis - The Relationship between shock-waves and solitary waves. Journal Of Fluid Mechanics, 247:39–63, 1993a.
- Spiegelman [1993b] M. W. Spiegelman. Physics of melt extraction - Theory, Implications and Applications. Philosophical Transactions Of The Royal Society Of London Series A-Mathematical Physical And Engineering Sciences, 342:23–41, 1993b.
- Takei and Holtzman [2009] Y. Takei and B. K. Holtzman. Viscous constitutive relations of solid-liquid composites in terms of grain boundary contiguity: 2. compositional model for small melt fractions. Journal of Geophysical Research: Solid Earth, 114(B6), 2009. ISSN 2156-2202. doi: 10.1029/2008JB005851. URL http://dx.doi.org/10.1029/2008JB005851. B06206.
- Tasaka and Hiraga [2013] M. Tasaka and T. Hiraga. Influence of mineral fraction on the rheological properties of forsterite+ enstatite during grain-size-sensitive creep: 1. grain size and grain growth laws. Journal of Geophysical Research: Solid Earth, 118(8):3970–3990, 2013.
- Thielmann et al. [2015] M. Thielmann, A. Rozel, B. J. P. Kaus, and Y. Ricard. Intermediate-depth earthquake generation and shear zone formation caused by grain size reduction and shear heating. Geology, 43:791–794, Sept. 2015. doi: 10.1130/G36864.1.
- Turner et al. [2015] A. J. Turner, R. F. Katz, and M. D. Behn. Grain-size dynamics beneath mid-ocean ridges: Implications for permeability and melt extraction. Geochemistry, Geophysics, Geosystems, 16(3):925–946, 2015. ISSN 1525-2027. doi: 10.1002/2014GC005692.
- von Bargen and Waff [1986] N. von Bargen and H. S. Waff. Permeabilities, interfacial areas and curvatures of partially molten systems: Results of numerical computations of equilibrium microstructures. Journal of Geophysical Research: Solid Earth, 91(B9):9261–9276, 1986. ISSN 2156-2202. doi: 10.1029/JB091iB09p09261.
- Wada and Behn [2015] I. Wada and M. D. Behn. Focusing of upward fluid migration beneath volcanic arcs: Effect of mineral grain size variation in the mantle wedge. Geochemistry, Geophysics, Geosystems, 16(11):3905–3923, 2015. ISSN 1525-2027.
- Wada et al. [2011] I. Wada, M. D. Behn, and J. He. Grain-size distribution in the mantle wedge of subduction zones. Journal Of Geophysical Research, 116(B10):B10203, 2011. doi: 10.1029/2011JB008294.