Mode change of a gamma-ray pulsar, PSR J2021+4026
Abstract
A glitch of a pulsar is known as a sudden increase in the spin frequency and spin-down rate (frequency time derivative), and it can be caused by a sudden release of the stress built up in the solid crust of the star or pinned vortices in the superfluid interior. PSR J2021+4026 is the first pulsar that shows a significant change in the gamma-ray flux and pulse profile at the glitch that occurred around 2011 October 16. We report the results of timing and spectral analysis of PSR J2021+4026 using 8 yr Fermi-LAT data. We find that the pulsar stayed at a high spin-down rate ( higher than the pre-glitch value) and a low gamma-ray state ( lower) for about 3 yr after the glitch. Around 2014 December, the spin-down rate and gamma-ray flux gradually returned to pre-glitch values within a time scale of a few months. The phase-resolved spectra and pulse profiles after the relaxation are also consistent with those before the glitch. The observed long-term evolution of the spin-down rate and the gamma-ray flux indicates that the glitch triggered a mode change in the global magnetosphere. We speculate that the glitch changed the local magnetic field structure around the polar cap and/or the inclination angle of the dipole axis, leading to a change in the electric current circulating in the magnetosphere.
1 Introduction
The Fermi Large Area Telescope (hereafter Fermi-LAT) has found pulsed gamma-ray emission from more than 200 pulsars111https://confluence.slac.stanford.edu/display/GLAMCOG/Public+List+of+LAT-Detected+Gamma-Ray+Pulsars. Among them, PSR J2021+4026 is the only one that exhibits a mode change in the observed gamma-rays. Its gamma-ray detection was first discovered by Fermi-LAT in the first year of the Fermi mission (Abdo et al., 2009a) as a bright gamma-ray source (0FGL J2021.5+4026) in the Cygnus region of the Milky Way. A subsequent frequency search of the LAT data performed by Abdo et al. (2009b) confirmed that 0FGL J2021.5+4026 is a young pulsar with a spin period = 265ms and a spin-down rate of . The spin-down behavior infers a luminosity of , a characteristic age of kyr, and a surface dipole field of G. An X-ray counterpart (2XMMJ202131.0+402645) was identified by XMM-Newton (Trepl et al., 2010), and its X-ray emission was interpreted as emission from a hot spot on the surface (see Lin et al. 2013; Lin 2016 for detail).
Allafort et al. (2013, hereafter A13) reported a sudden drop in the gamma-ray flux of PSR J2021+4026. They found that a glitch occurred near MJD 55,850 (2011 October 16) with a timescale smaller than a week, and it increased the spin-down rate from to . At the glitch, (1) the flux (MeV) was decreased by %, from to , (2) the pulse profile was changed significantly (), and (3) the gamma-ray spectrum experienced a marginal change . Before the glitch, the pulse profile consisted of two strong peaks plus a small bump (probably a third peak) in the bridge region (BR). After the glitch, there was no evidence of the third peak, and the pulse profile was well fit by two Gaussian components. The glitch event caused the flux drop for all rotation phases, but the strongest main peak (the second peak in A13) only had a minor change in intensity compared to other pulse phases.
The Fermi-LAT enables us to study the detailed evolution of the gamma-ray emission after the glitch event. Ng et al. (2016) reanalyzed the long-term light curve of PSR J2021+4026 using 7 yr Fermi-LAT data. They confirmed that the gamma-ray flux did not show a gradual recovery toward the value before the glitch, and the pulsar stayed at the low-flux stage. However, they also noted another jump of the gamma-ray flux at about 3 yr (around MJD 57,000) after the glitch occurred near MJD 55,850. Although they speculated that this jump was caused by another glitch, they did not analyze the timing parameter beyond MJD 56,580.
In this paper, we revisit PSR J2021+4026 and carry out the timing and spectral analysis using Fermi-LAT data. We confirm that the pulsar stayed at a high spin-down rate (% higher than the value before the glitch) for about 3 yr. We show that after 3 yr (around 2014 December) both the spin-down rate and the gamma-ray flux returned to pre-glitch values within a time scale of a few months, indicating that the second flux jump noted by Ng et al. (2016) was caused by the relaxation rather than an anti-glitch of this system. In this article, we present the flux variability in section 2.1, the timing analysis in section 2.2, and pulse profile/phase-resolved spectra in section 2.3. In section 6, we discuss the mechanisms triggering the change of both the gamma-ray flux and the timing properties.
2 Observations
2.1 Flux variability
In the analysis of the flux variability, we use 101 months of Fermi-LAT data from 2008 August 11 to 2016 December 31, more than 1 yr of Ng et al. (2016). The data (latest version P8R2) that we select from the Fermi website222http://fermi.gsfc.nasa.gov/ssc/ are in a radius region of interest (ROI) centered at the 3FGL J2021.5+4026 position (R.A., Dec)= (Acero et al., 2015) with energies between 100 MeV and 100 GeV. We also collect all the events converting both in the front and the back sections of the tracker (i.e. evtype = 3), and the event class is specified for the analysis of a point source (i.e. evtclass = 128). In addition, we not only select those photons with zenith angles smaller than to reduce the gamma-ray contamination caused by Earth albedo, but we also select those data within time intervals determined as high quality (i.e. DATA_QUAL 0). All the aforementioned data reduction in this study was performed using the Fermi science tools v10r0p5 package.
The light curve of PSR J2021+4026 is obtained at MeV using the binned likelihood analysis in the science tools. First, we construct a background emission model, including the galactic diffuse emission (gll_iem_v06) and the isotropic diffuse emission (iso_P8R2_SOURCE_V6_v06) circulated by the Fermi Science Support Center and all 3FGL catalog sources (Acero et al., 2015) within of the the center of the ROI to account for the spectral contribution. We note that the best-fit spectra for all of the background sources were obtained with the elimination of insignificant sources () by using the gtlike tool of the science tools for 8 yr data. Next, we divide the entire time range into 30 day time bins. We fix the spectral contribution according to the background emission model and refit the flux (MeV) of the target pulsar by binned likelihood analysis. Then we can obtain the normalization constants in each time bin by estimating the photon flux of each background source.
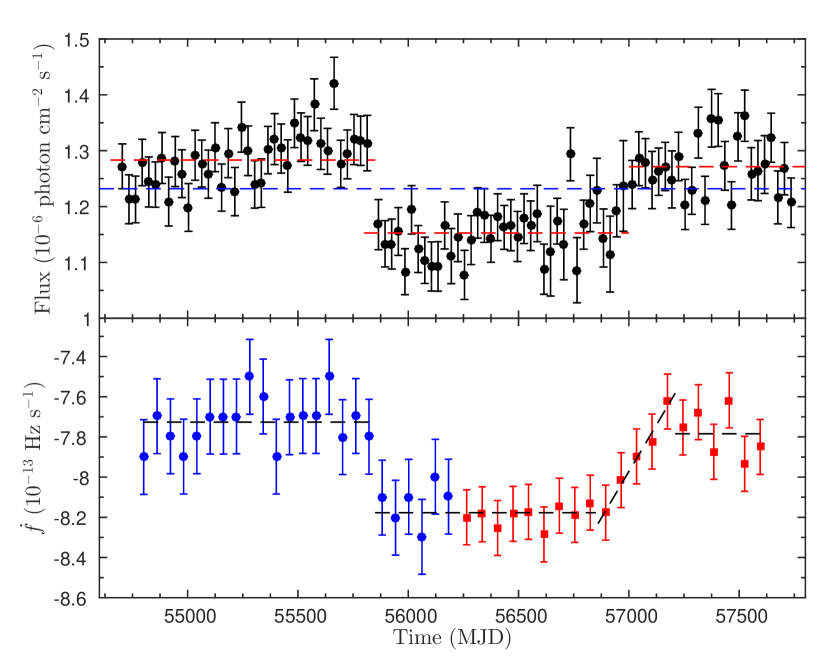
We obtain a time evolution of the photon flux for PSR J2021+4026 as shown in the top panel of Fig. 1. According to the flux level, the long-term light curve can be divided into three epochs/stages, which we define as (1) the pre-glitch stage before MJD 55,850, around which the glitch caused a sudden flux drop (A13); (2) the low-flux stage between MJD 55,850 and 57,000; (3) the post-relaxation stage after MJD 57,000, around which the gamma-ray flux returned to the value from before the glitch. The average fluxes for these stages (Table 1) are , , , respectively. The average fluxes obtained in the pre-glitch and low-flux stages are consistent with the results reported in A13 and Ng et al. (2016). As shown in the figure, the flux level of the post-relaxation stage after MJD 57,000 does not change significantly, and it is consistent with the pre-glitch value (within ), suggesting that the gamma-ray emission was returned to the pre-glitch stage.
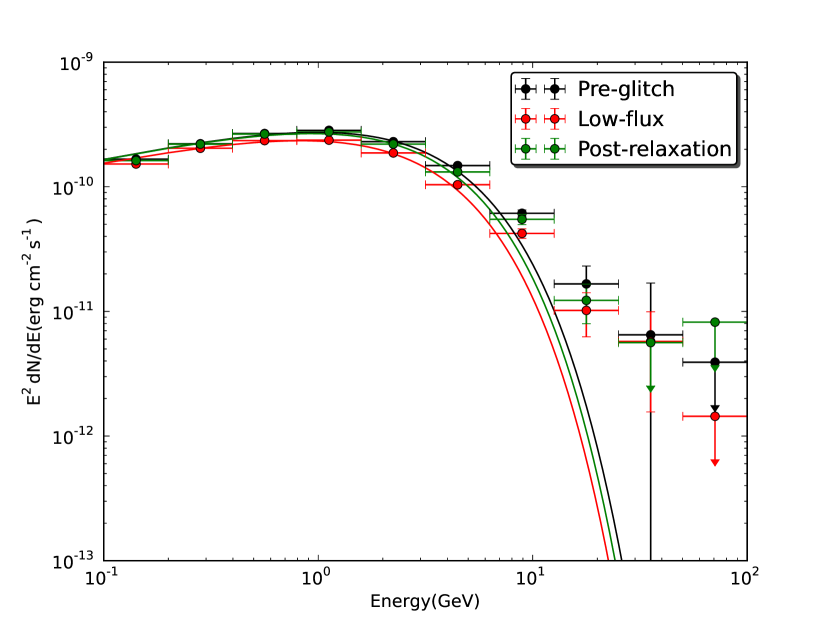
The gamma-ray spectra of PSR J2021+4026 are modeled using a power law with an exponential cutoff of the form
| (1) |
where is the number of photons per unit time, unit area and unit energy; is the energy of photons; is the normalization constant; is the scale factor of energy; is the spectral power-law index; and is the cutoff energy. In this paper, we apply for both the phase-averaged and phase-resolved spectra (section 2.3). Fig. 2 represents the phase-averaged spectra for the three different stages, and Table 1 summarizes their best-fit cutoff energy and power-law index. The parameters obtained for the post-relaxation stage are also consistent with those before the glitch at a 95% confidence level.
| Parameter | Pre-Glitch | Low-Glux | Post-Relaxation |
|---|---|---|---|
| Flux, | |||
| Cutoff energy, (MeV) | |||
| Power-law index, |
2.2 Timing analysis
PSR J2021+4026 is a variable gamma-ray pulsar (A13), and its ephemeris cannot be precisely described without considering the timing noise. According to the study of the photon flux for this target (section 2.1), we note that the emitted gamma-ray flux gradually recovered to the pre-glitch level, and this relaxation started from MJD 57,000. Since the drop in the gamma-ray emission was accompanied by a change in the pulse profile and a sudden decrease of the frequency derivative (i.e., ), the observed relaxation in the gamma-ray flux gives us a strong motivation to investigate the evolution of the timing ephemeris. In order to investigate the change in the structure of the pulse profile and the phase-resolved spectra, precise ephemerides for different states are required. To describe the timing behavior of PSR J2021+4026, we consider the ephemeris provided by the Fermi team333http://www.slac.stanford.edu/kerrm/fermi_pulsar_timing/J2021+4026/html/J2021+4026_54683_56587_chol.par and build local ephemerides of PSR J2021+4026 using the Fermi-LAT archive during MJD 55,850–56,950 and 57,050–57,570 to cover the entire low-flux and post-relaxation stages. More details are given in § 2.2.2. We also monitor the evolution of the pulsar timing with narrower time bins in § 2.2.1 to completely record a gradual recovery for the spin-down rate.
The position for all the ephemerides of PSR J2021+4026 is fixed at (J2000) R.A.=, decl.=, according to the image resolved by the Chandra/ACIS (Advanced CCD Imaging Spectrometer) with an uncertainty of (Weisskopf et al., 2011), and it is also the central position to extract the source events within radius ROI for our timing analysis.
2.2.1 Evolution of pulsar timing
To investigate the local evolution of timing behaviors following the change of the gamma-ray flux for PSR J2021+4026, we apply a method similar to that described in A13 to monitor the evolution of the pulsar timing parameters, and we extract the Fermi-LAT data from MJD 56,580–57,630, covering a part of the low-flux and the post-relaxation stages. All the data are divided into the 70-day bins, which have enough source photons to significantly detect the pulsation and can ignore/minimize the contamination of the high-order timing noises so that the frequency evolution can be simplified as a linear relation of , where , , and denote the spin frequency, frequency derivative, and epoch zero for each time bin, respectively. The epoch zero of each time bin is determined at the central point, and the spin frequency at such an epoch () is identified through the -test (de Jager & Büsching, 2010) and -test (; Buccheri et al. 1983) to examine the pulsation in a small blind-searching region of (, ) inferred from the ephemerides provided by the previous studies (Ray et al. 2011; Lin et al. 2013 and the Fermi team333http://www.slac.stanford.edu/kerrm/fermi_pulsar_timing/J2021+4026/html/J2021+4026_54683_56587_chol.par). The uncertainties of the measured spin frequency and its derivative are expected to be smaller than their Fourier width, Hz and Hz s-1, respectively. The evolution of the frequency derivative () obtained in A13 and this work is presented in the bottom panel of Fig. 1, and the accuracy of the measured timing parameters can be improved by the time-of arrival (TOA) analysis (Ray et al., 2011) of each individual time bin.
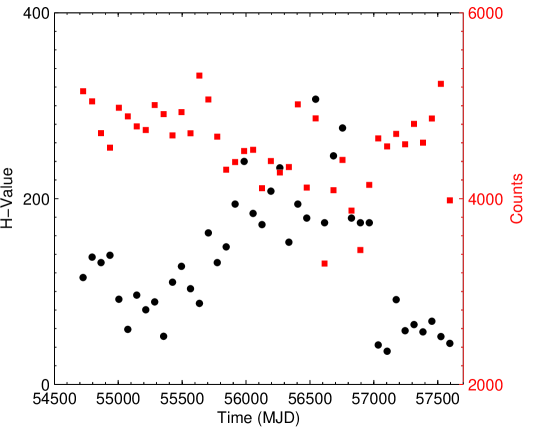
According to Fig. 1, we see the coincident change in the gamma-ray flux and the frequency derivative of the spin. Both sudden drops in the flux and the frequency derivative can be detected around MJD 55,850 and gradually returned to the original level passing the relaxation stage (i.e. MJD 56,950–57,050). If we do not account for the frequency derivatives detected during the relaxation stage, the average of the frequency derivatives assessed after the relaxation stage is Hz s-1, which is close to the pre-glitch value obtained in A13.We also investigate the evolution of the detection significance of the pulsation by comparing the -values of each time bin. As shown in Fig. 3, we can obviously find that the pulsation of PSR J2021+4026 is much more significant in the low-flux stage. During the low-flux stage (MJD 55,850-57000), the average number of gamma-ray events collected to the target within 70 days is only 4240, and it has a significant pulsation with an -value larger than 170. After the relaxation stage, the average number of photons extracted for PSR J2021+4026 are 4663 due to the increase of the gamma-ray flux, but most of the corresponding values are between 35–-65. Before the glitch, the average number of gamma-ray photons collected to the target within the same time interval is 4848, and the corresponding detection significance is still lower than that yielded in the low-flux stage. It may provide an indication that the pulse fraction in the low-flux stage is higher than that in the pre-glitch and the post-relaxation stages.
2.2.2 Ephemerides of PSR J2021+4026
The Fermi team provided a long-term ephemeris to cover the timing solution of PSR J2021+4026 within MJD 54,670–56,580, including the flux jump around MJD 55,850 mentioned in A13. To remove the effect of the timing noise, the pseudo-sinusoidal model is used to whiten the timing residuals (Hobbs et al., 2004).
Because we want to compare the change of timing parameters at different epochs, we build two local ephemerides to describe the timing behavior of PSR J2021+4026 in the low-flux and post-relaxation stages, while the high-order derivatives of the pulse frequency are served as the parameters to account for the contribution of the timing noise. At the beginning, we determine the spin parameters of PSR J2021+4026 including only the spin-frequency and the spin-down rate (i.e., and ) with a short time span of 100 days to avoid the influence of the accumulated timing noise. We build an initial template according to the Gaussian kernel density estimation (KDE) method (de Jager et al., 1986) provided in Ray et al. (2011). By cross-correlating the template with the unbinned geocentered data, the pulse TOAs can be determined to fit to an original timing model assumed from the semi-blind search (“semi” means that we just examined the pulsation of PSR J2021+4026 in the vicinity of the known timing solution). We polish the fit of the TOAs with TEMPO2 (Hobbs et al., 2006; Edwards et al., 2006). Once the timing residuals have been minimized, the data can be extended to cover a longer time interval to generate more TOAs in modifying timing parameters. If the fit has a significant aberration, we include a phase jump or more high-order terms for the description of the timing noise in order to polish the fit.
| Parameter | ||
|---|---|---|
| Right ascension, | 20:21:30.733 | |
| Declination, | +40:26:46.04 | |
| Valid MJD range | 55,857–56,943 | 57,062–57,565 |
| Pulse frequency, (s-1) | 3.7689669240(2) | 3.7689112482(6) |
| First derivative of pulse frequency, (s-2) | ||
| second derivative of pulse frequency, (s-3) | ||
| Third derivative of pulse frequency, (s-4) | ||
| Fourth derivative of pulse frequency, (s-4) | ||
| Epoch zero of the timing solution (MJD) | 56,400 | 57,200 |
| RMS timing residual (s) | 2199.970 | 2795.366 |
| Time system | TDB (DE405) | |
| Pre-glitch | Low-flux | Post-relaxation | ||
| Gaussian components | Threeccfootnotemark: | Twoccfootnotemark: | Twoddfootnotemark: | Threeddfootnotemark: |
| Peak 1aafootnotemark: | ||||
| Peak 2aafootnotemark: | ||||
| Peak 3aafootnotemark: | - | - | ||
| Peak 1/Peak 2bbfootnotemark: | ||||
| Peak 3/Peak 2bbfootnotemark: | - | - | ||
| /D.O.F. | 32.1/43 | 29.1/40 | ||
| a: FWHM | ||||
| b: Ratio of amplitude | ||||
| c: Allafort et al. (2013) | ||||
| d: This work | ||||
With such an iteration process, we finally generate two solutions including , and to describe the timing behavior of PSR J2021+4026 during MJD 55,850–56,950 (within the low-flux stage) and 57,050–57,570 (after the relaxation stage). The results are summarized in Table 2. We also note that these solutions cannot well describe the timing behavior during the relaxation stage (i.e. MJD 56,950–57,050). If we would like to slightly extend the local timing solution to cover the data epoch in relaxation, at least two more high-order polynomial terms are required to obtain an acceptable fit of the determined TOAs. This means that the data within the epoch of the relaxation stage (i.e. MJD 56,950–57,050) have an effect due to a real high-order timing term, a glitch, or serious short-term timing noises. The identification of the time range of the relaxation is consistent with the required time for PSR J2021+4026 to bring its gamma-ray flux back to the original level, as shown in Fig 1.
2.3 Pulse Profiles and Phase-Resolved Spectra
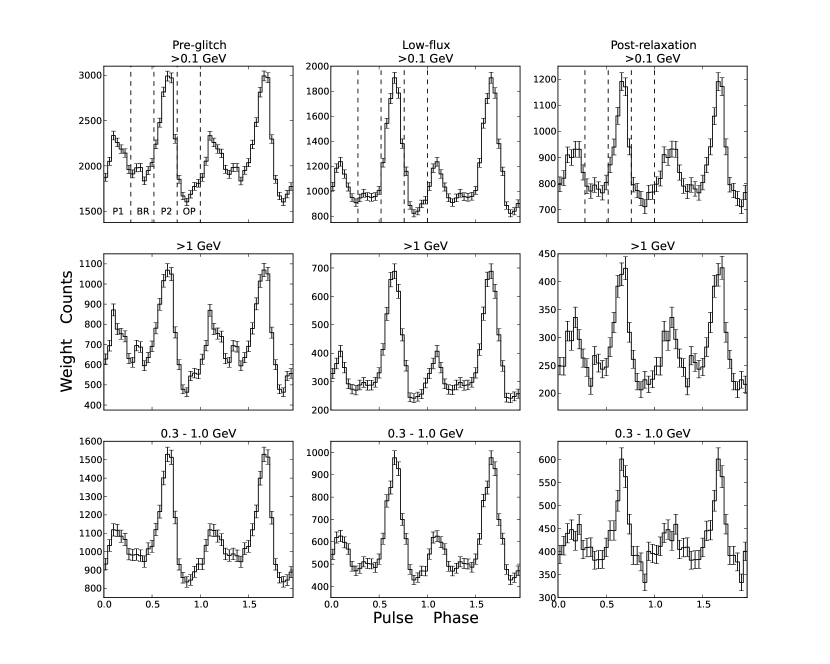
Using the timing solution provided by the Fermi team and the local ephemerides summarized in Table 2, we generate the pulse profiles with the Fermi archive for the pre-glitch stage, low-flux stage, and post-relaxation stage. We select photons within a 1∘ radius of the pulsar and produce pulse profiles using the best-fit spectrum to assign each photon a weight, which denotes the probability of a photon originating from the pulsar. We assigned the phase of each photon with timing solution provided by Fermi team for the pre-glitch and the low-flux stages and by Table 2 after the relaxation. The phase of each pulse profile is shifted to align the major/second peak for three different stages. Fig. 4 shows the energy-dependent pulse profiles in three stages.
A13 found that the GeV pulse profile shows a third peak in the bridge of the pre-glitch stage, and they described the profile with three Gaussian components. By contrast, two Gaussian fits were sufficient to describe the pulse profile of the low-flux stage (see Table 3). To compare with their results, we fit the pulse profile after the relaxation with two and three Gaussian components, and we present the parameters in Table 3. The null hypothesis probability in the -test to support the requirement of the third Gaussian component is less than 1, and we cannot conclude the recovery of a third component/peak at the BR after the relaxation. By comparing the fitting parameters at the pre-glitch and post-relaxation stages, however, we notice that the FWHMs (Full Width at Half Maximum) and the peak ratios of the three Gaussian components of the post-relaxation stage are consistent with those of the pre-glitch stage within a 1 level. We also note that the energy-dependent light curves of the post-relaxation stage are more consistent with those of the pre-glitch stage.
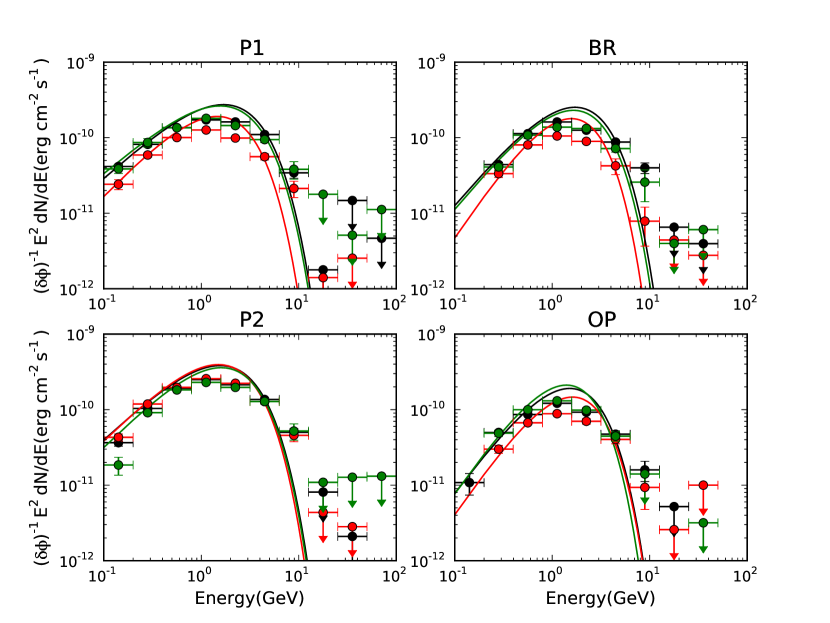
To determine the phase-resolved spectra for the three stages, we divide the profiles into four phase intervals: the first peak (P1), the BR, the second peak (P2) and the off-pulse region (OP) are defined by (P1, BR, P2, OP)=(0-0.28, 0.28-0.52, 0.52-0.76,0.76-1). For each phase, we determine the spectrum over 10 logarithmically distributed energy bins from 100 MeV to 100 GeV. If the detection significance is less than 3, an upper limit is given to describe the spectral behavior. We fit each spectrum with a power law plus an exponential cutoff function.
The Fig. 5 shows the phase-resolved spectra. We can see in Fig. 5 that the spectra of the post-relaxation stage (black) are more consistent with those of the pre-glitch stage (green), indicating that the structure of the particle-accelerating region was also recovered after relaxation. We also note that the variability of the second/major peak is significantly smaller than that of the other phases among the three stages.
3 Summary and Discussion
| PSRs | MJD | ||||||
| J | s | G | erg/s | yr | |||
| 0007+7303 | 54953 | 554 | 0.32 | 11 | 4.5 | 1.4 | |
| 0007+7303 | 55466 | 1260 | - | 0.32 | 11 | 4.5 | 1.4 |
| 1023-5746 | 55041 | 3560 | - | 0.11 | 6.6 | 110 | 0.46 |
| 1413-6205 | 54735 | 1730 | - | 0.11 | 1.8 | 8.3 | 6.3 |
| 1813-1246 | 55094 | 1166 | 6.4 | 0.048 | 0.9 | 62 | 4.3 |
| 1838-0537 | 55100 | 5500 | -15 | 0.15 | 8.4 | 60 | 0.49 |
| 1907+0602 | 55422 | 4660 | - | 0.11 | 3.1 | 28 | 2.0 |
| 1907+0602 | 55866 | 1.49 | -0.26 | 0.11 | 3.1 | 28 | 2.0 |
| 2021+4026 | 55850 | 24 | 0.27 | 3.9 | 1.2 | 7.7 | |
| 2032+4127 | 55821 | 276.2 | 0 | 0.14 | 1.4 | 1.7 | 18 |
We report the investigation of timing and spectral analysis with the Fermi-LAT data of PSR J2021+4026 after the glitch occurred around 2011 October 16. We show that the pulsar stayed at a high spin-down rate and a low gamma-ray flux state for about 3-yr after the glitch. Around 2014 December, the spin-down rate and all properties of the gamma-ray emission returned to the pre-glitch state within a time scale of a few months. Our spectral and timing analysis suggests that the pulsar magnetosphere suffered a state change triggered by the glitch in 2011 and returned to the pre-glitch state around 2014 December.
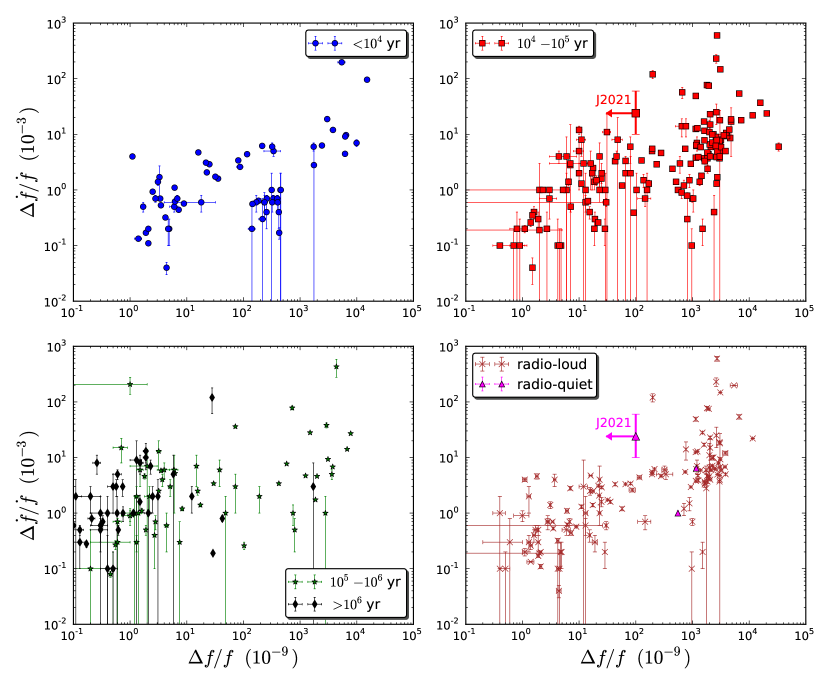
A glitch appears as an abrupt increase in the spin frequency, , and in the spin-down rate, , and it is usually observed with a size of and , respectively (Espinoza et al., 2011). More than 160 glitching pulsars have been confirmed444http://www.jb.man.ac.uk/pulsar/glitches.html, and about 50 Fermi-LAT pulsars have shown glitch events. The observed fractional glitch size shows a bimodal distribution (Wang et al., 2010; Espinoza et al., 2011; Yu et al., 2013) for which the first peak and second peak appear at and (see Fig. 6), respectively, suggesting two kinds of glitch mechanisms. It has been considered that the glitch of a pulsar is attributed to the release of stress buildup as a result of the steady spin-down. This stress is stored in the solid crust of a star (Ruderman, 1969; Baym and Pines, 1971; Haskell and Melatos, 2015) and/or on pinned vortices in the superfluid interior (Alpar et al., 1984; Haskell and Melatos, 2015). The crust rearrangement by the starquakes could induce the small glitches. However, the glitches of the Vela pulsar have been observed every 2 or 3 yr with a size of , which is too huge to be explained by the stress stored at recurrence time. It has been suggested that a sudden momentum transfer from a faster rotation interior superfluid to the solid crust is the origin of the observed large glitches.
For PSR J2021+4026, the apparent change in the spin frequency was not detected by the Fermi-LAT (see A13), but we may read the glitch size as from Fig. 2 and 3 in A13. We can see in Fig. 6 that old pulsars with a spin-down age yr mainly show a small glitch size with , while younger pulsars with yr exhibit the glitch sizes in a wide range of . With kyr of PSR J2021+4026, therefore, we cannot constrain the glitch mechanism from the relation in Fig. 6. The figure also shows that a relatively large jump in the spin-down rate () is mainly accompanied by a large glitch size (), indicating the origin of the angular momentum transfer from the superfluid to the solid crust. The glitch of PSR J2021+4026 was observed with a jump, (see A13), which is relatively large compared to glitches of the other pulsars with .
The bottom right panel of Figure 6 shows the glitch sizes of the -LAT gamma-ray pulsars; the crosses and triangles represent radio-loud and radio-quiet gamma-ray pulsars, respectively. Of the radio-quiet pulsars, only three (J0007+7303, J1813-1246 and J2021+4026) are presented, since for other sources has not been measured or cannot be presented in the figure (see Table 4). As Table 4 indicates, PSR J2021+4026 has the largest jump in the spin-down rate at the glitch, the smallest spin-down power, and a larger spin-down age compared to other glitching radio-quiet pulsars. By contrast, among all radio-quiet gamma-ray pulsars, PSR J2021+4026 has typical spin-down parameters. It may be worth noting that the observed gamma-ray-to-X-ray flux ratio of PSR J2021+4026 is the largest among the -LAT pulsars (Hui et al. 2017)
One of the intriguing properties of PSR J2021+4026 is that the gamma-ray flux drops at the glitch. A few pulsars exhibit a radiative event at the glitch. PSR J1119-6127 is the high-magnetic-field radio pulsar, and four glitches of this pulsar have been observed. The pulsar showed an additional component in the radio emission following a large-amplitude glitch (Weltevrede et al., 2011; Antonopoulou et al., 2015), as well as a magnetar-like X-ray burst in 2016 July, which was probably associated with a glitch (Archibald et al., 2016; Göğüş et al., 2016). Its pulsed radio emission disappeared after the burst and reappeared about two weeks after the event (Burgay et al., 2016; Majid et al., 2017). The pulsed gamma-ray emission also might be affected by this event (Tam, 2016). PSR J0742-2822 shows the radio pulse profile varying on a time-scale of decades (Lyne et al., 2010; Karastergiouet al., 2011), and it’s mode-switching is probably linked to glitch events (Keith et al. 2013) as well. These observations suggest some glitches affect the particle acceleration and emission processes in the pulsar magnetosphere.
Although the pulsars show a variety of the post-glitch recoveries (Yuan et al., 2010; Espinoza et al., 2011; Yu et al., 2013), the post-glitch behavior of PSR J2021+4026 is unique. Most of the glitches show a relaxation toward the timing solution extrapolated from the pre-glitch behaviors. Exponential changes in both and with time are often observed immediately after the glitch, and its time scale is days. The post-glitch relaxation of the Crab pulsar is described well by this exponential recovery. In a longer-term recovery, the post-glitch behavior is dominated by a linear increase of the spin-down rate , and this linear recovery sometimes continues until the next glitch. Because of the sensitivity of the Fermi-LAT, it is difficult to discuss whether PSR J2021+4026 showed an exponential recovery immediately after the glitch. In the long-term behavior, by contrast, the current result (Fig. 1) shows that the pulsar stayed at a high spin-down rate and a low gamma-ray flux state for about 3 yr after the glitch. This implies that the glitch event in 2011 October triggered a mode change in the spin-down rate and gamma-ray emission. It has been considered that the gamma-ray emission from the pulsar is produced in an acceleration region near the light cylinder (Abdo et al., 2009c);hence the observed coincident evolution in the spin-down rate and gamma-ray flux of PSR J2021+4026 (Fig. 1) suggests that the glitch event in 2011 October affected the magnetospheric structure around the light cylinder.
Several pulsars show that the glitch triggers a permanent change in the spin-down rate (); for examples, the Crab pulsar (Lyne et al., 2013, 2015) and PSRs B0144+59 and B0402+61 (Yuan et al., 2010; Yu et al., 2013). The permanent shift in spin-down rate may be a result of a change in the magnetic axis orientation, magnetospheric current flow and/or moment of inertia due to rearrangement of the crust (Ruderman et al., 1998; Antonopoulou et al., 2015). For PSR J2021+4026, a change in the moment of inertia will be limited by angular momentum conservation at the glitch , which will not affect the observed permanent change in the spin-down rate . With the gamma-ray flux drop, and therefore, the glitch of PSR J2021+4026 likely triggered the mode change of the global magnetosphere.
The glitch of the Crab pulsar has been observed with a permanent shift in the spin-down rate, and each glitch increases by an order of (Lyne et al., 2015). This could be interpreted as a consequence of the increase in the angle between the rotation axis and the magnetic axis. The low breaking index and the increase in the phase separation between the main pulse and interpulses of the Crab pulsar might be due to the increase in the magnetic inclination angle (Lyne et al., 2013, 2015).
Ng et al. (2016) stated that the permanent-like change in the spin-down rate of PSR J2021+4026 is due to the increase of the magnetic inclination angle. The spin-down luminosity of the force-free magnetosphere was shown by Spitkovsky (2006), and it is related to the magnetic inclination angle () as
| (2) |
where is the dipole momentum and . Replacing with , where is the moment of inertia of the neutron star, we find that the relative size in the spin-down rate can be expressed as
| (3) |
Assuming before the glitch of PSR J2021+4026, which was assumed in Ng et al. (2016) to fit the observed spectra and pulse profiles, the inclination angle was increased by .
Alternatively, we speculate that the glitch of PSR J2021+4026 could change the magnetic field structure in the polar cap region and subsequently cause a change in the magnetospheric current flow. The increase in the spin-down torque after the glitch may correspond to an increase in the current flow by an order of , where is the total current circulating in the magnetosphere. It has been discussed that the pair-creation process of the high-energy gamma rays maintains the global current circulating in the pulsar magnetosphere (Wada and Shibata, 2011; Yuki and Shibata, 2012). In the polar cap acceleration region, the current carriers are supplied by the magnetic pair-creation process and photon-photon pair-creation process (Daugherty and Harding, 1996). The mean-free path of the magnetic pair creation is expressed by
(Ruderman and Sutherland, 1975; Timokhin and Harding, 2015) with
where is the local magnetic field strength, G, is the energy of the photon, and is the angle between the propagation direction for the photon and the magnetic field. The mean-free path of the process depends exponentially on the field strength and propagation direction. If the glitch event of PSR J2021+4026 triggered the change in the magnetic field structure (dipole and/or multipole fields) of the polar cap region, the global current flow and hence the spin-down torque might be affected. Accordingly, such a change in the current flow can induce a stage change in the gamma-ray emission (Takata et al., 2016).
Our phase-resolved analysis (Fig. 5) shows that the variability of the second peak (P2) is significantly smaller than that of the other pulse phases among the three stages. Ng et al. (2016) demonstrated this behavior with the outer gap model. Within the framework of the outer gap model, this could be explained by the effect of three-dimensional geometry. The outer gap model expects that the particle accelerator and emission region extend from the null charge surface of the Goldreich-Julian charge density to the light cylinder along the magnetic field lines; the Goldreich-Julian charge density is defined by - (Goldreich and Julian, 1969) and the null charge surface corresponds to . The three-dimensional studies of the outer gap (Romani and Yadigalogru 1995; Cheng et al. 2000; Tang et al. 2008) have predicted that only emission around the light cylinder (radial distance ) makes the first peak, while the emission from various regions, , contributes to the second peak. Since the emission from a narrower range of radial distances contributes to the first peak and BR (maybe off-pulse emission), the change of the outer gap structure triggered by the glitch directly affects the observed emission. For the second peak, by contrast, the contributions of the emission from the various radial distances may reduce the effect of the state change of the outer gap on the observed spectrum.
Switching between discrete states of the magnetosphere may be common in pulsar populations. Some pulsars have shown abrupt changes between two states of the radio emission, so-called “mode-changing” or “null” (Wang et al., 2007), and PSR B0943+10 shows synchronous mode-switching between the radio and the X-ray emission (Hermsen et al., 2013; Mereghetti et al., 2016). Two emitting states for some pulsars have been observed with different spin-down states (Kramer et al., 2006; Lyne et al., 2010). For example, PSR B1931+24 is switching between radio-on and radio-off states lasting for days to weeks, in which the spin-down rate of the “on state” is a factor of 1.5 larger than that of the “off state”. The mode change in the radio emission has been interpreted as the state change of the magnetospheric current (Kramer et al., 2006), although its trigger has not been understood yet. PSR J2021+4026 may serve as another example of a mode change of the radiation due to the state change of the global magnetosphere, and a long-term monitoring of the timing parameter of this target may provide us a hint to understand the process of the mode change.
We thank the referee for the comments that improved this paper. JZ and JT are supported by NSFC grants of Chinese Government under 11573010, U1631103 and 11661161010. CWN and KSC are supported by GRF grant under 17302315. PHT is supported by the National Science Foundation of China (NSFC) through grants 11633007 and 11661161010. CYH is supported by the National Research Foundation of Korea through grants 2014R1A1A2058590 and 2016R1A5A1013277. AKHK is supported by the Ministry of Science and Technology of Taiwan through grant 105-2112-M-007-033-MY2, 105- 2119-M-007-028-MY3, and 106-2918-I-007-005. DCCY is supported by the Ministry of Science and Technology of Taiwan through grant 105-2115-M-030-005-MY2
References
- Abdo et al. (2009a) Abdo, A. A., Ackermann, M., Ajello, M., Atwood, W. B., Axelsson, M. et al., 2009a, ApJS, 183, 46
- Abdo et al. (2009b) Abdo, A. A., Ackermann, M., Ajello, M., Anderson, B., Atwood, W. B., et al., 2009b, Science, 325, 840
- Abdo et al. (2009c) Abdo, A. A., Ackermann, M., Atwood, W. B. , Bagagli, R. , Baldini, L., Ballet, J., Band, D. L., Barbiellini, G., Baring, M. G., Bartelt, J., et al., 2009c, ApJ, 696, 1084
- Acero et al. (2015) Acero, F., Ackermann, M., Ajello, M., Albert, A., Atwood, W. B. and Axelsson, M. et al., 2015, ApJS, 218, 23
- Allafort et al. (2013) Allafort, A., et al. 2013, ApJLetter, 777, L2
- Alpar et al. (1984) Alpar, M. A., Pines, D., Anderson, P. W. and Shaham, J., 1984, ApJ, 276, 325
- Antonopoulou et al. (2015) Antonopoulou, D., Weltevrede, P.. Espinoza, C. M., Watts, A. L., Johnston, S., et al., 21015, MNRAS, 447, 392
- Archibald et al. (2016) Archibald, R. F., Kaspi, V. M., Tendulkar, S. P. and Scholz, P., 2016, ApJLetter, 829, 21
- Baym and Pines (1971) Baym, G. and Pines, D., 1971, Annals of Physics, 66, 816
- Buccheri et al. (1983) Buccheri, R., et al. 1983, A&A, 128, 245
- Burgay et al. (2016) Burgay, M., Possenti, A., Sanna, A., Papitto, A., Burderi, L., 2016, The Astronomer’s Telegram, 90740
- Cheng et al. (2000) Cheng, K. S. and Ruderman, M. and Zhang, L., 2000, ApJ, 537, 964
- Daugherty and Harding (1996) Daugherty, J. K. and Harding, A. K., 1996, ApJ, 458, 278
- de Jager & Büsching (2010) de Jager, O. C., & Büsching, I. 2010, A&A, 517, L9
- de Jager et al. (1986) de Jager, O. C., Raubenheimer, B. C., & Swanepoel, J. W. H. 1986, A&A, 170, 187
- Edwards et al. (2006) Edwards, R. T., Hobbs, G. B., & Manchester, R. N. 2006, MNRAS, 372, 1549
- Espinoza et al. (2011) Espinoza, C. M., Lyne, A. G., Stappers, B. W. and Kramer, M., 2011, MNRAS, 414, 1689
- Goldreich and Julian (1969) Goldreich, P. and Julian, W. H., 1969, ApJ, 157, 869
- Göğüş et al. (2016) Göğüş, E., Lin, L., Kaneko, Y., Kouveliotou, C., Watts, A. L., et al., 2016, ApJLetter, 829, 25
- Haskell and Melatos (2015) Haskell, B. and Melatos, A., 2015, International Journal of Modern Physics D, 24, 15300
- Hermsen et al. (2013) Hermsen, W., Hessels, J. W. T., Kuiper, L., van Leeuwen, J., Mitra, D., et al., 2013, Science, 339, 436
- Hobbs et al. (2004) Hobbs, G., Lyne, A. G., Kramer, M., Martin, C. E., & Jordan, C. 2004, MNRAS, 353, 1311
- Hobbs et al. (2006) Hobbs, G. B., Edwards, R. T., & Manchester, R. N. 2006, MNRAS, 369, 655 bibitem[Hobbs et al.(2017)]hui17 Hui, C. Y. and Lee, J. and Takata, J. and Ng, C. W. and Cheng, K. S., 2017, ApJ, 834, 120
- Karastergiouet al. (2011) Karastergiou, A., Roberts, S. J., Johnston, S., Lee, H., Weltevrede, P. and Kramer, M., 2011, MNRAS, 415, 251
- Lin (2016) Lin, L. C. C., 2016, JASS, 33, 147
- Lin et al. (2013) Lin, L. C. C., et al. 2013, ApJLetter, 770, L9
- Kramer et al. (2006) Kramer, M., Lyne, A. G., O’Brien, J. T., Jordan, C. A. and Lorimer, D. R., 2006, Science, 312, 549
- Lyne et al. (2010) Lyne, A., Hobbs, G., Kramer, M., Stairs, I. and Stappers, B., 2010, Science, 329, 408
- Lyne et al. (2013) Lyne, A., Graham-Smith, F., Weltevrede, P., Jordan, C., Stappers, B., Bassa, C. and Kramer, M., 2013, Sci, 342, 598
- Lyne et al. (2015) Lyne, A. G., Jordan, C. A., Graham-Smith, F., Espinoza, C. M., Stappers, B. W. and Weltevrede, P., 2015, MNRAS, 446, 857
- Majid et al. (2017) Majid, W. A., Pearlman, A. B., Dobreva, T., Horiuchi, S., Kocz, J., et al., 2017, ApJLetter, 834, 2
- Mereghetti et al. (2016) Mereghetti, S., Kuiper, L., Tiengo, A., Hessels, J., Hermsen, W., et al., 2016, ApJ, 831, 21
- Ng et al. (2016) Ng, C. W., Takata, J. and Cheng, K. S., ApJ, 2016, 825, 18
- Ray et al. (2011) Ray, P. S., et al. 2011, ApJS, 194, 17
- Romani and Yadigaroglu, (1995) Romani, R. W. and Yadigaroglu, I.-A., 1995, ApJ, 438, 314
- Ruderman (1969) Ruderman, M., 1969, Nature, 223, 597
- Ruderman and Sutherland (1975) Ruderman, M. A. and Sutherland, P. G., 1975, ApJ, 196, 51
- Ruderman et al. (1998) Ruderman, M., Zhu, T. and Chen, K., 1998, ApJ, 502, 1027
- Spitkovsky (2006) Spitkovsky, A., 2006, ApJLetter, 648, 51
- Takata et al. (2016) Takata, J., Ng, C. W. and Cheng, K. S., 2016, MNRAS, 455, 4249
- Tam (2016) Tam, P. H. T., 2016, The Astronomer’s Telegram, 9365
- Tang et al. (2008) Tang, A. P. S. and Takata, J. and Jia, J. J. and Cheng, K. S., 2008, ApJ, 676, 652
- Timokhin and Harding (2015) Timokhin, A. N. and Harding, A. K., 2015, ApJ, 810, 144
- Trepl et al. (2010) Trepl, L, Hui, C. Y., Cheng, K. S., Takata, J., Wang, Y., Liu, Z. Y. and Wang, N., 2010, MNRAS, 405, 1339
- Wada and Shibata (2011) Wada, T. and Shibata, S., 2011, MNRAS, 418, 612
- Wang et al. (2010) Wang, N., Manchester, R. N., Pace, R. T., Bailes, M., Kaspi, V. M., Stappers, B. W. and Lyne, A. G., 2000, MNRAS, 317, 843
- Weltevrede et al. (2011) Weltevrede, P., Johnston, S. and Espinoza, C. M., 2011, MNRAS, 411, 1917
- Weisskopf et al. (2011) Weisskopf, M. C., et al., 2011, ApJ, 743, 74
- Wang et al. (2007) Wang, N., Manchester, R. N. and Johnston, S., 2007, MNRAS, 377, 1383
- Yu et al. (2013) Yu, M., Manchester, R. N., Hobbs, G., Johnston, S., Kaspi, V. M. et al., 2013, MNRAS, 429, 688
- Yuan et al. (2010) Yuan, J. P., Wang, N., Manchester, R. N., Liu, Z. Y., 2010, MNRAS, 404, 280
- Yuki and Shibata (2012) Yuki, S. and Shibata, S., 2012, PASJ, 64, 43