Characterization of the community structure in a large-scale production network in Japan
Abstract
Inter-firm organizations, which play a driving role in the economy of a country, can be represented in the form of a customer-supplier network. Such a network exhibits a heavy-tailed degree distribution, disassortative mixing and a prominent community structure. We analyze a large-scale data set of customer-supplier relationships containing data from one million Japanese firms. Using a directed network framework, we show that the production network exhibits the characteristics listed above. We conduct detailed investigations to characterize the communities in the network. The topology within smaller communities is found to be very close to a tree-like structure but becomes denser as the community size increases. A large fraction of firms with relatively small in- or out-degrees have customers or suppliers solely from within their own communities, indicating interactions of a highly local nature. The interaction strengths between communities as measured by the inter-community link weights follow a highly heterogeneous distribution. We further present the statistically significant over-expressions of different prefectures and sectors within different communities.
pacs:
89.65.Gh, 89.75.Hc, 89.65.-sI Introduction
At the mesoscopic level, many real-world networks exhibit community structures, i.e., structures consisting of groups of nodes that are highly connected among themselves and sparsely linked with the other nodes in the network Girvan and Newman (2002); Krause et al. (2003). These communities are the building blocks of the network and play pivotal roles in its functional activities or dynamic processes. For example, in metabolic networks, the communities represent functional groupings of metabolites based on their pathways Guimera and Amaral (2005), whereas the community structures in air traffic networks represent actual travel patterns Rosvall et al. (2014). Community structure has diverse applications. It can be used as the basis of an efficient mirror server for achieving better performance on the World Wide Web Krishnamurthy and Wang (2000), in the design of powerful recommendation systems Reddy et al. (2002) and also to identify the characteristic features of nodes in subnetworks.
Over the past decade, extensive studies have been conducted on algorithms for detecting communities Fortunato (2010); Newman (2012) in which the number of communities is not required to be fixed a priori, as in graph partitioning problems Kernighan and Lin (1970). Many algorithms have been proposed for community detection, and two recent popular techniques are based on modularity optimization Newman and Girvan (2004); Newman (2004) and the diffusion dynamics in a network Rosvall and Bergstrom (2007, 2008). The modularity is the fraction of intra-community links minus the expected fraction given a random distribution. The Newman–Girvan community detection algorithm Newman and Girvan (2004) is a modified divisive clustering technique that finds the best partitioning scheme with the optimal modularity using the edge betweenness of the network as a metric. This algorithm is very effective in detecting communities, but it is numerically expensive and has limited applicability to small-scale networks. Another algorithm Clauset et al. (2004), using an agglomerative hierarchical clustering approach with greedy optimization of the modularity, has subsequently been proposed for detecting communities in a large-scale network with one million nodes and links. Whereas community detection via modularity maximization is based solely on the topology of the network, another popular technique for community detection known as “Infomap” Rosvall and Bergstrom (2007, 2008) uses the diffusion dynamics in the network. A simple random walk is used to model the diffusion process or information flow in the network. It is observed that a random walker spends a longer time within certain subunits of a network. These subunits are the communities of the network. Note that the definition of a community in this method is different from that in the modularity maximization method. This technique can capture more complex structures in the network than can techniques based solely on the network topology. Initially, Infomap was proposed for identifying the two-level partitioning of a network that minimizes the two-level map equation. Later, the two-level map equation was generalized to the hierarchical map equation, which provides a hierarchical partitioning of a network Rosvall and Bergstrom (2011). Whereas modularity-maximization-based techniques are more applicable to networks that contain links that represent pairwise relationships, Infomap is more suitable for networks with flows between nodes Rosvall and Bergstrom (2008).
Although substantial efforts have been devoted to community detection, only a few studies Lancichinetti et al. (2010); Tumminello et al. (2011, 2012); Vitali and Battiston (2014); Marotta et al. (2015, 2016) have characterized the community structure. Here, we characterize the communities in a large-scale production network with one million nodes and links. Like many social and technological networks, a production network exhibits a prominent community structure Fujiwara and Aoyama (2010); Iino et al. (2010); Iino and Iyetomi (2015). A production network represents the interactions between firms. It constitutes the backbone of an economy in the form of flows of goods and services. Each firm buys intermediate goods from upstream firms for its production, and thus, relationships between firms develop through customer-supplier connections. The typical topological characteristics of a production network include a scale-free degree distribution, a small-world nature and disassortative mixing Fujiwara and Aoyama (2010); Mizuno et al. (2014). The structure of a production network plays an important role in the origin of business cycles and aggregate fluctuations, as shown by Acemoglu et al. considering the input-output network of sectors Acemoglu et al. (2012). They showed that the asymmetry characterizing the degree distribution of the network is the main cause of large-scale fluctuations in economic systems. Although they found a scale-free nature of the degree distribution characterized by a power law in the input-output network of U.S. industries, such scale-free nature can disappear when one considers higher levels of coarse-grained input-output networks Cerina et al. (2015), which in turn can give an incorrect impression about the underlying network topology. In our work, we study the network structure at the firm level, which might be of further importance in macroeconomic phenomena. Previous studies on Japanese production networks based on modularity maximization have shown that the subcommunities are characterized by geographical regions and sectors Iino et al. (2010); Iino and Iyetomi (2015). It has also been observed that directed and undirected versions of the same network yield similar results. Because the links in a production network represent the flow of goods and services from one firm to another, it is more appropriate to use the Infomap algorithm for community detection. Moreover, a rigorous, statistically significant characterization of the communities in production networks remains to be conducted.
In this paper, we analyze nationwide inter-firm relationship data from Japan. This data set contains data representing one million firms and their customer-supplier relationships. We construct a directed network in which firms are represented by nodes and directed links are present from each supplier firm to its customers. We calculate the standard structural metrics of the network to capture the global properties of the system. By employing the Infomap algorithm, we reveal the community structure of the production network. The community structure of the directed network of these firms is found to be distinctly different from that of its undirected counterpart. The topological features within and among communities indicate a non-trivial local structure of the network. By defining a weighted directed coarse-grained network in which the nodes represent the identified communities and the numbers of customer-supplier relationships between communities are treated as link weights, we observe a high heterogeneity of the inter-community interactions. Furthermore, in this study, we propose a deeper characterization of the properties of the communities (prefectures and sectors) derived using a rigorous statistical procedure, as prescribed in Tumminello et al. (2011).
II Data
Our data consist of firms and distinct links representing customer-supplier relationships between firms throughout Japan for the year 2016. The data set is commercially available from Tokyo Shoko Research (TSR), Inc., one of the leading credit research agencies in Japan. TSR collects firms’ credit information through investigations of financial statements and corporate documents as well as through oral surveys at branch offices located across the country. The data set contains the precise geographic locations and sectorwise classifications of the firms.
We use a prefecture-based division of all regions to analyze our data. All prefectures are listed in Appendix A. To see whether the sectors to which different firms belong play any role in community formation, we use the Japan Standard Industrial Classification111http://www.soumu.go.jp/toukei_toukatsu/index/seido/sangyo/, which divides all the firms into 98 major groups. All 98 major sectors are listed in Appendix B.
III Results
We reveal the detailed topological features of the Japanese production network. To define the network, each firm is treated as a node, and a directed link of the form indicates that is a supplier firm for firm . The structure of the production network exhibits a number of empirical patterns, which we present in the following subsections.
III.1 Structural properties of the production network
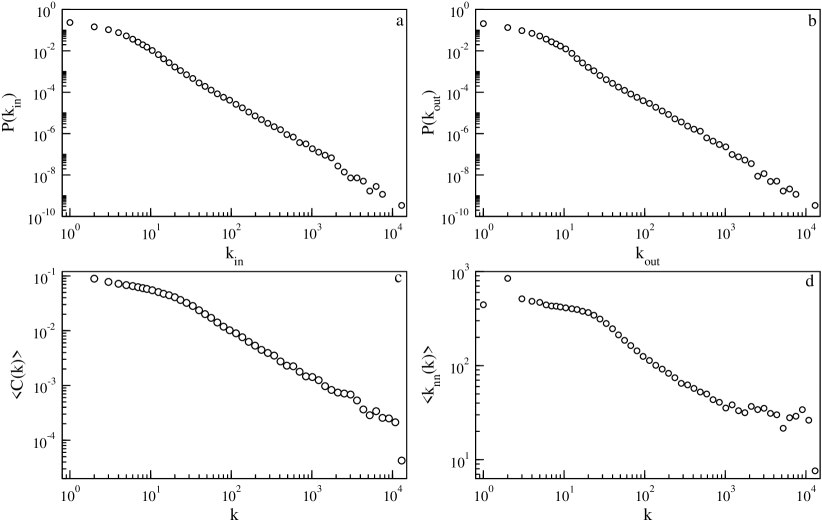
The links in the production network are directed in nature, which allows us to characterize the nodes in terms of their in- and out-degrees. The in-degree and out-degree of a node represent its numbers of suppliers and customers, respectively. We observe that both the in-degree and out-degree distributions have a heavy-tailed nature, as shown in Fig. 1 (a-b). It is also observed that the in- and out-degrees of the nodes are positively correlated. The heavy-tailed behavior of the degree distribution reflects the fact that production network has a large number of firms with few suppliers or customers and a smaller number of firms with many suppliers or customers. Both the in-degree and out-degree show a positive and significant correlation with the firm size measured by using either its net sales or total numbers of employees Fujiwara and Aoyama (2010). Because large firms generally have more suppliers and customers than small firms, the rich-get-richer principle is the key to such a power law nature of the degree distributions Barabási and Albert (1999); Chakraborty and Manna (2010). Because of the high asymmetry in the degree distributions of the underlying network, aggregate fluctuations can appear in the system due to idiosyncratic shocks to large firms Acemoglu et al. (2012).
We further investigate the cliqueness among neighbors and the mixing properties of the network considering undirected links. The cliqueness among the neighbors of a node is measured by the clustering coefficient, which is also a measure of the three-point correlations among neighboring nodes. As seen from Fig. 1 (c), the clustering coefficients for the production network decay with implying the presence of a hierarchical structure in the network. The mixing patterns of the nodes are measured by the average degree of an arbitrary neighbor of a node of degree . Fig. 1 (d) shows that decreases as increases, indicating a disassortative nature of the network, i.e., nodes of higher degrees are connected to nodes of lower degrees. This finding reflects the fact that large firms are generally connected with small firms.
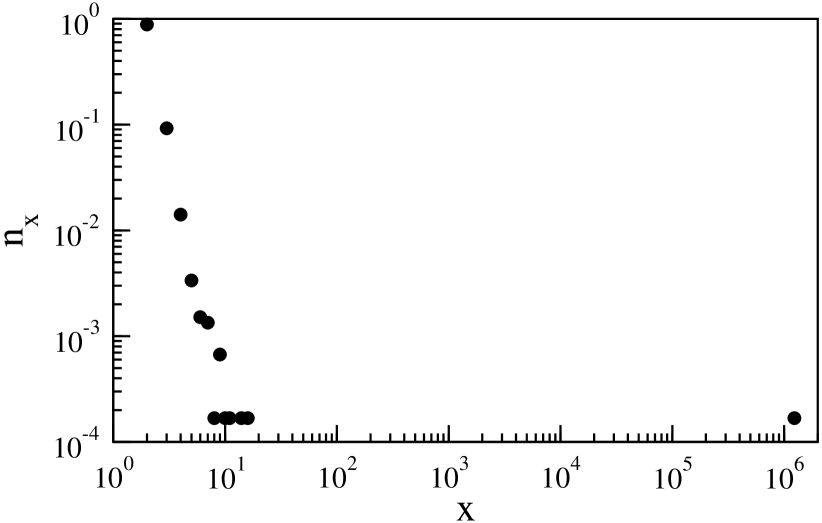
The component size distribution is another important property of the network. The component size is defined as the number of nodes in a subnetwork in which at least one path exists between any arbitrary pair of nodes. It is observed that of the nodes are contained within the largest weakly connected component of the network, whereas the sizes of the other components are very small, as shown in Fig. 2. More precisely, the largest weakly connected component contains nodes and links.
III.2 Community structure of the production network
Although the structural properties discussed above are important for obtaining a general understanding of the system, a complex network such as this one also exhibits a far more complex pattern, namely, a community structure. We perform a community detection analysis on the largest weakly connected component of the production network, considering directed links. We use the hierarchical map equation Rosvall and Bergstrom (2011) to discover the community structure because this method is very efficient for large-scale complex networks and is also applicable to directed networks. In this procedure, a random walker is used as a proxy for the flow of goods and services between firms in the production network, and the algorithm identifies the best hierarchical partitioning with the shortest average per-step description length (code length) for the random walker.
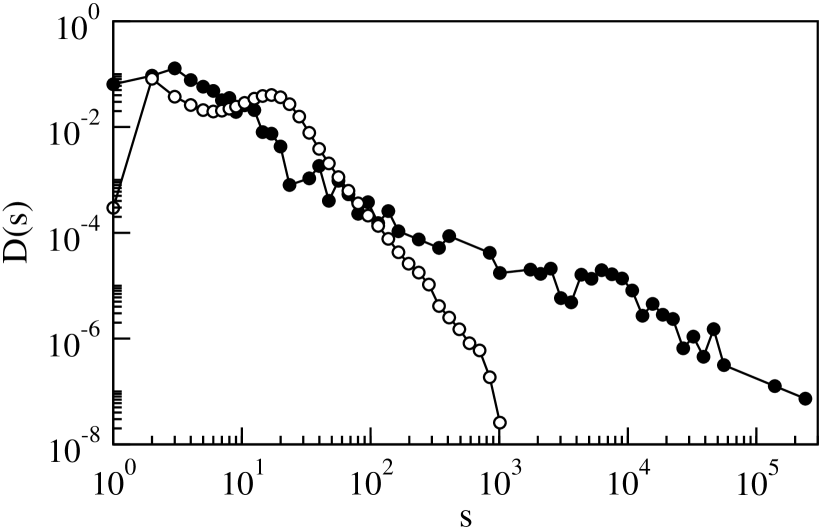
The analysis of the empirical production network reveals communities and inter-community links at the top community level with a code length of . To determine the statistical significance of our result, we compare it with the result obtained from an identical analysis of a ‘null model’, which is a random network with the same nodal degree values and . Following the the method of configuration models Newman (2010), we construct the randomization version of the empirical network using a pair-wise link exchange technique with the constraint of no multiple links between any pairs of nodes. In stark contrast with the empirical result, the randomized version of the empirical network is found to contain communities and inter-community connections with a code length of . The results are averaged over 10 uncorrelated random networks. As seen from Fig. 3, the community size distributions for the empirical network and the randomized version of the empirical network are found to be distinctly different in nature. Whereas the empirical network has a broad distribution of community sizes with a wide range of values spanning several orders of magnitude, the randomized version of the empirical network has a comparatively narrow distribution, in which the largest community size is . We further compare the community structure of the directed network of firms with that of its undirected counterpart. In the undirected network, we find only communities with distinct and widely varying sizes (not shown), which is smaller than the number of communities in the directed network. This difference in the community structure findings between the directed and undirected versions of the production network arises because Infomap allows the random walker to move only unidirectionally on directed links and permits two-way movement on undirected links. A random walker on an undirected network can move from one sub-region of the network to another sub-region with a transition probability proportional to the total number of connected links between the two sub-regions. For the same movement on the directed version of the network, the transition probability is proportional to the total number of outgoing links from one region to another. Clearly, the transition probability for the movement between sub-regions is always higher on an undirected network than on its directed counterpart. For this reason, in many cases, distinctly different communities in directed networks can be merged with the same community in an undirected network. As a result, we find more communities of smaller size on directed networks than on the undirected version of the network. This is not a very special case with the production network. The only distinct property of our network is the low fraction () of the bi-directional links. The directed version of the production network shows different community structure from its undirected counterpart because of a low fraction of bi-directional links.
III.2.1 Topological features of communities in the production network
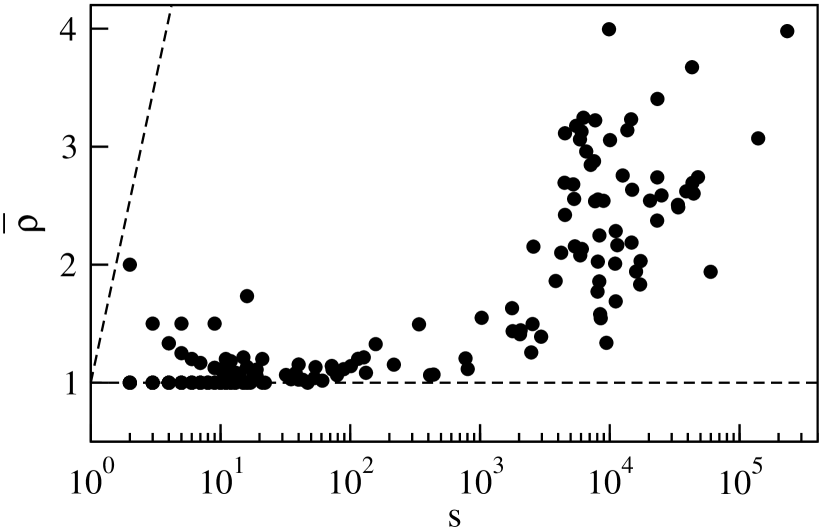
We investigate the topological features within each community in the production network. The link density within a community is the ratio of the number of internal links to the maximum possible number of links. The link density within a community of size can be calculated as , where is the number of links within the community. The scaled link density within a community is defined as . A value of corresponds to a community with a tree-like structure with unidirectional links, and corresponds to a complete graph structure, i.e., a structure in which every node is connected to all other nodes in the community. Fig. 4 shows a scatter plot of the scaled link density versus the community size . It is evident that the network structures within the communities are far from being complete graph structures; indeed, they are very close to an ideal tree-like structure when the community size is small . However, beyond , the scaled link density gradually increases as the community size increases.
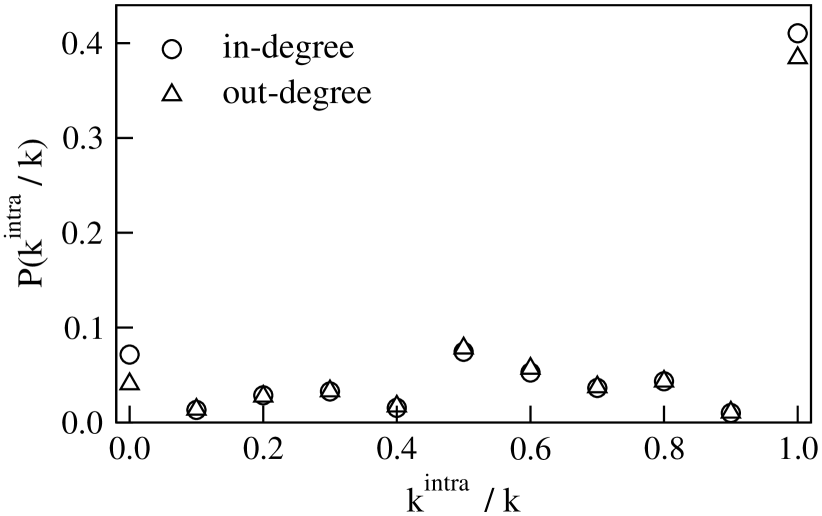
Next, we study the fraction of the neighbors of a node that belong to its own community. We find this fraction separately for the in-degree () and out-degree () of the node. The probability distributions for the fraction of suppliers () and the fraction of customers () of a node that belong to its community are shown in Fig. 5. The two distributions are very similar in nature and have a maximum value of at , meaning that for of the firms, all suppliers and customers of a firm belong to own community. We further observe that these firms have very small () in- or out-degrees. This result reflects the fact that for a large proportion of firms, their interactions are confined within a local region.
| Rank | Size | Over-expression of sectors | Over-expression of prefectures |
|---|---|---|---|
| 1 | 233, 294 | Manufacturing, Electronics, Water transport, Wholesale, etc. | Urban prefectures (Tokyo and its neighboring prefectures, Osaka, Aichi, Hyogo, etc.) |
| 2 | 139, 380 | Agriculture, Food, Fisheries, Road freight transport, Cooperative associations, N.E.C., etc. | Rural prefectures (Aomori, Miyagi, Shizuoka, etc.) |
| 3 | 59, 906 | Construction, Real estate, Banking, etc. | Tokyo and its neighboring prefectures, Osaka |
| 4 | 47, 849 | Manufacture of textiles, rubber, leather, etc. | Tokyo, Osaka, Kyoto, Aichi, etc. |
| 5 | 44, 349 | Medical services, Research institutes, Chemical products, etc. | Hokkaido, Tokyo, Hiroshima, etc. |
| 6 | 43, 397 | Retail trade (machinery and equipment), Automobile maintenance, Transport, Insurance institutions, etc. | Many (22) prefectures |
| 7 | 43, 018 | Multiple sectors | Hokkaido |
| 8 | 38, 819 | Multiple sectors | Tokyo |
| 9 | 33, 654 | Information services and many others | Tokyo, Kanagawa, Osaka |
| 10 | 33, 563 | Construction and others | Gifu, Aichi, Mie |
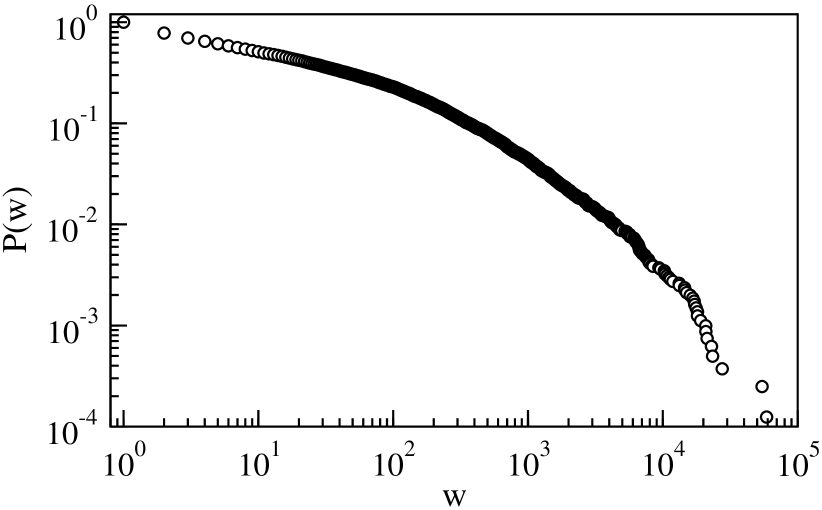
An inter-community link indicates that at least one customer-supplier relationship exists between the members of the two linked communities. These links are directed, and the corresponding in- and out-degree distributions exhibit very different behaviors compared with the original network. We also investigate the link weights of the inter-community links, where a link weight is defined based on the total number of customer-supplier relationships between members of the two linked communities. Fig. 6 shows the complementary cumulative distribution function of the inter-community link weights , which is heavy tailed in nature. However, A power-law fit to the data using the maximum likelihood estimation technique Clauset et al. (2009) yields with , , and . The low implies that the distribution is not a power law. The distribution of the inter-community link weights indicates highly heterogeneous relationships between the communities in the production network.
III.2.2 Over-expression of node attributes in the production network
Most real-world networks are characterized by a community structure. However, the factors that influence such clustering of nodes are different for different systems. For example, the community structure of a social network for mobile phone communications shows that people speaking the same language belong to the same community Blondel et al. (2008), biological functions play a key role in forming communities of proteins in yeast Chen and Yuan (2006), and in stock markets, communities present similarities in the economic sectors of the stocks Onnela et al. (2003). The communities in a network are mainly formed following the principle of homophily. We use the over-expression analysis to characterize the communities. The study helps one to understand the basis of forming communities that have particular attributes. We consider geographical and sector attributes; however, in general, one can take any attributes.
We investigate the over-expression of different prefectures or sectors within a community following the procedure used in Tumminello et al. (2011). The probability that randomly selected elements from a cluster of size will have attribute is measured by the hypergeometric distribution
, where represents the total number of elements with attribute in the system. If is the number of elements in cluster with attribute , then one can calculate an associated p value:
The attribute is over-expressed within a community if is smaller than some threshold value . We must choose appropriately to exclude false positives since we are considering a multiple-hypothesis test. We set , as used in Tumminello et al. (2011), which is sufficient for Bonferroni correction Miller Jr (1981).
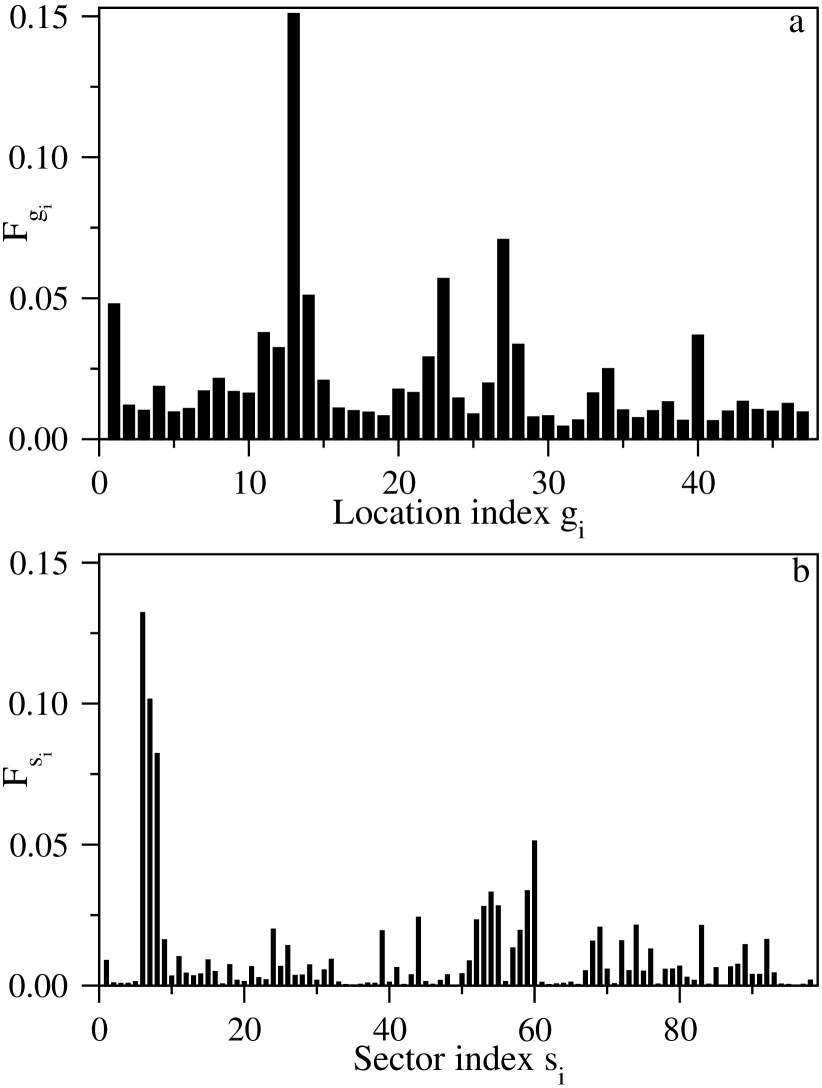
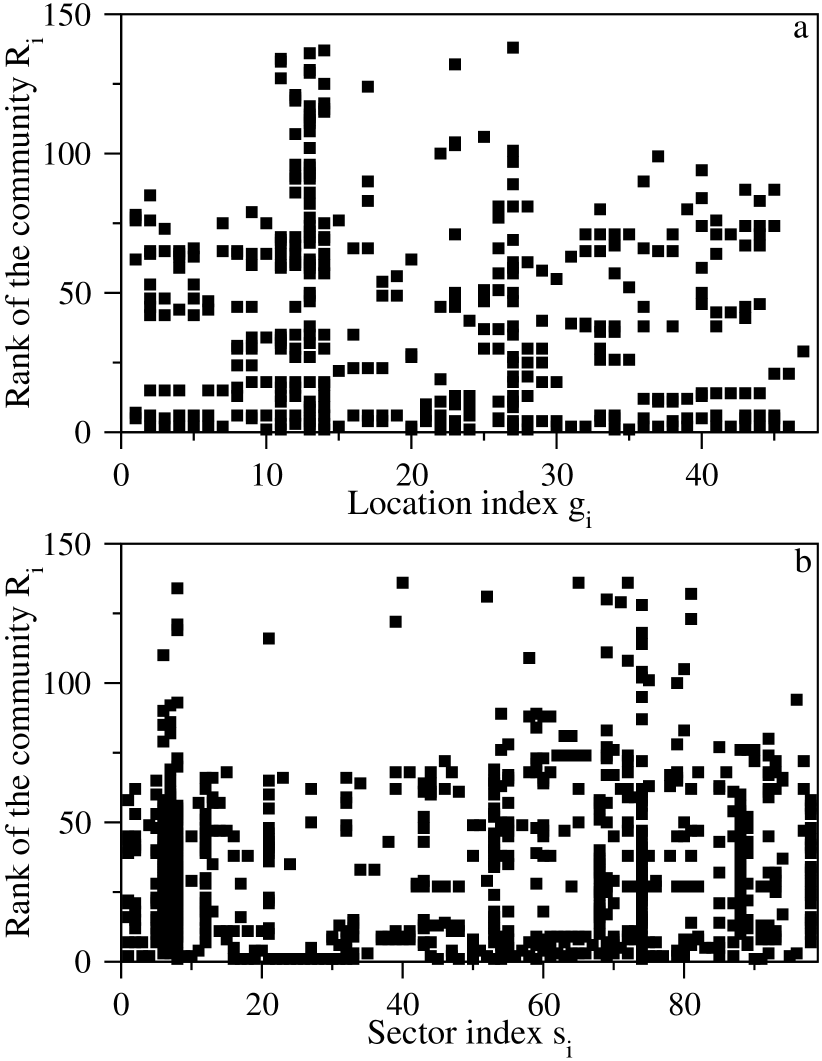
In our study, denotes the total number of possible attributes and takes on values of and for the prefecture- and sector-based attributes, respectively. Fig. 7 (a) shows the fraction of firms belonging to each prefecture, . The largest proportion of the firms belong to Tokyo, the capital of Japan. Fig. 7 (b) shows the fraction of firms belonging to each sector, . The largest proportion of the firms belong to the general construction work sector, which includes both public and private construction work. The over-expression of prefectures and sectors within individual communities consisting of at least 10 firms is visualized in Fig. 8. Prefectures are over-expressed within communities in the production network, and sectors are over-expressed within communities. A brief summary of the over-expression of prefectures and sectors in the ten largest communities is tabulated in Table 1, and the details are given in Appendix C. Our investigation reveals that the largest community is characterized by the over-expression of manufacturing sectors and urban prefectures. The agriculture, food, and fisheries sectors and rural prefectures are the defining characteristics of the second-largest community. The third-largest community is characterized by the construction, real estate, and banking sectors and by Osaka and Tokyo and its neighboring prefectures. The fourth-largest community is mainly characterized by the manufacturing sectors of textiles, rubber, and leather. Medical and other health services constitute the most distinctive feature of the fifth-largest community. Retail trade (machinery and equipment) and automobile maintenance services dominate the sixth-largest community. Hokkaido is the only over-expressed prefecture in the seventh-largest community, whereas the eighth-largest community is strongly associated with Tokyo. Only three prefectures — Tokyo, Kanagawa, and Osaka — are over-expressed in the ninth-largest community, and three different prefectures — Gifu, Aichi, and Mie — are the distinctive features of the tenth-largest community. It is observed that for a given community, its over-expressed sectors are strongly related to its over-expressed prefectures. We also note that even if the extent to which an attribute is present in the system as a whole is very small, it may be over-expressed in a particular community. For example, the banking sector is represented by only banks in our data set, but this sector is over-expressed in the third- and ninth-largest communities. We conclude that different communities are characterized by distinct features related to different sectors and prefectures.
IV Conclusion
We have studied a large-scale production network in Japan that exhibits a heavy-tailed degree distribution, hierarchical clustering and disassortative mixing, consistent with previous studies Fujiwara and Aoyama (2010); Mizuno et al. (2014). We have delved deeper into the data using the Infomap technique to detect the communities within the network. This production network contains many communities of highly heterogeneous sizes and with a wide range of values of the link weights between them. The community structures identified in the directed and undirected versions of the network display distinct behaviors. Smaller communities tend to have tree-like structures, whereas larger communities have higher link densities. A large fraction () of the firms in the production network have suppliers or customers only from within their own communities. We have also characterized the communities based on the over-expression of geographical locations and sectorial classifications.
The topological properties of a network play a crucial role in dynamical processes. Our analysis presents the backbone that can be utilized to study any agent based modeling to explain economic phenomena. Our analysis further shows sectorial and regional attributes of firms have an important role in forming communities. This indicates the network structure of firms is neither random nor because of the preferential attachment rule Barabási and Albert (1999). A future research in this direction will be to model the production network that shows community structure with homophily in industrial sectors and regions. This study has an application to understand the business cycle correlations in production network Krichene et al. (2017).
Our results suggest several interesting topics for future economic research. In this study, we have characterized the communities only at the top community level. One could generalize the applied technique to characterize the communities at all levels. A bottom-up structural analysis of the Japanese economy would be helpful for better understanding its complexity. Thus, future economic research seeking to understand GDP fluctuations, inflation and monetary stability should evaluate the Japanese economy at the microscopic level. Accordingly, future studies should investigate the roles and risks of the largest firms to yield an understanding of economic shock and driven systemic risk.
ACKNOWLEDGMENTS
This research was supported by MEXT as Exploratory Challenges on Post-K computer (Studies of Multi-level Spatiotemporal Simulation of Socioeconomic Phenomena), and the Grant-in-Aid for Scientific Research (KAKENHI) by JSPS Grant Number 17H02041. We thank Hideaki Aoyama, Hiroshi Iyetomi and Yuichi Kichikawa for useful discussions on Infomap.
APPENDIX A: GEOGRAPHICAL ATTRIBUTES OF FIRMS
Here we list the prefectures in Japan with their index, that we have used for our study:
1. Hokkaido, 2. Aomori, 3. Iwate, 4. Miyagi, 5. Akita, 6. Yamagata, 7. Fukushima, 8. Ibaraki, 9. Tochigi, 10. Gunma, 11. Saitama, 12. Chiba, 13. Tokyo, 14. Kanagawa, 15. Niigata, 16. Toyama, 17. Ishikawa, 18. Fukui, 19. Yamanashi, 20. Nagano, 21. Gifu, 22. Shizuoka, 23. Aichi, 24. Mie, 25. Shiga, 26. Kyoto, 27. Osaka, 28. Hyogo, 29. Nara, 30. Wakayama, 31. Tottori, 32. Shimane, 33. Okayama, 34. Hiroshima, 35. Yamaguchi, 36. Tokushima, 37. Kagawa, 38. Ehime, 39. Kochi, 40. Fukuoka, 41. Saga, 42. Nagasaki, 43. Kumamoto, 44. Oita, 45. Miyazaki, 46. Kagoshima, 47. Okinawa.
APPENDIX B: SECTORIAL ATTRIBUTES OF FIRMS
Here we list the major sectors in Japan with their index using Japan Standard Industrial Classification:
1. Agriculture, 2. Forestry, 3. Fisheries, except Aquaculture, 4. Aquaculture, 5. Mining and quarrying of stone, 6. Construction work, general including public and private construction work, 7. Construction work by specialist contractor, except equipment installation work, 8. Equipment installation work, 9. Manufacture of food, 10. Manufacture of beverages, tobacco and feed, 11. Manufacture of textile products 12. Manufacture of lumber and wood products, except furniture, 13. Manufacture of furniture and fixtures 14. Manufacture of pulp, paper and paper products, 15. Printing and allied industries, 16. Manufacture of chemical and allied product, 17. Manufacture of petroleum and coal products, 18. Manufacture of plastic products, except otherwise classified, 19. Manufacture of rubber products, 20. Manufacture of leather tanning, leather products and fur skins, 21. Manufacture of ceramic, stone and clay products, 22. Manufacture of iron and steel, 23. Manufacture of non-ferrous metals and products, 24. Manufacture of fabricated metal products, 25. Manufacture of general-purpose machinery, 26. Manufacture of production machinery, 27. Manufacture of business oriented machinery, 28. Electronic parts, devices and electronic circuits, 29. Manufacture of electrical machinery, equipment and supplies, 30. Manufacture of information and communication electronics equipment, 31. Manufacture of transportation equipment, 32. Miscellaneous manufacturing industries, 33. Production, transmission and distribution of electricity, 34. Production and distribution of gas, 35. Heat supply, 36. Collection, purification and distribution of water and sewage collection, processing and disposal, 37. Communications, 38. Broadcasting, 39. Information services, 40. Services incidental to internet, 41. Video picture information, sound information, character information production and distribution, 42. Railway transport, 43. Road Passenger transport, 44. Road freight transport, 45. Water transport, 46. Air transport, 47. Warehousing, 48. Services incidental to transport, 49. Postal services, including mail delivery, 50. Wholesale trade, general merchandise, 51. Wholesale trade (textile and apparel), 52. Wholesale trade (food and beverages), 53. Wholesale trade (building materials, minerals and metals, etc), 54. Wholesale trade (machinery and equipment), 55. Miscellaneous Wholesale trade, 56. Retail trade, general merchandise, 57. Retail trade (woven fabrics, apparel, apparel accessories and notions), 58. Retail trade (food and beverage), 59. Retail trade (machinery and equipment), 60. Miscellaneous retail trade, 61. Nonstore retailers, 62. Banking, 63. Financial institutions for cooperative organizations, 64. Non-deposit money corporations, including lending and credit card business, 65. Financial products transaction dealers and futures commodity dealers, 66. Financial auxiliaries, 67. Insurance institutions, including insurance agents brokers and services, 68. Real estate agencies, 69. Real estate lessors and managers, 70. Goods rental and leasing, 71. Scientific and development research institutes, 72. Professional services, N.E.C., 73. Advertising, 74. Technical services, N.E.C., 75. Accommodations, 76. Eating and drinking places, 77. Food take out and delivery services, 78. Laundry, beauty, and bath services, 79. Miscellaneous living-related and personal services, 80. Services for amusement and recreation, 81. School education, 82. Miscellaneous education, learning support, 83. Medical and other health services, 84. Public health and hygiene, 85. Social insurance, social welfare and care services, 86. Postal services, 87. Cooperative associations, N.E.C, 88. Waste disposal business, 89. Automobile maintenance services, 90. Machine, etc. repair services, except otherwise classified, 91. Employment and worker dispatching services, 92. Miscellaneous business services, 93. Political, business and cultural organizations, 94. Religion, 95. Miscellaneous services, 96. Foreign governments and international agencies in Japan, 97. National government services, 98. Local government services.
APPENDIX C: DETAIL DESCRIPTIONS OF TEN LARGEST COMMUNITIES
Here we report the details of over-expression of prefectures and sectors in ten largest communities. The pair of values within the parentheses indicate the number of occurrence of the attribute within the community and in the whole system.
-
•
Community rank: 1, size: 233294
Prefecture over-expressions: Gunma (4436/19893), Saitama (11181/46418), Tokyo (37172/186179), Kanagawa (15776/62781), Nagano (4528/21641), Shizuoka(7889/35806), Aichi (19903/70128) Mie (3771/17747), Osaka ( 26641/87226), Hyogo (10120/41282), Hiroshima (6795/30651), Yamaguchi (2881/12604).
Sector over-expressions: Equipment installation work(24461/101430), Manufacture of chemical and allied product (2420/5946), Manufacture of petroleum and coal products (198/518), Manufacture of plastic products except otherwise classified (6030/8922), Manufacture of rubber products (1530/2060), Manufacture of ceramic, stone and clay products (1846/8051), Manufacture of iron and steel (2602/3210), Manufacture of non-ferrous metals and products (1960/2291), Manufacture of fabricated metal products (17655/24494), Manufacture of general-purpose machinery (6676/8125), Manufacture of production machinery (13814/17342), Manufacture of business oriented machinery (2672/4194), Electronic parts, devices and electronic circuits (3768/4363) Manufacture of electrical machinery, equipment and supplies (7081/8795), Manufacture of information and communication electronics equipment (1389/2101) Manufacture of transportation equipment (5049/6623), Miscellaneous manufacturing industries (2585/11270), Production, transmission and distribution of electricity (376/1306), Water transport (894/1490), Services incidental to transport (1219/4474), Wholesale trade, general merchandise (1568/4891), Wholesale trade (building materials, minerals and metals, etc) (10858/34380), Wholesale trade (machinery and equipment) (19336/40672), Retail trade (machinery and equipment) (11653/41319), Technical services, N.E.C. (5298/26216), Machine, etc. repair services, except otherwise classified (2490/4670) Employment and worker dispatching services (1055/4683). -
•
Community rank: 2, size: 139380
Prefecture over-expressions: Aomori (2447/14681), Iwate(2115/12419), Miyagi (3388/22888), Akita (1804/11705), Yamagata (1969/13168), Fukushima (2596/20897), Niigata (3153/25586), Nagano (2914/21641), Shizuoka (4713/35806), Wakayama (1341/10004) Tottori (920/5468), Shimane (1030/8209), Tokushima (1268/9172), Kagawa (2018/12287), Ehime (2271/16097), Kochi (1125/8078), Saga (1468/7873), Nagasaki (1945/12078), Kumamoto (2356/16358), Oita (2129/12738), Miyazaki (2153/12013), Kagoshima (3251/15423).
Sector over-expressions: Agriculture (4277/10747), Fisheries, except aquaculture (563/724), Aquaculture (627/771), Manufacture of food (16020/19833), Manufacture of beverages, tobacco and feed (2675/3935), Road freight transport (3615/29678), Warehousing (372/1997), Wholesale trade, general merchandise (931/4891), Wholesale trade(food and beverages) (23126/28535), Miscellaneous wholesale trade (6497/34637), Retail trade, general merchandise (1095/1531), Retail trade (food and beverage) (18082/23948), Nonstore retailers (297/1203), Financial institutions for cooperative organizations (130/511), Non-deposit money corporations, including lending and credit card business (180/755), Real estate lessors and managers (3631/25301), Accommodations (2339/6062), Eating and drinking places (11276/15725), Food take out and delivery services (280/432), Miscellaneous living-related and personal services (1413/7001), Services for amusement and recreation (1119/8242), Social insurance, social welfare and care services (1119/7616), Cooperative associations, N.E.C (2366/7925), Miscellaneous services (128/249). -
•
Community rank: 3, size: 59906
Prefecture over-expressions: Saitama (4665/46418), Chiba (3833/39828), Tokyo (21293/186179), Kanagawa (7438/62781), Osaka (6139/87226).
Sector over-expressions: Construction work, general including public and private construction work (9653/163082), Construction work by specialist contractor, except equipment installation work (15242/125183), Equipment installation work (8306/101430), Production, transmission and distribution of electricity (142/1306), Heat supply (27/80), Banking (40/161), Non-deposit money corporations, including lending and credit card business (109/755), Financial products transaction dealers and futures commodity transaction dealers (240/1263), Financial auxiliaries (69/262), Real estate agencies (3587/19183), Real estate lessors and managers (3570/25301), Goods rental and leasing (567/6910), Professional services, N.E.C.(1127/19393), Technical services, N.E.C.(2609/26216), Miscellaneous business services (1887/19963), Foreign governments and international agencies in Japan (7/20). -
•
Community rank: 4, size: 47849
Prefecture over-expressions: Tokyo (9248/186179), Ishikawa (659/12307), Fukui (1122/11599), Gifu (1127/20230), Aichi (2929/70128), Kyoto (2407/24369), Osaka (5657/87226), Hyogo (2010/41282), Nara (535/9516), Wakayama (518/10004), Okayama (1011/20023), Ehime (721/16097).
Sector over-expressions: Manufacture of textile products (8893/12402), Manufacture of rubber products (222/2060), Manufacture of leather tanning, leather products and fur skins (1033/1520), Miscellaneous manufacturing industries (958/11270), Warehousing(112/1997), Wholesale trade, general merchandise ( 536/4891), Wholesale trade (textile and apparel) (7241/10562), Miscellaneous wholesale trade (1910/34637), Retail trade (woven fabrics, apparel, apparel accessories and notions)(13082/16255), Miscellaneous retail trade (3107/63111), Nonstore retailers (114/1203), Miscellaneous living-related and personal services (866/7001), Services for amusement and recreation (691/8242). -
•
Community rank: 5, size: 44349
Prefecture over-expressions: Hokkaido (2778/58982), Iwate (774/12419), Tochigi (1258/20653), Tokyo(9954/186179), Kyoto(1159/24369), Hiroshima (1673/30651), Tokushima (565/9172), Kochi (394/8078), Fukuoka (2091/45359), Kumamoto (1174/16358), Miyazaki (794/12013).
Sector over-expressions: Manufacture of chemical and allied product (739/5946), Manufacture of business oriented machinery (575/4194), Wholesale trade (machinery and equipment) (1916/40672), Miscellaneous wholesale trade (1735/34637), Miscellaneous retail trade (6574/63111), Scientific and development research institutes (117/547), Medical and other health services (22622/26123), Public health and hygiene (139/387), Social insurance, social welfare and care services (1414/7616). -
•
Community rank: 6, size: 43397
Prefecture over-expressions: Aomori (1028/14681), Miyagi (1514/22888), Akita (759/11705), Yamagata(726/13168), Ibaraki (1211/26412), Tochigi (1011/20653), Gunma (1051/19893), Saitama (1819/46418), Chiba (1716/39828), Kanagawa (2380/62781), Toyama (773/13423), Ishikawa (673/12307), Fukui (539/11599), Yamanashi (519/9981), Gifu (857/20230), Shizuoka (1514/35806), Mie (741/17747), Okayama (963/20023), Hiroshima (1209/30651), Saga (358/7873), Kumamoto (767/16358), Oita (671/12738), Miyazaki (535/12013).
Sector over-expressions: Manufacture of transport equipment (369/6623), Road passenger transport (1199/4492), Wholesale trade (machinery and equipment) (3031/40672), Retail trade (machinery and equipment) (15483/41319), Insurance institutions, including insurance agents, brokers and services (4805/6234), Goods rental and leasing (407/6910), School education (312/3416), Automobile maintenance services (8607/17703). -
•
Community rank: 7, size: 43018
Prefecture over-expressions: Hokkaido (37867/58982).
Sector over-expressions: Agriculture (1214/10747), Forestry (156/934), Fisheries, except aquaculture (62/724), Mining and quarrying of stone (142/1479), Construction work, general including public and private construction work (7077/163082), Construction work by specialist contractor, except equipment installation work (6095/125183), Equipment installation work (3960/101430), Manufacture of lumber and wood products, except furniture (273/5132), Road passenger transport (222/4492), Road freight transport (1554/29678), Wholesale trade (building materials, minerals and metals, etc) (1339/34380), Retail trade (food and beverage) (1203/23948), Financial institutions for cooperative organizations (41/511), Real estate lessors and managers (1001/25301), Goods rental and leasing (336/6910), Technical services, N.E.C. (1266/26216), Accommodations (267/6062), Eating and drinking places (683/15725), Social insurance, social welfare and care services (328/7616), Cooperative associations, N.E.C (520/7925), Automobile maintenance services (1077/17703), Local government services (223/2112). -
•
Community rank: 8, size: 38819
Prefecture over-expressions: Tokyo (18716/186179).
Sector over-expressions: Printing and allied industries (1138/10996), Manufacture of information and communication electronics equipment (99/2101), Miscellaneous manufacturing industries (1312/11270), Communications (75/865), Broadcasting (358/742), Information services (3096/23741), Services incidental to internet (427/1236), Video picture information, sound information, character information production and distribution (4361/7665), Wholesale trade, general merchandise (246/4891), Miscellaneous wholesale trade (2373/34637), Miscellaneous retail trade (4586/63111), Nonstore retailers (256/1203), Financial products transaction dealers and futures commodity transaction dealers (72/1263), Goods rental and leasing (483/6910), Professional services, N.E.C. (2821/19393), Advertising (2572/6306), Services for amusement and recreation(1225/8242), School education (529/3416), Miscellaneous education, learning support (718/2087), Employment and worker dispatching services (558/4683), Miscellaneous business services(1701/19963), Political, business and cultural organizations (411/5288). -
•
Community rank: 9, size: 33654
Prefecture over-expressions: Tokyo (13884/186179), Kanagawa (2018/62781), Osaka (2667/87226).
Sector over-expressions: Equipment installation work (4096/101430), Manufacture of information and communication electronics equipment (280/2101), Production, transmission and distribution of electricity (61/1306), Communications (494/865), Broadcasting (70/742), Information services (11114/23741), Services incidental to internet (380/1236), Video picture information, sound information, character information production and distribution (278/7665), Wholesale trade (machinery and equipment) (1801/40672), Retail trade (machinery and equipment) (1838/41319), Nonstore retailers(65/1203), Banking (17/161), Financial institutions for cooperative organizations (35/511), Non-deposit money corporations, including lending and credit card business (65/755), Financial products transaction dealers and futures commodity transaction dealers (272/1263), Financial auxiliaries (49/262), Goods rental and leasing (302/6910), Professional services, N.E.C. (2350/19393), Advertising (230/6306), Technical services, N.E.C. (852/26216), Miscellaneous education, learning support (128/2087), Employment and worker dispatching services (676/4683), Miscellaneous business services (1154/19963), Political, business and cultural organizations (293/5288). -
•
Community rank: 10, size: 33563
Prefecture over-expressions: Gifu (8843/20230), Aichi (19937/70128), Mie (752/17747)
Sector over-expressions: Mining and quarrying of stone (88/1479), Construction work, general including public and private construction work (9573/163082), Construction work by specialist contractor, except equipment installation work (7621/125183), Equipment installation work (4717/101430), Manufacture of lumber and wood products, except furniture (211/5132), Manufacture of ceramic, stone and clay products (354/8051), Wholesale trade (building materials, minerals and metals, etc) (1168/34380), Real estate agencies (859/19183), Waste disposal business (318/9078), Local government services (102/2112).
References
- Girvan and Newman (2002) M. Girvan and M. E. Newman, Proceedings of the national academy of sciences 99, 7821 (2002).
- Krause et al. (2003) A. E. Krause, K. A. Frank, D. M. Mason, R. E. Ulanowicz, and W. W. Taylor, Nature 426, 282 (2003).
- Guimera and Amaral (2005) R. Guimera and L. A. N. Amaral, nature 433, 895 (2005).
- Rosvall et al. (2014) M. Rosvall, A. V. Esquivel, A. Lancichinetti, J. D. West, and R. Lambiotte, Nature Communications 5, 4630 (2014).
- Krishnamurthy and Wang (2000) B. Krishnamurthy and J. Wang, ACM SIGCOMM Computer Communication Review 30, 97 (2000).
- Reddy et al. (2002) P. K. Reddy, M. Kitsuregawa, P. Sreekanth, and S. S. Rao, in International Workshop on Databases in Networked Information Systems (Springer, 2002) pp. 188–200.
- Fortunato (2010) S. Fortunato, Physics reports 486, 75 (2010).
- Newman (2012) M. E. Newman, Nature physics 8, 25 (2012).
- Kernighan and Lin (1970) B. W. Kernighan and S. Lin, The Bell system technical journal 49, 291 (1970).
- Newman and Girvan (2004) M. E. Newman and M. Girvan, Physical review E 69, 026113 (2004).
- Newman (2004) M. E. Newman, Physical review E 69, 066133 (2004).
- Rosvall and Bergstrom (2007) M. Rosvall and C. T. Bergstrom, Proceedings of the National Academy of Sciences 104, 7327 (2007).
- Rosvall and Bergstrom (2008) M. Rosvall and C. T. Bergstrom, Proceedings of the National Academy of Sciences 105, 1118 (2008).
- Clauset et al. (2004) A. Clauset, M. E. Newman, and C. Moore, Physical review E 70, 066111 (2004).
- Rosvall and Bergstrom (2011) M. Rosvall and C. T. Bergstrom, PloS one 6, e18209 (2011).
- Lancichinetti et al. (2010) A. Lancichinetti, M. Kivelä, J. Saramäki, and S. Fortunato, PloS one 5, e11976 (2010).
- Tumminello et al. (2011) M. Tumminello, S. Miccichè, F. Lillo, J. Varho, J. Piilo, and R. N. Mantegna, Journal of Statistical Mechanics: Theory and Experiment 2011, P01019 (2011).
- Tumminello et al. (2012) M. Tumminello, F. Lillo, J. Piilo, and R. N. Mantegna, New Journal of Physics 14, 013041 (2012).
- Vitali and Battiston (2014) S. Vitali and S. Battiston, PloS one 9, e104655 (2014).
- Marotta et al. (2015) L. Marotta, S. Micciche, Y. Fujiwara, H. Iyetomi, H. Aoyama, M. Gallegati, and R. N. Mantegna, PloS one 10, e0123079 (2015).
- Marotta et al. (2016) L. Marotta, S. Miccichè, Y. Fujiwara, H. Iyetomi, H. Aoyama, M. Gallegati, and R. N. Mantegna, EPJ Data Science 5, 10 (2016).
- Fujiwara and Aoyama (2010) Y. Fujiwara and H. Aoyama, The European Physical Journal B 77, 565 (2010).
- Iino et al. (2010) T. Iino, K. Kamehama, H. Iyetomi, Y. Ikeda, T. Ohnishi, H. Takayasu, and M. Takayasu, in Journal of Physics: Conference Series, Vol. 221 (IOP Publishing, 2010) p. 012012.
- Iino and Iyetomi (2015) T. Iino and H. Iyetomi, in The Economics of Interfirm Networks (Springer, 2015) pp. 39–65.
- Mizuno et al. (2014) T. Mizuno, W. Souma, and T. Watanabe, Plos one 9, e100712 (2014).
- Acemoglu et al. (2012) D. Acemoglu, V. M. Carvalho, A. Ozdaglar, and A. Tahbaz-Salehi, Econometrica 80, 1977 (2012).
- Cerina et al. (2015) F. Cerina, Z. Zhu, A. Chessa, and M. Riccaboni, PloS one 10, e0134025 (2015).
- Barabási and Albert (1999) A.-L. Barabási and R. Albert, science 286, 509 (1999).
- Chakraborty and Manna (2010) A. Chakraborty and S. S. Manna, Physical Review E 81, 016111 (2010).
- Newman (2010) M. Newman, Networks: an introduction (Oxford university press, 2010).
- Clauset et al. (2009) A. Clauset, C. R. Shalizi, and M. E. Newman, SIAM review 51, 661 (2009).
- Blondel et al. (2008) V. D. Blondel, J.-L. Guillaume, R. Lambiotte, and E. Lefebvre, Journal of statistical mechanics: theory and experiment 2008, P10008 (2008).
- Chen and Yuan (2006) J. Chen and B. Yuan, Bioinformatics 22, 2283 (2006).
- Onnela et al. (2003) J.-P. Onnela, A. Chakraborti, K. Kaski, J. Kertesz, and A. Kanto, Physical Review E 68, 056110 (2003).
- Miller Jr (1981) R. G. Miller Jr, in Simultaneous statistical inference (Springer, 1981) pp. 37–108.
- Krichene et al. (2017) H. Krichene, A. Chakraborty, H. Inoue, and Y. Fujiwara, PloS one 12, e0186467 (2017).