55 \jyear2016
High-mass star and massive cluster formation in the Milky Way
Abstract
This review examines the state-of-the-art knowledge of high-mass star and massive cluster formation, gained from ambitious observational surveys, which acknowledge the multi-scale characteristics of these processes. After a brief overview of theoretical models and main open issues, we present observational searches for the evolutionary phases of high-mass star formation, first among high-luminosity sources and more recently among young massive protostars and the elusive high-mass prestellar cores. We then introduce the most likely evolutionary scenario for high-mass star formation, which emphasizes the link of high-mass star formation to massive cloud and cluster formation. Finally, we introduce the first attempts to search for variations of the star formation activity and cluster formation in molecular cloud complexes, in the most extreme star-forming sites, and across the Milky Way. The combination of Galactic plane surveys and high-angular resolution images with submillimeter facilities such as Atacama Large Millimeter Array (ALMA) are prerequisites to make significant progresses in the forthcoming decade.
doi:
10.1146/((please add article doi))keywords:
star formation, protocluster, cloud, protostar1 INTRODUCTION
High-mass stars, also called OB stars, have luminosities larger than , spectral types of B3 or earlier, and stellar masses from up to possibly more than (Martins et al., 2008). From their births to their deaths, high-mass stars are known to play a major role in the energy budget of galaxies via their radiation, wind, and supernovae events. Despite that, the formation of high-mass stars remains an enigmatic process, being far less understood than it is for their low-mass (solar-type) counterparts. Solving the mystery of the high-mass star-formation process is important for itself but it is also fundamental to fully constrain the origin of the initial mass function (IMF) and the formation of massive star clusters and to provide accurate star-formation recipes such as star-formation rate (SFR) and IMF for extragalactic studies and numerical simulations.
Theoretical models proposed for the formation of high-mass stars tried to solve the UV radiation pressure problem (Wolfire & Cassinelli, 1987). Stars reaching a few masses and a few luminosities were indeed supposed to develop a pressure barrier halting further accretion. Most recent 3D modeling mostly solved this problem by showing that equatorial accretion can continue for ionizing protostar embryos (e.g., Krumholz et al., 2009; Kuiper et al., 2011). Competing concepts for high-mass star formation currently are (a) monolithic collapse of a turbulent, pre-assembled core in Virial equilibrium (e.g., McKee & Tan, 2002, 2003; Hosokawa & Omukai, 2009), (b) protostar collision and coalescence in very dense systems (e.g., Bonnell, Bate & Zinnecker, 1998; Bonnell & Bate, 2002), and (c) competitive accretion in a protocluster environment through Bondi-Hoyle accretion (e.g., Bonnell et al., 2001; Murray & Chang, 2012) and/or gravitationally-driven cloud inflow (Smith, Longmore & Bonnell, 2009; Hartmann, Ballesteros-Paredes & Heitsch, 2012). Numerical simulations are now able to form stars with masses of up to stars thanks to non spherical accretion, improved radiation transfer, and feedback effects such as heating and ionization (e.g., Yorke & Sonnhalter, 2002; Krumholz et al., 2009; Kuiper et al., 2010, 2011). Modeling the formation of higher mass stars may remain a challenge (see Krumholz, 2015). For a complete description of high-mass star-formation theories, readers are directed to reviews by, e.g., Zinnecker & Yorke (2007), Beuther et al. (2007a), Tan et al. (2014), and Krumholz (2015).
The main open issues on high-mass and massive cluster formation include the following: How different are the processes, that form high-mass stars and massive clusters with respect to their low-mass analogs? How is high-mass star formation linked to the formation of their parental clouds and descendant clusters? Does it vary across the Milky Way? Observational constraints take time to gather because understanding star formation and especially high-mass star formation requires studies over several decades of spatial scales and densities. Furthermore, studying the formation of high-mass stars and their companion low-mass stars implies dissecting their parental protoclusters. The latter are complex structures composed of molecular gas and stars in the making, generally located at more than 1 kpc from the Sun, and largely embedded within high-density clouds. Investigating high-mass star and massive cluster formation thus requires high angular resolution imaging at far-IR to (sub)millimeter wavelengths over large areas of the Milky Way. Because we suspect high-mass star-forming regions to be exposed to shock waves, powered by cloud collision, infall motions, OB stellar winds, and ionization fronts, studying both cloud structures and kinematics is mandatory.
This observational review follows those done by, e.g., Churchwell (2002), Zinnecker & Yorke (2007) and Beuther et al. (2007a). We intentionally refrain from discussing detailed characteristics of high-mass precursors, such as disk and binary formation or chemistry evolution, because observational constraints remain sparse and are based on studies of a few very luminous objects. In the remainder of this review, we characterize the evolutionary phases of high-mass star formation as defined from large surveys of infrared-bright (IR-bright) to infrared-quiet (IR-quiet) objects (see Sect. 2), pointing out their strengths and biases. We end up proposing the most probable evolutionary scenario for the formation of high-mass stars in relation to source statistics and cloud kinematics. We then investigate the importance of cloud characteristics to form high-mass stars and massive stellar clusters and present initial searches for variations across the Milky Way (see Sects. 4-5). Finally, we point out directions of improvement for the coming decade (see Sect. 6.)
2 HIGH-MASS STAR FORMATION
Unlike the case for low-mass stars (see, e.g., Shu, Adams & Lizano, 1987; André, Ward-Thompson & Barsony, 2000), there is no observational evolutionary sequence that is firmly established for high-mass star formation. One of the main differences between high-mass and low-mass stars is that the radiation field of a massive star plays a more important role during its whole life and already in its formation phase. Theoretically, a massive protostellar embryo heats and eventually ionizes the gas of its surrounding envelope, creating an HII region that develops by expanding within the cloud (see the Strömgren theory in Spitzer, 1978).
Despite the lack of an evolutionary sequence, a nomenclature of high-mass star precursors exists. Following that of low-mass stars, objects associated with the first phase of high-mass star formation have been called massive starless clumps, high-mass prestellar cores, massive cold molecular cores, or even IR-dark clouds (IRDCs). High-mass prestellar cores would be pre-assembled, gravitationally bound cores that will form individual high-mass stars or binaries. The nature of larger-scale cloud structures remains unclear. In the subsequent phase, high-mass star precursors have been named massive protostars, high-mass protostellar objects (HMPOs), protostellar massive dense cores (MDCs), or hot molecular cores (HMCs). These collapsing cloud fragments qualify as high-mass protostars when they have the ability to form a high-mass star binary but not a full cluster. The final phase corresponds to HII regions being from hyper-compact to classical. Below, following the chronological order of the bibliography and thus going backward in time for high-mass star formation, we present surveys, th at have discovered and characterized such objects (see Sects. 2.1-2.2). For a meaningful comparison of the precursors of high-mass stars identified by these studies (see Table 1), we choose to use and extend the terminology recommended by Williams, Blitz & McKee (2000): cloud complexes have 100 pc sizes, clouds 10 pc, clumps are 1 pc cloud structures, dense cores have 0.1 pc, and individual cores 0.01 pc sizes. Interestingly, individual protostars are observed with 0.02 pc or AU sizes and may not further subfragment Bontemps et al. (2010b); Palau et al. (2013); Beuther et al. (2015). In the following, the term protostar is used to refer to a protostellar embryo surrounded by a protostellar envelope/core, not the protostellar embryo alone.
| Source | HMPOs | IRDCs | MDCs, | Isolated | Clustered |
|---|---|---|---|---|---|
| fragments, | prestellar | pre- or protostellar | |||
| Nature | clumps | clumps | dense cores | cores | cores |
| FWHM [pc] | 0.5 | 0.5 | 0.08 | 0.007 | |
| Mass [] | 290 | 150 | 5 | 0.15 | |
| [cm-3] | |||||
| [kpc] | 1.4 | 0.14 | |||
| References | (1) | (2), (3), (4) | (5), (6) | (7), (8) | (8) |
Because high-mass stars represent less than 1% of the stars (when integrating the IMF by Kroupa, 2001), observing a statistically significant sample of high-mass star precursors requires probing cloud complexes more massive than any of the Gould Belt clouds, including Orion. The present knowledge of high-mass star formation is mainly based on surveys of the most nearby, massive cloud complexes that are more massive than Orion (see Sect. 5.1).
2.1 Evolution from HII regions back to IR-bright protostars
Because high-mass stars are luminous (above ) on the main sequence, from the 1980s to the end of the 1990s their precursors have been searched for among sources strongly emitting UV or IR radiation. Massive young stellar objects that have developed an HII region are strong free-free emitters at centimeter wavelengths and have thus been studied in great details for several decades (see, e.g., Churchwell, 2002). In his ARAA review, Churchwell (2002) proposed an empirical evolutionary scenario, based on ionization expansion, leading from ultra-compact HII (UCHii) regions to compact HII regions, and then classical/developed HII regions. It has been completed with a new class of objects qualified as hyper-compact Hiis (HCHiis, Hoare et al., 2007). The physical size, density, line profile, and spectral index of HII regions detected in the radio centimeter and recombination line surveys are the main characteristics used in this empirical classification. The smallest HII regions, UCHiis and HCHiis, that have more to tell about the process of high-mass star formation have 0.1 pc and 0.05 pc sizes, respectively, and cm-3 and cm-3 densities, respectively (Kurtz et al., 2000; Hoare et al., 2007). HCHii regions themselves could correspond to a very early phase of HII regions, quenched by infalling gas, or to high-mass protostars, whose photo-evaporating disks and ionized accretion flows or jets are detected at centimeter wavelengths (e.g., Keto, 2003; Hoare et al., 2007).
In 1989, Wood & Churchwell started searching for the youngest HII regions by using the Galaxy-wide survey of high-luminosity IR sources provided by the IRAS point source catalog. They applied the Log and Log color-color criteria to select bright red IRAS sources that could correspond to young stellar objects with a stellar embryo more massive than . The resulting catalog contains 1646 sources spread near and far across the Galaxy. Most of these sources indeed are UCHII regions, but some of them could even be in the earlier protostellar phase. {marginnote}[] \entryInfrared Astronomical Satellite (IRAS):the first space telescope to perform a survey of the entire sky at 12, 25, 60, and m; its compact source catalog contains over 250 000 sources.
Many authors have searched for protostellar objects within the Wood & Churchwell catalog of IRAS sources (e.g., Bronfman, Nyman & May, 1996; Plume et al., 1997; Walsh et al., 1998; Molinari et al., 2000; Sridharan et al., 2002; Mueller et al., 2002; Faúndez et al., 2004; Hill et al., 2005). They postulated that protostellar objects were all high-luminosity IR sources embedded within massive envelopes that have not yet developed an HII region. These authors have thus investigated the association of the Wood & Churchwell sources with dense gas, detected through for instance CS molecular lines or millimeter continuum, with a hot core through detection of complex molecules, and/or with masers. They checked for the absence of any HII region via no or weak emission at centimeter wavelengths. These sources, in the pre-UCHII phase, have been named differently in each of the papers referenced above, but two of these names remained: HMCs (Garay & Lizano, 1999; Kurtz et al., 2000) or HMPOs (Beuther et al., 2002a). The main drawback of these large samples is their inhomogeneity in terms of distance and thus spatial scales. Following the terminology of Williams, Blitz & McKee (2000), these IRAS-selected sources spanning 0.1 to 10 pc scales are dense cores, clumps or even clouds, each of them associated sometimes loosely with at least one bright IR source.
One of the best-studied sample by Beuther et al. (2002a) contains 69 HMPOs, which are located at 300 pc up to 14 kpc from the Sun. The median HMPO (see Table 1) is thus a clump, i.e. a 1 pc cloud structure hosting several individual high-mass protostars with expected 0.02 pc sizes (e.g. Beuther et al., 2015). HMPO clumps closely associated with IRAS sources are good candidates to contain IR-bright high-mass protostars.
Several attempts to derive an evolutionary sequence for high-mass star formation have been made in these surveys by using three types of diagnostics: hot core chemistry enrichment, maser types, and luminosity. Because the warm inner parts of high-mass protostellar envelopes evolve with time, the physical and chemical properties of a hot core (e.g., its size, temperature, molecular abundances, and associated masers) can in principle be used as a clock (e.g., Helmich & van Dishoeck, 1997; Garay & Lizano, 1999). Both methanol and OH masers are associated with hot cores formed during the high-mass star formation process (see catalogs by, e.g., Pestalozzi, Minier & Booth, 2005; Walsh et al., 2016). A timeline based on masers has been proposed with OH masers generally associated with HII regions and methanol masers at 6.7 GHz exclusively tracing the earliest protostellar phases (e.g., Minier et al., 2005; Breen et al., 2010). Besides, because a high-mass star is expected to grow in mass across its formation process, its luminosity should increase. The envelope mass to bolometric luminosity ratio, , can thus be used to qualitatively separate the early or late state of evolution of a high-mass protostellar object (e.g., Sridharan et al., 2002; Elia et al., 2017). Because the evolutionary sequences proposed for high-mass star formation before the decade 2000 are almost exclusively based on follow-up studies of bright sources found by IRAS, they are biased against its earliest phases, which are expected to be colder and thus IR-quiet. To make progress, dedicated unbiased surveys of the IR-quiet phases of high-mass star formation were therefore required.
2.2 IR-quiet high-mass protostars
The precursors of UCHII regions and IR-bright protostars could be the high-mass analogs of low-mass prestellar cores and Class 0 protostars and thus massive cloud structures, cold enough not to be detected by near- to mid-IR surveys. For the past ten years, they have been searched for through mid-IR, far-IR, and (sub)millimeter surveys. In this section, we review the major studies that indeed found precursors of IR-bright protostars, with luminosity lower than and size varying from 1 pc to 0.01 pc.
2.2.1 Serendipitous discoveries
The first good candidates for being IR-quiet precursors of high-mass stars have been found by two different observational methods. The first one uses high-density tracers, often submillimeter continuum, to map the surroundings of high-mass IR-bright objects associated with well-known HII regions, H2O or CH3OH masers, or IRAS sources. Many of these mappings have serendipitously revealed some dense and massive cloud fragments which remain undetected at mid-IR wavelengths (e.g., Motte, Schilke & Lis, 2003; Garay et al., 2004; Hill et al., 2005; Klein et al., 2005; Sridharan et al., 2005; Beltrán et al., 2006; Thompson et al., 2006; Beuther & Steinacker, 2007). These studies are evidently plagued by very low-number statistics and large inhomogeneity because the cloud fragments identified this way have sizes ranging from 0.1 pc to more than 1 pc.
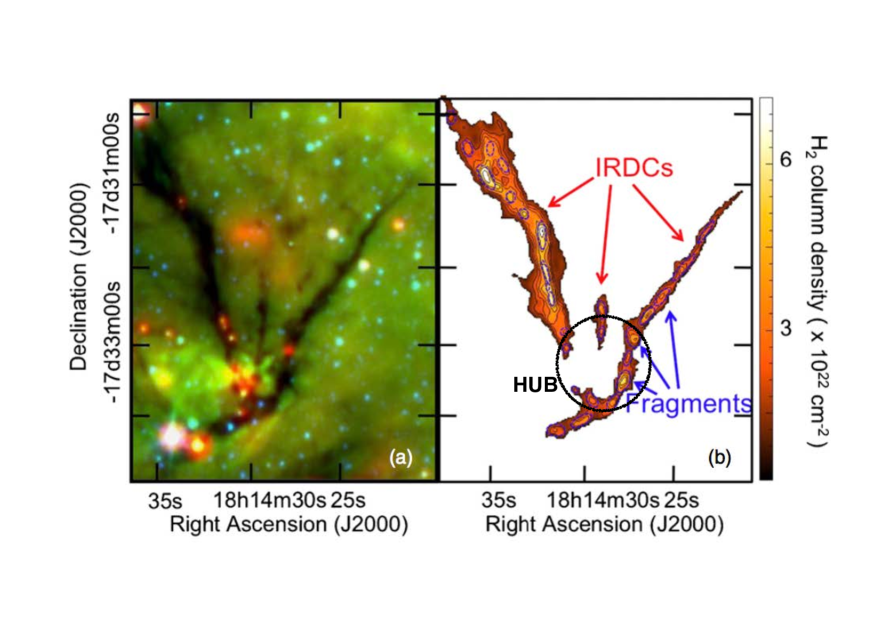
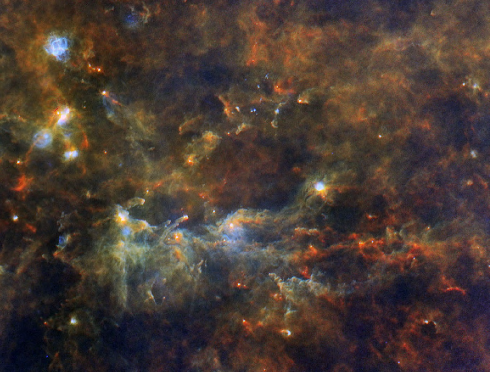
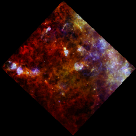
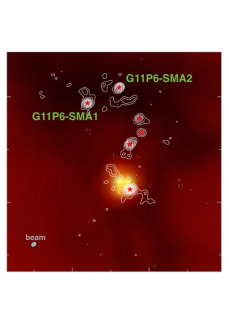
A second method is to search for compact sources within cold clouds seen in absorption against the diffuse mid-IR background of square degrees images taken by the ISO, MSX, Spitzer, and Herschel space observatories. Indeed, these absorption features, referred as IRDCs, could be the footprints of cold cloud structures (see, e.g., Figure 1). These IRDCs surveys provide large samples of IR-quiet sources generally located at large and inhomogeneous distances from the Sun (e.g., Pérault et al., 1996; Egan et al., 1998; Simon et al., 2006a; Butler & Tan, 2009; Peretto & Fuller, 2009). Their existence and gas content generally are confirmed by maps of high-density cloud tracers (e.g., Carey et al., 2000; Teyssier, Hennebelle & Pérault, 2002; Simon et al., 2006b; Rathborne, Jackson & Simon, 2006; Ragan et al., 2006; Sakai et al., 2008). Even in the most recent studies by Butler & Tan (2009) and Peretto & Fuller (2010), the selected sources, called in their paper IRDC cores or fragments, have the pc sizes and should harbor several collapsing protostars and/or prestellar cores (see Table 1). Their large-scale structure often resembles filament hubs (see Figure 1), as initially proposed by Myers (2009). {marginnote}[] \entryISOThe IR Space Observatory was designed to image selected areas at 2.5 to m. \entryMSXThe Midcourse Space Experiment is a military satellite experiment, which mapped the Galactic plane at 4 to m. \entrySpitzerThis space observatory performed continuum imaging and spectroscopy at m. One of its three instruments is still partly operable. \entryHerschelThis space observatory was equipped with the largest IR telescope ever launched and three instruments (SPIRE, PACS, HIFI) sensitive in photometry and spectroscopy to the far IR and submillimeter wavebands (m).
The sources identified above are definitively colder and less luminous than the high-mass IR-bright sources discussed in Sect. 2.1: K versus K and versus . They could be either starless clumps or clumps hosting IR-quiet protostars, depending on the existence of protostellar activity signatures such as outflows, hot cores, or masers. Given their large size and moderate mass (see Table 1), many of them are however probably not dense enough to form high-mass stars in the near future. This statement is confirmed by recent observations (Ragan et al., 2006; Rathborne et al., 2009) as well as statistical arguments provided by the complete catalog of Spitzer IRDCs in the Milky Way (see Peretto & Fuller, 2009). Inspired by the sequence from Class 0 to Class I observed for low-mass protostars (e.g., André, Ward-Thompson & Barsony, 2000), the ratio of submillimeter to bolometric luminosity has also been employed for OB-type protostellar objects separating massive Class 0-like from high-luminosity protostellar objects (with , see e.g., Molinari et al., 1998; Motte, Schilke & Lis, 2003; Molinari et al., 2008). Only a dozen of sources identified by the above methods were studied with enough spatial resolution, spectral energy distribution (SED) coverage, and follow-up studies to qualify as high-mass equivalent of Class 0 protostars (Hunter et al., 1998; Molinari et al., 1998; Sandell, 2000; Garay et al., 2002; Sandell & Sievers, 2004).
[h]
3 Herschel surveys of nearby, massive molecular cloud complexes
HOBYS, the Herschel imaging survey of OB Young Stellar objects (Motte et al., 2010, see http:hobys-herschel.cea.fr), aims at making the census of MDCs in essentially all the molecular cloud complexes at less than 3 kpc (7 out of the 10 molecular complexes of Table 3 in Sect. 5.1). Its wide-field photometry part with both the SPIRE and PACS cameras along with the necessary interferometric follow-ups is expected to multiply by large factors the number of high-mass analogs of Class 0 protostars known before 2010.
Among the three most nearby, massive molecular cloud complexes not targeted by HOBYS, Carina was imaged with Herschel by Preibisch et al. (2012) and G345 and Vulpecula were covered by the Herschel imaging of the Galactic Plane survey (Hi-GAL, Molinari et al., 2010). Completing the imaging of entire molecular complexes, Herschel focused on several clumps forming high-mass stars (e.g., Zavagno et al., 2010; Ragan et al., 2012a).
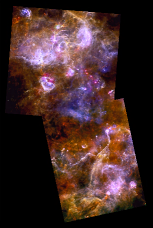
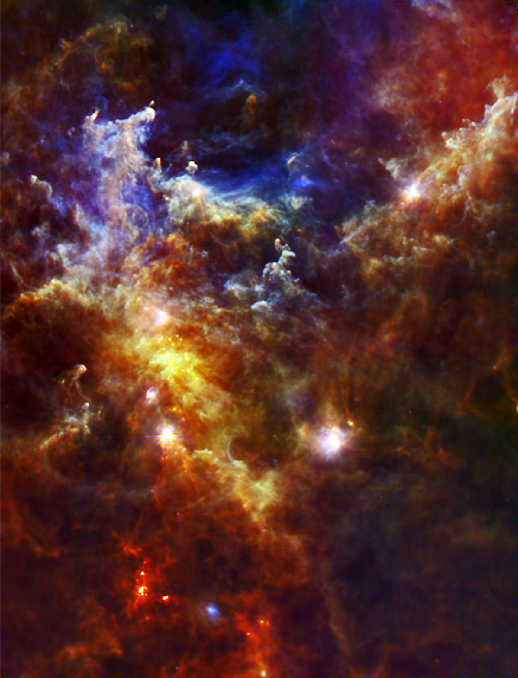
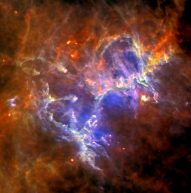
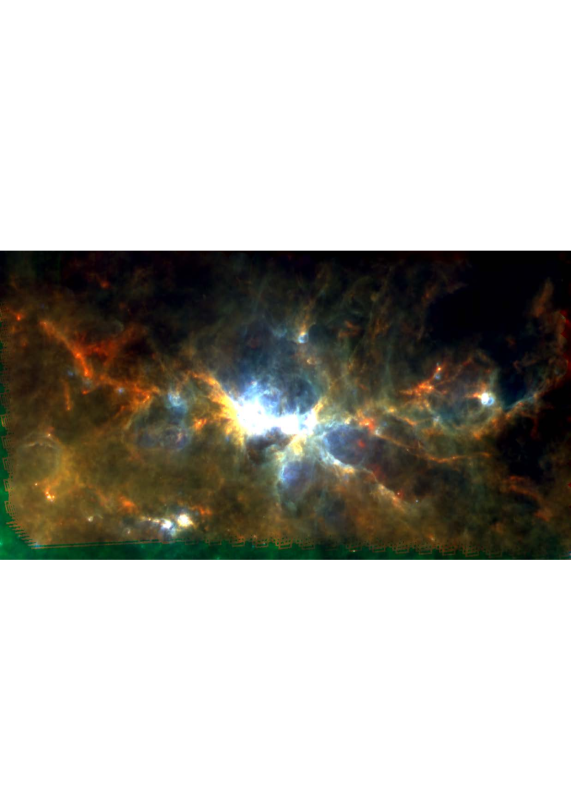
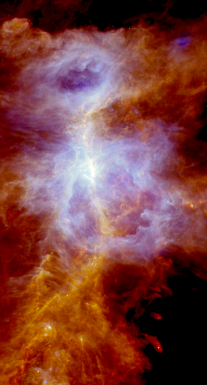
The three-color Herschel images (red = 250 m, green = 160 m, and blue = 70 m) obtained for the ten most nearby, massive molecular complexes are given in Appendix (see also Motte et al., 2010; Molinari et al., 2010; Nguyn Lu’o’ng et al., 2011a; Hill et al., 2012; Preibisch et al., 2012; Fallscheer et al., 2013; Rivera-Ingraham et al., 2013; Schneider et al., 2016).
3.0.1 Surveys within entire molecular cloud complexes
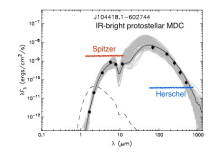
To go beyond, one needed to search, in a systematic and unbiased way, for high-mass analogues of prestellar cores, Class 0 and Class I protostars. If they exist and are somewhat similar to their low-mass counterparts, one should look for small-scale cloud fragments: 0.02 pc for protostars (Bontemps et al., 2010b) and pc for prestellar cores. They should also be massive enough to allow the formation of a couple of high-mass star, leading to huge volume-averaged densities, cm-3. High-mass star progenitors should therefore be best detected via (sub)millimeter or far-IR dust continuum (see Figure 2). This happens to be the wavelengths domain of ground-based (sub)millimeter telescopes like the IRAM 30 m and APEX, of the Herschel space observatory, and of submillimeter interferometers such as NOEMA and ALMA. To achieve sufficient spatial resolution and statistics, it is judicious to focus on the closest molecular cloud complexes which are actively forming OB stars. Ten such complexes were identified at intermediate distances, 1.4 to 3 kpc (see Sect. 5.1), ensuring reasonable 0.1 pc resolution with past and present single-dish submillimeter facilities: HPBW with IRAM 30 m, APEX, and JCMT, with CSO and HPBW with Herschel. With 0.1 pc typical sizes, these so-called MDCs are intermediate cloud structures between clumps like IRDCs or HMPOs and individual cores forming single stars or binaries (see Table 1). See the sidebar titled Herschel surveys of nearby, massive molecular cloud complexes. As discussed in Sect. 5.1, the amount of molecular gas contained in these ten most nearby, massive molecular cloud complexes should statistically permit studying the precursors of OB stars with masses up to . Multi-tracer studies of such complexes are thus expected to provide more statistically significant and more homogeneous samples of precursors of high-mass stars than any of the studies discussed in Sect. 2.2.1. {marginnote}[] \entryIRAMThe Institut de RadioAstronomie Millimétrique operates, at m to 3 mm, a 30 m radiotelescope and the NOEMA interferometer, soon consisting of twelve 15 m antennas. \entryAPEXThe Atacama Pathfinder Experiment is a 12 m telescope optimized at m to 1 mm. \entryALMAThe Atacama Large Millimeter Array is the largest submillimeter interferometer with fifty 12 m and twelve 7 m antennas, optimized at m to 3 mm. \entryCSO and JCMTThe 10 m Caltech Submillimeter Observatory and 15 m James Clerk Maxwell Telescope were/are working from m to 1-3 mm.
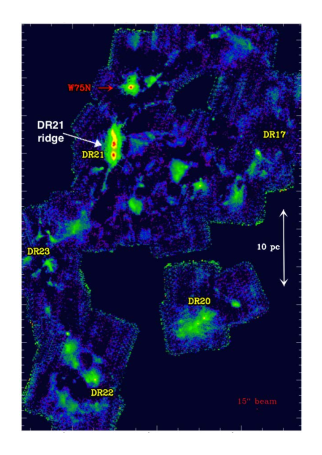
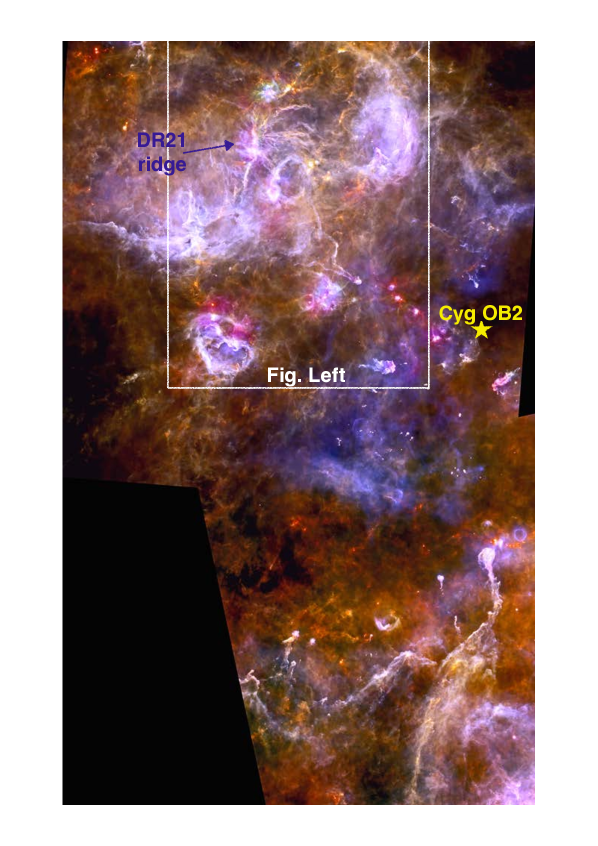
Among the most active star-forming complexes at less than 3 kpc, Cygnus X is the one that has caught most of the attention. According to Schneider et al. (2006), this region is dominated by a massive () molecular complex, tightly associated with several OB associations, the largest being Cyg OB2. It is located at only 1.4 kpc from the Sun (Rygl et al., 2012). The high-density clouds of Cygnus X have been completely imaged in millimeter continuum with the IRAM 30 m and as part of Herschel/HOBYS (Motte et al., 2007; Hennemann et al., 2012; Schneider et al., 2016, see Figures 3). The millimeter imaging survey of the entire Cygnus X molecular complex has revealed hundreds of 0.1 pc dense cores, among which 42 proposed to be massive enough, , to be MDCs (see Table 1).
Similar studies have been done for the NGC 6334-6357 and Carina MDCs using a millimeter imaging of the complex (Russeil et al., 2010) and Herschel images (Tigé et al., 2017; Gaczkowski et al., 2013). As for the most remote star-forming regions, they have right-away been imaged with submillimeter interferometers to pinpoint 0.1 pc MDCs (e.g., Beuther et al., 2007b; Zhang et al., 2009; Wang et al., 2011; Louvet et al., 2014).
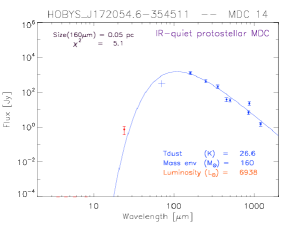
Prototellar MDCs distinguish from starless MDC candidates discussed in Sect. 3.3 by the fact that they drive outflows, power hot cores and masers, and/or are associated with mid-IR Spitzer emission. Outflows are traced by high-velocity wings of, e.g. CO or SiO, molecular lines or suggested by extremely green Spitzer objects (EGOs) while hot cores are detected through line forests (e.g., Motte et al., 2007; Cyganowski et al., 2011; Wang et al., 2011; Louvet et al., 2016). Before the advent of Herschel, Motte et al. (2007) proposed to use the mid-IR fluxes detected toward MDCs to identify high-mass IR-bright MDCs, with a luminosity larger than and thus a protostellar embryo larger than 8 . In this scheme, IR-quiet prototellar MDCs would themselves consist of a couple of stellar embryos of mass smaller than 8 buried in a 0.1 pc MDC of mass larger than . IR-quiet protostellar MDCs were thus recognized as small scale, 0.1 pc, and dense, cm-3, cloud fragments with no or weak mid-IR emission (10 Jy, Motte et al., 2007) but clear signposts of high-mass protostellar activity. With Herschel, a much more direct classification arises from the complete SED one can build for MDCs. While IR-quiet protostellar MDCs can generally be described by simple modified blackbody models, IR-bright protostellar MDCs display clear mid-IR, m, excesses (compare Figures 2). Interestingly, Tigé et al. (2017) showed that the ratio one can derive from such well-constrained SEDs is consistent with the classification made by solely using the mid-IR flux threshold proposed by Motte et al. (2007). In Cygnus X, 17 MDCs qualify as good candidates for hosting IR-quiet high-mass protostars, i.e. protostellar embryos of masses smaller than surrounded by 0.02 pc envelopes massive enough to form at least one high-mass star (Motte et al., 2007). As a matter of fact, the five most massive IR-quiet MDCs have been confirmed to host nine individual high-mass protostars, driving outflows (Bontemps et al., 2010b).
The velocity dispersion of IR-quiet MDCs, estimated from the width of molecular lines such as NH3, N2H+, or N2D+, are km s-1 (e.g., Ragan et al., 2006, 2012b; Bontemps et al., 2010b; Csengeri et al., 2011a; Wienen et al., 2012; Kauffmann, Pillai & Goldsmith, 2013; Tan et al., 2013). Therefore, despite the high level of turbulence measured in IR-quiet MDCs, they are virially supercritical and should be collapsing. It recalls the global hierarchical collapse model of Vázquez-Semadeni et al. (2009, 2017) and Ballesteros-Paredes et al. (2011), where velocity dispersions caused primarily by infall motions decrease with physical scales. The alternative interpretation is, as in the turbulent core model of McKee & Tan (2002), that IR-quiet starless MDCs and prestellar cores are supported against collapse by a strong magnetic field, which unfortunately remains difficult to measure (see Sect. 3.2).
3.1 Lifetime of high-mass star precursors and protostellar accretion rate
3.1.1 High-mass protostellar lifetime
The surveys mentioned in Sects. 2.1 and 3.0.1 allow, for the first time, getting statistical lifetime estimates for each of the embedded phases of high-mass star formation (see Table 2). Entries in Table 2 are ordered by spatial scales and evolutionary stages. High-mass star precursors, far from being mutually exclusive, form a Russian-doll structure, reflecting both the surveys resolution limitation and the hierarchical structure of clouds (see terminology in Sect. 2).
| Median | Envelope | Density | Statistical | References | |
|---|---|---|---|---|---|
| FWHM | Mass | a | Lifetimeb,c | ||
| [pc] | [] | [cm-3] | [yr] | ||
| Massive starless clumps | 0.5 | (1),(2),(3),(4) | |||
| UCHII regions | 0.1 | (5),(6) | |||
| IR-bright MDCs | 0.1 | (1),(2),(7) | |||
| IR-quiet MDCs | 0.1 | (1),(2),(7) | |||
| Starless MDCs | 0.1 | (1),(8),(9),(10) | |||
| IR-bright high-mass protostars | 0.02d | (7) | |||
| IR-quiet high-mass protostars | 0.02 | (11),(12),(7) | |||
| All high-mass protostars | 0.02 | 10 | (13),(7) | ||
| High-mass prestellar cores | d | 30d | (13),(7) |
a Median value of the volume-averaged density, averaged over the a sphere with a FWHM diameter:
, where is the mean molecular weight (Kauffmann et al., 2008), and is the hydrogen mass.
b The numbers of OB3 stars in Cygnus X and thus the statistical lifetimes of MDCs have been corrected from the values given in Motte et al. (2007) (see Table 5 of Russeil et al., 2010).
c To estimate the lifetime of individual protostars and prestellar cores, protostellar MDCs are assumed to host 2 protostars (see Sect. 3.1.1, Bontemps et al. 2010b), while starless MDCs could host at most one high-mass prestellar core (see Sect. 3.4.1, Tigé et al. 2017).
d Characteristics, which is postulated and thus not (yet) measured.
References: (1) Motte et al. (2007); (2) Russeil et al. (2010); (3) Svoboda et al. (2016); (4) Csengeri et al. (2014); (5) Wood & Churchwell (1989); (6) Mottram et al. (2011); (7) Tigé et al. (2017); (8) Butler & Tan (2012); (9) Tan et al. (2013); (10) Peretto et al. (2014); (11) Bontemps et al. (2010b); (12) Louvet et al. (2014); (13) Duarte-Cabral et al. (2013).
From a Galactic plane survey of bright and red IRAS sources, Wood & Churchwell (1989) estimated that the typical lifetime of the UCHII phase was about yr. This has recently been confirmed by statistical lifetimes determined by Mottram et al. (2011) for compact HII regions carefully identified by the Red MSX Source (RMS) survey (Lumsden et al., 2013), yr (see Table 2). These lifetimes are substantially longer than the timescale predicted by the Strömgren theory, initiating the so-called lifetime problem of UCHiis (e.g., Churchwell, 2002). The latter has recently been solved by simulations showing a fast decrease of the expansion velocity from its initial sound speed value in ionized gas and thus longer expansion times (see Didelon et al., 2015, and references therein).
When ground- or space-based submillimeter surveys make a complete census in a single molecular cloud complex, their sample covers every embedded phase of high-mass star formation, the IR-bright and IR-quiet protostellar phases, the starless/prestellar phase if it exists (see Sect. 3.3), and to a lesser extent the UCHII phase. The evolutionary stage of MDCs/clumps within these samples is estimated thanks to searches of protostellar activity signatures such as mid-IR, outflow, maser and hot core emission and searches of HII signatures like free-free centimeter emission. These complete studies provide the statistical base to derive the lifetimes of precursors of UCHII regions and consequently the first estimate of the high-mass protostellar lifetime. Estimated relatively to the known age and numbers of OB stars in the molecular complexes surveyed, typically hundreds of sources of a few yr, the lifetimes of IR-quiet and IR-bright MDCs in Cygnus X and NGC 6334 are yr and yr, respectively (Motte et al., 2007; Russeil et al., 2010, see Table 2). Interestingly, using a much larger but less homogeneous sample of IR-bright massive protostellar objects (Galaxy-wide, with pc sizes), a similar lifetime value was found for the IR-bright phase of high-mass protostars (Mottram et al., 2011). The protostellar MDC lifetime, derived from the Cygnus X and NGC 6334 samples, thus is yr, which roughly corresponds to twice the estimated free-fall time for MDCs, yr. This result is consistent with the idea that MDCs collapse in a few free-fall times, as suggested by Wyrowski et al. (2016). But we mention a word of caution anyway: Statistical lifetimes are subject to large observational uncertainties and free-fall times depend on the unconstrained gas density before collapse. Moreover in the scenario of Sects. 3.4.2 and 4.2, cores feed from their surrounding during bursts of star formation, making such estimates loose all their significance.
The relevance of single-dish (sub)millimeter and far-IR surveys for discussing the statistical protostellar (and prestellar) lifetime of high-mass stars is limited by the fact that they do not have the necessary angular resolution to pinpoint individual cores forming high-mass stars in high-pressure environments. To alleviate this difficulty one can observe MDCs at higher-angular resolution with (sub)millimeter interferometers. A handful of IR-quiet MDCs in Cygnus X and several massive fragments of IRDCs were studied using IRAM/NOEMA (Bontemps et al., 2010b; Beuther et al., 2015), SMA (Zhang et al., 2009; Rathborne et al., 2011; Wang et al., 2011, 2014), and ALMA (e.g., Peretto et al., 2013; Tan et al., 2013). {marginnote}[] \entrySMAThe SubMillimeter Array consists of eight 6 m antennas, functioning from m to 1 mm. Unfortunately, only a few of these studies reach the 0.02 pc size of individual protostars (Bontemps et al., 2010b; Wang et al., 2011, 2014). At this scale, interferometric observations revealed a large concentration of the gas into a few massive cores and much fewer low-mass cores than predicted by the IMF (see Figure 4 Left). In contrast to IR-quiet objects, IR-bright MDCs and HMPOs fragment into a large number of low-mass fragments as expected in the thermal Jeans process (Palau et al., 2015; Cyganowski et al., 2017). However, protostellar feedback (heating, outflow, etc…) distorts the envelope structure and makes fragmentation level more difficult to study without a good dust temperature model or a complete modeling of the radiative transfer (Beuther et al., 2007b; Leurini et al., 2007; Wang et al., 2013). In Table 2, lifetime estimates of IR-bright MDCs therefore assume the same fragmentation level as for the better-constrained IR-quiet MDCs.
In Cygnus X, nine high-mass IR-quiet protostars have been identified within the 5 surveyed IR-quiet MDCs, making an average of 2 high-mass protostars of 0.02 pc typical size per 0.1 pc MDCs (Bontemps et al., 2010b). This high concentration of mass into a small number of high-mass protostars makes the statistical protostostar lifetime a factor of only two longer than the lifetimes estimated for MDCs, yr (see Table 2). This exact same value was proposed by Duarte-Cabral et al. (2013) based on the observed power of outflows driven by Cygnus X high-mass protostars. The lifetime of high-mass protostars also corresponds to ten times their free-fall time111Free-fall time is measured from the density averaged over the full MDC volume, which is eight times smaller than in Table 2., which for cloud structures with full-volume averaged densities of cm-3 is yr. As pointed out by Duarte-Cabral et al. (2013), because high-mass protostars should be free-falling cloud structures, their long lifetime may imply that the initial prestellar core had hundreds times smaller density than protostellar envelopes and that the latter grow in mass and density as they collapse. The following sections will give some arguments in favor of this scenario. Indeed, high-mass prestellar cores are still to be found (see Sect. 3.3) and the gas surrounding high-mass protostars and MDCs is observed to be flowing toward protostars (see Sect. 4.1).
The statistical lifetime of high-mass protostars is in rough agreement with what is found in nearby, low-mass star-forming regions ( yr, Kenyon & Hartmann, 1995; Evans et al., 2009). This is in marked contrast with the general belief that high-mass stars are living an accelerated life at all phases. While the yr-long UCHII phase (Mottram et al., 2011) is a factor of ten shorter than the pre-main sequence star phase of low-mass stars ( yr, Kenyon & Hartmann, 1995), the protostellar phase of high- and low-mass stars seems to last a rather similar span of time. This fact may permit star formation events to simultaneously develop both low- and high-mass stars.
3.1.2 Protostellar accretion
A concerted hunt for sources in the cold pre-UCHII phase and high-resolution follow-ups are necessary to make definitive progress in building a complete evolutionary scenario and providing empirical classifications of high-mass star precursors. Herschel surveys provided robust measurements of the basic properties (bolometric luminosity and mass) of MDCs thanks to the unprecedented wavelength coverage by SPIRE and PACS. This is crucial to building quantitative evolutionary diagrams such as the mass versus luminosity and outflow momentum versus luminosity, and , diagrams.
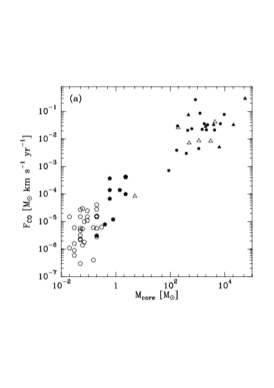
HMPOs selected as bright IRAS sources embedded within massive envelopes (Beuther et al., 2002a) are now recognized as having the same star-formation potential as IR-quiet clumps but being more evolved. Because HMPOs are more luminous than , they should indeed host high-mass protostellar embryos with masses larger than . Given that most of the high-mass star precursors observed at kpc should become stars on the main sequence, most HMPOs could contain high-mass protostars which have accreted more than half of their final mass, i.e. the high-mass analog of low-mass Class I protostars. Outflow studies of HMPOs suggest that the high- and low-mass star formation processes are similarly based on protostellar accretion but with much higher rates for the high-mass case, (Beuther et al., 2002b, see Figure 5a). Outflow studies of samples containing HMPOs and younger MDCs suggested that the outflow strength tracing protostellar accretion decreases with time (e.g., Motte et al., 2007; López-Sepulcre et al., 2011). This is consistent with the mass accretion rates derived from optically thick line profiles of MDCs and protostellar cores, (fuller05; Qiu et al., 2011; Herpin et al., 2012, 2016; Wang et al., 2013; Wyrowski et al., 2016). This is also in line with accretion rates measured from the global infalls mentioned in Sect. 4.1: a few (e.g., Schneider et al., 2010; Peretto et al., 2013). According to the inflow survey by Wyrowski et al. (2016), gas surrounding MDCs collapses at small fractions, , of the clump free-fall velocity. The physical processes that could slow the clump and MDC global collapse need to be investigated, but to name a few, one can think of magnetic field, rotation, or adiabatic heating (see Sect. 3.2, Figure 10c Murray & Chang, 2015).

The initial results of Beuther et al. (2002a) are confirmed by Duarte-Cabral et al. (2013), who studied the younger IR-quiet phase at the protostellar scale of 0.02 pc. They derived proper envelope mass, bolometric luminosity, and outflow momentum flux of individual protostars, and their results are directly comparable with those of low-mass studies (Bontemps et al., 1996, 2010a; Motte & André, 2001). Duarte-Cabral et al. (2013) built the protostellar evolutionary diagrams of mass versus luminosity and outflow momentum versus luminosity and proposed evolutionary tracks for individual high-mass stars (see, e.g., Figure 5b). The dispersion of high-mass protostars in the outflow momentum versus luminosity diagram supports a picture in which accretion is strong but sporadic (Duarte-Cabral et al., 2013): variations of a factor of 2 around the mean value of . Such sporadic accretion is expected when gas reaches the protostellar envelopes through gas inflows, such as those observed by Csengeri et al. (2011a) and modeled by Smith, Longmore & Bonnell (2009).
According to Bontemps et al. (2010b), high-mass protostellar envelopes are all more massive than the thermal Jeans mass of their parental MDC medium, (for cm-3, 15 K, and Mach, see Palau et al., 2015), and called super-Jeans (see also Wang et al., 2011; Tan et al., 2013; Ragan et al., 2012b; Peretto et al., 2014). This result along with the low fragmentation level found by Bontemps et al. (2010b) (see also Sect. 3.1.1) tend to exclude the protostar collision model of Bonnell, Bate & Zinnecker (1998) and equally favor the competitive accretion/global collapse models of Bonnell et al. (2001) or Hartmann, Ballesteros-Paredes & Heitsch (2012) and the turbulent core model of McKee & Tan (2003).
3.2 First magnetic field measurements in high-mass star-forming regions
As mentioned in the Sect. 1, the turbulent core model by McKee & Tan (2002) proposes that supersonic micro-turbulence prevents the fragmentation of MDCs and favors the formation of high-mass stars. Strong magnetic fields provide a natural alternative to such high turbulence levels. Numerical simulations of magnetized cores indeed demonstrated that the number of fragments is reduced by a factor of 2 in cores which are moderately super-critical, (M/)/(M/) (Commerçon, Hennebelle & Henning, 2011; Myers et al., 2013). These theoretical works, together with observational constraints of massive clumps globally collapsing at only 3% to 30% their free-fall velocity (Wyrowski et al., 2016) bring magnetic fields to the forefront of future studies on the high-mass star formation process. Unfortunately, it has been notoriously difficult to measure magnetic fields and even more difficult to follow their topology and strength evolution from clouds to cores.
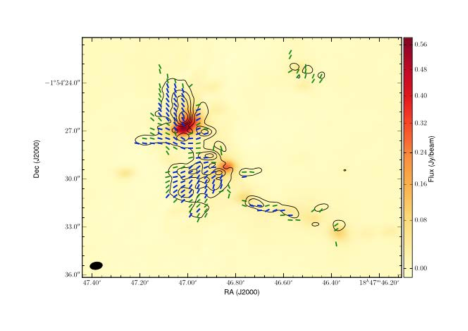
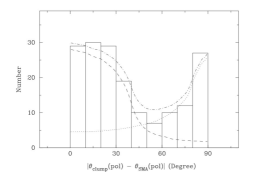
Magnetic field lines traced by optical polarimetry or dust polarization are observed, on 1-10 pc scales, to be perpendicular to long axes of ridges (e.g., Vallée & Fiege, 2006; Li et al., 2015). At (sub)millimeter wavelengths, thermal emission is partially depolarized and magnetic field lines get pinched where MDCs are located (see, e.g., Figure 6 Left, Cortes et al., 2016), as in the low-mass case (Girart, Rao, & Marrone, 2006). The hour-glass polarization configuration suggests that magnetic field lines are somewhat driven to smaller scales by the clump global collapse. The pioneer survey of Zhang et al. (2014) investigated the magnetic field topology of 21 high-mass star-forming clumps, from clump to MDC, 1 to 0.03 pc, scales. It showed that sub-parsec magnetic fields are rather organized and either aligned or perpendicular to magnetic fields in their parental clumps (see Figure 6 Right). It may indicate that magnetic fields play an important role during the collapse and fragmentation of massive molecular clumps into high-mass protostars. This interpretation however relies on the assumption that the plane-of-sky magnetic field orientation derived from dust linear polarization traces dense regions, while there are indications that it could mostly trace polarization diffusion on clump outskirts (Crutcher, 2012). Plane-of-sky magnetic field measurements derived from the Goldreich-Kylafis effect of lines could help better constrain the evolution of magnetic fields down to protostellar core scales.
Several methods are used to estimate the magnetic field strength, the most well-known being the Zeeman effect, which directly measures the line-of-sight magnetic field and the Chandrasekhar-Fermi method (Chandrasekhar & Fermi, 1953), which applies to plane-of-sky dust linear polarization measurements. Whereas in filaments the magnetic field energy dominates over turbulence, SMA observations of the DR21(OH) MDC showed that, at 0.1 pc scales, the magnetic field approximately is in equipartition with the turbulent energy (Girart et al., 2013). Studies of high-mass star-forming clumps found slightly super-critical mass-to-magnetic flux ratios, (M/)/(M/)crit, of 1.5-2 (Falgarone et al., 2008; Li et al., 2015; Pillai et al., 2016). If confirmed, such values show that magnetic fields of mG (e.g., Falgarone et al., 2008; Green et al., 2012; Cortes et al., 2016) are too weak to sustain MDCs against gravity and thus do not favor the turbulent core accretion model. Finally, the correlation of the magnetic field strength with density has a lower exponent than that for an isotropic gravitational contraction, with (Li et al., 2015). It therefore suggests that magnetic fields are, to some extent, still strong enough to channel the clump contraction.
The first magnetic field measurements performed in high-mass star-forming regions remain sparse and largely biased by the method used to constrain them. Larger surveys using complementary methods, like done by Pillai et al. (2016), are necessary to confirm if magnetic fields slow down the clump global collapse, limit its fragmentation level, and possibly drive its clump gas inflows toward protostellar cores.
3.3 High-mass prestellar cores, the current holy-grail
The controversy remains about the existence of high-mass analogs of low-mass prestellar cores. Indeed, while it is tempting to think that high-mass star formation goes through the same pathway as that of low-mass counterparts, observers tried, for the past ten years in vain, to identify good candidates for being high-mass prestellar cores. Extrapolating the prestellar core definition of, e.g., Ward-Thompson et al. (1994) and André, Ward-Thompson & Barsony (2000), high-mass prestellar cores should be small-scale, pc, gravitationally bound cores with high densities, cm-3, and with no hydrostatic protostellar objects at their centers.
The turbulent core model by McKee & Tan (2003) uses massive, gravitationally-bound starless cores in initial conditions. It invokes that these so-called high-mass prestellar cores are more massive than the thermal Jeans mass because they are supported against collapse and fragmentation by a large degree of turbulence and/or a strong magnetic field. High-mass virialized prestellar cores should also be in approximate pressure equilibrium with their surroundings and quasi-statically evolving toward higher degrees of central condensation, in marked contrast with protostars that are close to free-falling. As a direct consequence of these slow versus fast evolutions, one would expect, like in the low-mass case, to detect up to ten times more high-mass prestellar cores than high-mass protostars.
3.3.1 The observational quest for high-mass prestellar cores
This observational quest started with single-dish surveys, searching for the parental starless MDCs or starless clumps, whose pc sizes ensure them to be resolved at a distance of kpc. These surveys looked for these cloud structures, both though their far-IR to millimeter emission and their mid-IR extinction.
3.3.1.1 The quest within far-infrared to submillimeter massive dense core samples
Samples of cold MDCs were first built from ground-based millimeter surveys and later, interferometric high-resolution images of their internal structure permitted to look for prestellar cores at their centers. In the pioneer study by Motte et al. (2007), no starless object was found within their complete, unbiased, and homogeneous sample of MDCs built at 1.3 mm (see Sect. 3.0.1). This was rather surprising because one would expect to detect one to ten times more starless MDCs than protostellar MDCs and 42 protostellar MDCs were identified. The SiO emission used by Motte et al. (2007) to determine the protostellar nature of Cygnus X MDCs was subsequently imaged at higher-angular resolution and showed not to be systemically associated with outflows (Duarte-Cabral et al., 2014). These interferometric follow-up studies allowed revising the nature of Cygnus X MDCs given by Motte et al. (2007) and recognizing CygX-N40 as a unique starless MDC candidate. It has a 0.16 pc size, a 100 mass and is not detected by Herschel/PACS at 70 m (Motte et al., 2007; Duarte-Cabral et al., 2013). However when observed in continuum at the 0.02 pc scale of high-mass protostars, CygX-N40 gas mass is dispersed into diffuse cloud structures with only a low-mass, , core called CygXN40-MM1 (Bontemps et al., 2010b; Duarte-Cabral et al., 2013). Therefore, the initial result of Motte et al. (2007) arguing for starless MDC to be few in numbers or even missing remains valid.
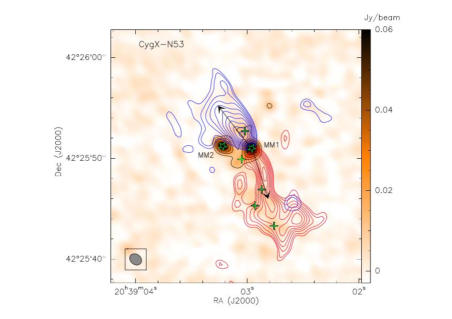
Prestellar cores could also be hosted within IR-quiet (young) protostellar MDCs. An interferometric study of IR-quiet MDCs in Cygnus X showed that all massive sub-fragments at 0.02 pc scales are associated with outflows, except CygXN53-MM2 (Duarte-Cabral et al., 2013). With its mass reservoir within 0.025 pc, this source is one of the best high-mass prestellar core candidate identified to date (Bontemps et al., 2010b; Duarte-Cabral et al., 2013, see Figure 4 Left). Owing to the confusion caused by the neighbor CygXN53-MM1 protostar, it is however difficult to exclude that the N53-MM2 core is driving a weak outflow as a low- or intermediate-mass protostar would do.
In the much more extreme star-forming region called W43 (see Sect. 4.2), Motte, Schilke & Lis (2003) identified tens of IR-quiet MDCs, among which is the W43-MM1 object having and within 0.23 pc (see also Bally et al., 2010). Imaged at 0.05 pc resolution, W43 displays the extremely massive Class 0-like protostar W43-N1 ( within 0.03 pc) and five starless MDC candidates, without detected outflows: W43-N3, N8, N9, N10, and N11 (Louvet et al., 2014, 2016). When observed with ALMA at 0.01 pc resolution, these 0.07 pc MDCs only host 0.02 pc cores of currently unknown nature (Nony et al. in prep.). Further investigation is therefore needed to convincingly identify a high-mass prestellar core in the W43-MM1 ridge.
At 0.1 pc scales, the similar lack of starless MDCs has been reported within the NGC 6334-6357 MDC sample through millimeter imaging of the complex (Russeil et al., 2010). Starless candidates are also found to be fewer in numbers, , with respect to their protostellar counterparts in less homogeneous Galactic plane samples of larger-scale massive clumps/clouds surveyed at (sub)millimeter wavelengths (Ginsburg et al., 2012; Tackenberg et al., 2012; Csengeri et al., 2014; Traficante et al., 2015).
Submillimeter surveys therefore show that high-mass prestellar cores are in an elusive phase. No final conclusion can however be derived from single-wavelength (sub)millimeter surveys alone because they remain partly biased against cold precursors of massive stars/clusters. Indeed, a single temperature, often 20 K, assumed for both cold starless objects and slightly warmer IR-quiet protostellar ones, underestimates the mass of starless objects and thus their number above a given mass threshold. To solve this issue, the NGC 6334 molecular complex was investigated with Herschel. Thanks to their careful dust temperature measurements, Tigé et al. (2017) found as many starless as protostellar MDCs, 16 in numbers. The dust temperatures of starless MDCs have been measured to be 15 K, explaining by itself why Russeil et al. (2010) underestimated the number of starless MDC candidates, above their mass threshold of within 0.13 pc. Galactic plane surveys adjusting the temperature of each massive clumps/clouds have also found starless candidates with 15 K temperatures but, as for MDCs, in equal or smaller numbers () than their protostellar counterparts (Traficante et al., 2015; Svoboda et al., 2016).
Starless MDC and starless clump candidates are also found to have smaller densities than the protostellar ones (Tigé et al., 2017; Svoboda et al., 2016). So, many of the starless MDC candidates found in NGC 6334 are a factor of less dense, at a similar physical size, than protostellar MDCs and could as well form a cluster of intermediate-mass stars. A direct consequence is that no starless MDC from the sample could engender their neighbor protostellar MDCs assuming quasi-static compression. For their starless clump/cloud candidates (SCCs), Svoboda et al. (2016) themselves propose that their starless candidates will either not form any high-mass star or will further gain mass from their surroundings before reaching the protostellar state.
The complete and well-characterized MDC sample of Tigé et al. (2017) is currently the more appropriate to evaluate the probability that high-mass prestellar cores do exist. The ability of NGC 6334 starless MDCs to form a high-mass star is in fact debatable. Most of them are located on top of filamentary structures, whose flux could have contaminated the Herschel bands and thus overestimated the mass of MDCs. Confirming this suspicion, a handful of these MDCs were observed at higher-angular resolution and proved not to be centrally concentrated but to mostly contain diffuse gas (Ph. André priv. com.). The complex structure and moderate density of starless MDC candidates put into doubt their ability to concentrate enough mass into a high-mass prestellar core. Tigé et al. (2017) therefore estimate that the 16 starless MDCs in NGC 6334, should contain in total, at most, one to seven high-mass prestellar cores. MDC#5, also called HOBYS_J172053.0-354317, is their best candidate starless MDC with its unresolved size, pc, and high mass, 210 . Higher-resolution studies of NGC 6334 MDCs are necessary to finally prove that massive prestellar cores do or do not exist and some are actually ongoing.
3.3.1.2 The quest within infrared-dark clouds fragments
IRDCs have, for long, been considered as the birth place of high-mass stars and could also reveal some high-mass prestellar cores. They however are too numerous and not massive and dense enough to all be forming high-mass stars (e.g., Peretto & Fuller, 2010). Moreover, the vast majority of massive IRDC fragments do harbor IR-quiet high-mass protostars (e.g., Pillai et al., 2006; Rathborne et al., 2010; Peretto & Fuller, 2010). Fragmentation and follow-up studies of IRDCs have provided a few samples of cold massive clumps, some of which are quiescent and could be starless (e.g., Rathborne et al., 2010; Traficante et al., 2015).
The best characterized sample was selected among the 38 IRDCs studied by Rathborne, Jackson & Simon (2006) and consists of the ten IRDCs that are the closest and show the highest contrast against the Galactic mid-IR background (Butler & Tan, 2009). Among the IRDC fragments identified at 1 mm by Rathborne, Jackson & Simon (2006), Butler & Tan (2012) found 42 starless dense cores/clumps of masses within pc. Tan et al. (2013) and Kong et al. (2017) observed with ALMA these clumps, which are more massive than and display high deuteration fractions – these are generally taken as a youth indicators (Fontani et al., 2011). ALMA marginally resolved the size scale of individual cores ( pc versus pc) and only revealed low- to intermediate-mass cores, with the notable exceptions of the G028C1-S and G028C9A MDCs: within 0.09 pc and within 0.05 pc. These MDCs are definitively super-Jeans and reminiscent of the starless MDCs identified by Tigé et al. (2017). Follow-up studies of G028C1-S however revealed it actually harbors two protostars driving outflows (Tan et al., 2016) and G028C91 could consist of two lower-mass cores (Kong et al., 2017). We recall that G028C1-S source was long considered as the prototype high-mass prestellar core, potentially representing the initial conditions necessary for the turbulent core model.
Other high-resolution studies toward IRDCs generally detected several starless MDC candidates, but only very few prestellar cores at the 0.02 pc scale of high-mass protostars. For instance, the starless MDC candidate S13-MM2, with within 0.21 pc (Peretto et al., 2014), probably has a too-low density to be able to form a high-mass protostar in the near future. In parallel, interferometric studies of the G28.34+0.06 and G11.11-0.12 IRDCs, down to the protostellar scale, discovered several high-mass protostars and only a single high-mass prestellar core candidate, G11P6-SMA1, which has a mass within 0.02 pc (Wang et al., 2011, 2014, see Figure 4 Right).
For the sake of completeness, one should mention the strong submillimeter continuum source without molecular emission, G11.92-0.61-MM2, proposed by Cyganowski et al. (2014) to be a high-mass prestellar core with an estimated mass of within 0.005 pc. Because prestellar cores should probably be large and warm enough for molecular line emission to be detected, there is reasonable doubt that this object is a Galactic cloud structure.
3.3.2 Gas mass concentration at starless stages
High-resolution studies of starless MDC suggest that most of them may not contain fragments dense and massive enough to be the high-mass analogs of prestellar cores (Duarte-Cabral et al., 2013; Tan et al., 2013). This could be related to the gas mass concentration of starless structures in a turbulent cloud.
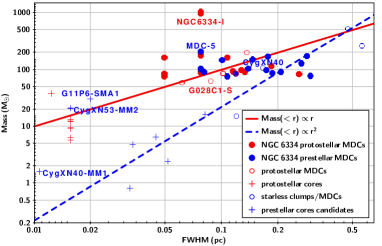
Indeed, when located in the mass versus radius diagram of Figure 7, starless MDCs and their hosted fragments approximately follow a relation (Butler & Tan, 2012; Tan et al., 2013, blue open circles and crosses, respectively). This mass concentration with spatial scale is close to the one found in non-centrally concentrated, turbulent clouds with large fragmentation level like CO fractal cloud structures: with (Larson’s law, Kramer, Stutzki & Winnewisser, 1996; Heithausen et al., 1998). This is in marked contrast with the relation predicted for Bonnor-Ebert spheres (Bonnor, 1956; Johnstone et al., 2000) and the one found for samples of gravitationally-dominated low-mass prestellar cores (e.g., Motte et al., 2001; Könyves et al., 2015). We recall that a mass concentration is expected for cloud structures with a radial density structure, like observed for protostellar envelopes and the outskirt of prestellar cores (Motte & André, 2001; Mueller et al., 2002; Ward-Thompson, Motte & André, 1999). In agreement, the IR-quiet protostellar MDCs found in Cygnus X and their hosted high-mass Class 0-like protostars (Motte et al., 2007; Bontemps et al., 2010b, red open circles and crosses, respectively) follow a relation in Figure 7.
Interestingly, the CygXN53-MM2 and G11P6-SMA1 cores and their parental MDC/clump rather concentrate as , arguing for their gravitationally-dominated nature. In contrast, the CygXN40-MM1 core follows the relation, typical of turbulence-dominated starless sources. According to this empirical mass versus size relation and assuming a 40% star formation efficiency (e.g., Alves, Lombardi & Lada, 2007; Könyves et al., 2015), high-mass prestellar cores of within 0.02 pc size should be found in turbulence-dominated, starless MDCs more massive than , within a 0.1 pc size. In NGC 6334, only four of the starless MDC candidates are above this mass threshold (Tigé et al., 2017), and HOBYS_J172053.0-354317 is among them.
After ten years of research, only two high-mass prestellar core candidates have therefore been identified: CygXN53-MM2 and G11P6-SMA1 (Bontemps et al., 2010b; Wang et al., 2014, see Figures 4). Interferometric studies toward large samples of starless MDC and IRDC fragments are ongoing. We are thus at the dawn of finally proving that massive prestellar cores do or do not exist.
3.4 Evolutionary scenario of high-mass star formation
3.4.1 High-mass prestellar core lifetimes
What do we know from the very few known high-mass prestellar cores (see Sect. 3.3.1 and Figures 4) suggests that their lifetimes are, at most, very short. Like for protostars described in Sect. 3.1.1, the lifetime of a high-mass prestellar core in a given region is estimated relative to the known ages and numbers of OB stars. According to the detailed statistical study of Tigé et al. (2017), high-mass prestellar cores should live for less than yr (see Table 2). This upper value agrees with extrapolations, from 0.1 pc to 0.02 pc scales, made of statistical MDC results of Motte et al. (2007) in Cygnus X (see Table 2). Duarte-Cabral et al. (2013) also proposed a prestellar lifetime of yr, from the detection of a unique high-mass prestellar core candidate in Cygnus X, CygXN53-MM2 (see Figure 4 Left). Because all studies only measured upper limits, the lifetime of the prestellar phase of high-mass star formation should be more than one order of magnitude smaller than what is found for low-mass stars in nearby star-forming regions ( yr, Onishi et al., 2002; Kirk, Ward-Thompson & André, 2005). As a matter of fact, a short prestellar phase is also suggested by the low level of deuteration of organics observed toward massive hot cores with respect to their low-mass counterparts (e.g., Faure et al., 2015). Interestingly the statistical lifetime of starless MDC and starless clump candidates is also estimated to be short: yr (Motte et al., 2007; Russeil et al., 2010; Csengeri et al., 2014; Svoboda et al., 2016, see Table 2). These lifetimes therefore suggest that high-mass prestellar cores and starless MDCs/clumps should be in a highly dynamical state, as expected in a molecular cloud where turbulence and/or organized flow processes dominate.
In the intermediate-mass regime, Herschel surveys of the Rosette molecular complex and the IRDC G035.39-00.33 have identified a few starless candidates, suggesting a lifetime of yr (Motte et al., 2010; Nguyn Lu’o’ng et al., 2011a). The lifetime of intermediate-mass prestellar cores may thus be a few times shorter than what is found in nearby low-mass star-forming regions and somewhat longer than that constrained in high-mass star-forming complexes. This result agrees with the statement by Kirk, Ward-Thompson & André (2005) that starless structures have lifetimes varying from 1 to 10 times their free-fall time, depending on their density. They proposed that the denser the starless structure or prestellar core the fewer free-fall times they live, with the minimum being close to a single free-fall time. This recalls the empirical correlation found by Svoboda et al. (2016) between the lifetime of starless and protostellar clumps/clouds and their mass.
In this framework, high-mass prestellar cores, postulated to be super-Jeans and thus very dense, should live for about one single free-fall time and be free-falling as soon as they form. The free-fall time of a putative high-mass prestellar core of full-volume averaged densities equivalent to that of high-mass protostars, cm-3, is yr. Therefore, current high-resolution studies, which remain limited in terms of statistics, could still have failed in detecting high-mass prestellar cores (see Table 2).
3.4.2 Individual collapse of a turbulent core or global hierarchical collapse of a clump?
The evolutionary sequence found for high-mass star formation finally permits to start discussing the physical processes at work during the high-mass star formation. With current lifetime constraints, it is statistically possible that high-mass stars form from high-mass pre-stellar cores, in a manner that can be considered a scaled-up version of low-mass star formation (see, e.g., André, Ward-Thompson & Barsony, 2000). Like proposed by the turbulent core model (McKee & Tan, 2002) and suggested by accretion and velocity dispersion constraints (see Sect. 3.1.2), high-mass prestellar cores would form and remain un-fragmented, i.e. monolithic, thanks to turbulent and/or magnetic supports. Given that their lifetimes are as short as about one free-fall time (see Sect. 3.4.1), high-mass prestellar cores cannot form quasi-statically over several free-fall times as was assumed by McKee & Tan (2002). High-mass prestellar cores must thus quickly assemble their mass and collapse as soon as they reach the necessary mass, which is qualified as super-Jeans (see Sect. 3.1.2). In the turbulent core model, prestellar cores on the verge of their collapse should be static and isolated from their surroundings. As soon as they loose their supplementary turbulent and magnetic support, high-mass prestellar cores start to collapse and enter the protostellar phase. The process leading from the run-away global collapse observed at clump and MDC scales (Csengeri et al., 2011a; Schneider et al., 2010, see Sect. 4.1) to a quasi-static configuration at the prestellar core scale of pc still needs to be found.
The alternative interpretation of short lifetimes for the high-mass prestellar phase is that high-mass prestellar cores simply do not exist as small, 0.02 pc, condensations, isolated from their environment. Both the lifetime of high-mass protostars and the infalling gas observed down to the protostellar scale indeed invoke that high-mass stars form while still strongly interacting with their surroundings. First, the high-mass protostellar lifetime suggests that the collapse starts within a low-mass prestellar core and continues within a protostellar envelope, which grows from low to high mass (e.g., Tigé et al., 2017, see Sect. 3.1.1). Moreover, high-mass stars form into infalling clumps at 1 pc scales, whose global collapse drives inflowing gas streams toward protostars at 0.01 pc scales (e.g., Schneider et al., 2010; Csengeri et al., 2011a, see Sect. 4). This evolutionary scenario corresponds to the global hierarchical collapse theory of, e.g., Vázquez-Semadeni et al. (2009, 2017). It can be seen as an extension of the competitive accretion model, when accretion through inflowing gas streams driven by gravity replaces the Bondi-Hoyle accretion (Smith, Longmore & Bonnell, 2009). In this scenario high-mass protostars would then be fed from the gas of their surrounding MDC/clumps, following the clump-fed scenario of protostellar accretion, in contrast with the the core-fed scenario of low-mass protostellar accretion and of the McKee & Tan (2002) model.
In the global hierarchical collapse scenario, the high-mass equivalent of prestellar cores could therefore be low-mass cores within massive infalling MDCs/clumps. The inner low-mass core will first be prestellar then protostellar before it becomes a high-mass protostar. Structural studies alone would not be able differentiate massive MDCs which will form high-mass stars, from those forming a cluster of intermediate-mass stars. In contrast, kinematics studies can themselves give clues on the future gas mass accretion expected toward the inner low-mass cores. Ridges and hubs, defined in Sect. 4.1, may constitute the parsec-scale gas reservoir/clumps, from which gas is accreted onto 0.02 pc-scale cores. The global hierarchical collapse theory invokes that ridges and cores simultaneously form and get denser.
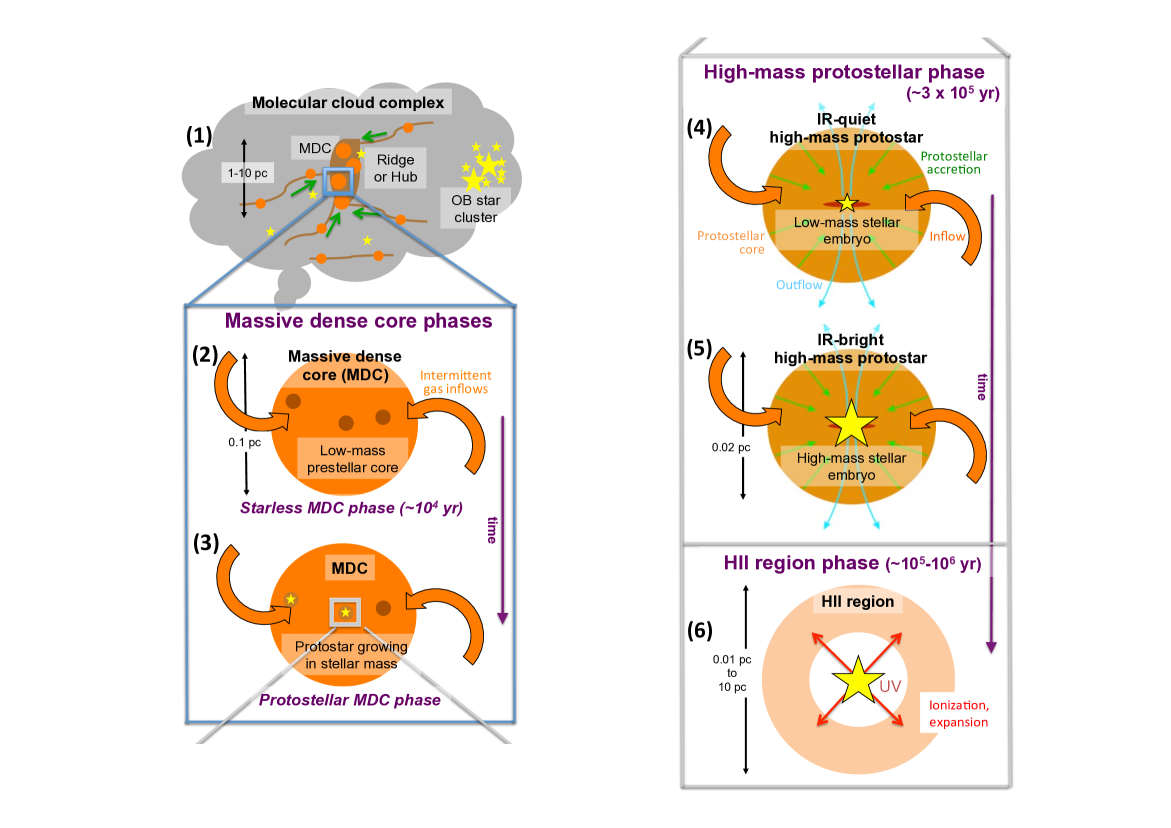
Figure 8 illustrates the evolutionary scheme we propose for the formation of high-mass stars. Based on observational constraints given in Sects. 3.1.1, 3.1.2, 3.4.1, and 4.1, it follows an empirical scenario qualitatively recalling the global hierarchical collapse and clump-fed accretion scenarios (Vázquez-Semadeni et al., 2009; Smith, Longmore & Bonnell, 2009). Despite the large binary fraction of high-mass stars, present scenario cannot yet include their formation because observational constraints are lacking.
-
1.
High-mass stars form in molecular complexes hosting massive clouds and often OB clusters. Parsec-scale massive clumps/clouds called ridges and hubs are the preferred, if not the only, sites for high-mass star formation. Their infall velocity and density structure suggest ridges/hubs undergo a global but controlled collapse.
-
2.
At first, IR-quiet massive dense cores (MDCs) are 0.1 pc massive cloud fragments, which host low-mass prestellar cores. They represent the starless MDC phase lasting for about one free-fall time, yr.
-
3.
At the MDC center, low-mass prestellar cores become protostars with growing mass and not high-mass prestellar cores. The global collapse of ridges/hubs generates gas flow streams, which simultaneously increase the mass of MDCs and, on 0.02 pc scales, that of their hosted protostar(s). Typically, in yr, two high-mass protostars form in 0.1 pc MDCs.
-
4.
When inflowing gas streams are efficient to reach and feed the low-mass protostellar cores, the latter become IR-quiet high-mass protostars. They have 0.02 pc sizes, super-Jeans masses, but still only harbor low-mass, , stellar embryos. Their accretion rates are strong, they drive outflows and power hot cores.
-
5.
When stellar embryos reach more than , their luminosity sharply increases and high-mass protostars become IR-bright. Their hot cores grow in size and they soon develop HCHII regions quenched by infalling gas or localized toward photo-evaporating disks.
-
6.
Stellar embryos have increasing UV fields that develop HII regions, which, along with other processes including outflows and winds, slow and later on eventually stop gas accretion toward the newborn star. This terminates the main accretion phase.
4 MASSIVE CLOUD AND MASSIVE CLUSTER FORMATION
The scenario proposed in Sect. 3.4.2 and shown in Figure 8 is consistent with a scenario proposing that high-mass star formation develops simultaneously and in tight link with the formation of massive clouds and massive clusters. In the following, we show that the structure and kinematics of massive clouds are extreme relative to those of low-mass star-forming regions (see Sect. 4.1). As a consequence, massive clouds can sustain intense star formation activity, which impacts the content of their future stellar clusters (see Sect. 4.2).
4.1 High-density dynamical clumps quoted as ridges and hubs
Because the formation of high-mass stars requires more mass than that of low-mass stars, high-mass star-forming sites have always been looked for among the most massive cloud structures. Massive molecular cloud complexes, defined as 100 pc cloud ensembles with masses, are quantitatively larger than those of Gould Belt clouds (see Table 3). Mass is however not a sufficient parameter and several authors proposed that cloud gas density is the one allowing, or not allowing, the formation of high-mass stars (e.g., McKee & Tan, 2002; Motte et al., 2007, see also Figure 7).
At the pc clump to cloud scales, some massive filaments and extreme IRDCs have been found close to the gravity center of molecular cloud complexes. One striking example is the prototypical DR21 ridge, located at the heart of the CygX-North cloud (Motte et al., 2007; Schneider et al., 2010, see Figure 3-Left). Herschel allowed for quantitative studies of massive filaments through their column density and temperature images and direct comparison with their protostellar population (see Figures 9 and 11 Left). Within the massive molecular complexes imaged by the HOBYS key program, high-density dominating clumps, are confirmed to be the preferred sites for forming massive stars (e.g. Hill et al., 2011; Nguyn Lu’o’ng et al., 2011a; Tigé et al., 2017). The so-called ridges are high-density filaments, cm-3 over 5 pc3, forming clusters of high-mass stars (e.g., Schneider et al., 2010; Nguyn Lu’o’ng et al., 2013; Hennemann et al., 2012) while hubs are more spherical, smaller clumps forming at most a couple of high-mass stars (e.g., Peretto et al., 2013; Rivera-Ingraham et al., 2013; Didelon et al., 2015, see Figure 1). The most extreme IRDCs qualify as ridges or hubs and the densest ridges coincide with the precursors of young massive clusters (e.g., Nguyn Lu’o’ng et al., 2011a, 2013; Ginsburg et al., 2012, see also Sect. 4.2). The existence of ridges/hubs is predicted by dynamical models of cloud formation such as colliding flow simulations (e.g., Heitsch & Hartmann, 2008; Federrath et al., 2010) and some analytical theories of filament collapse (Myers, 2009).
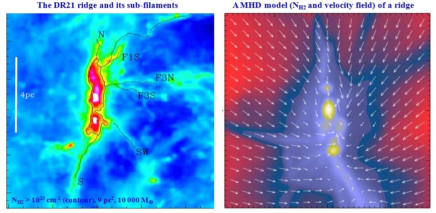
When imaged with molecular lines, column density, or extinction, ridges/hubs seem to be the focus points of large amounts of gas structured in filaments (see Figures 1 and 3). These massive filament networks have a more spherical/elliptical geometry (see Figure 9a) than the prototypical Taurus filament, which is perpendicularly crossed by subcritical filaments called striations (B211/3 Palmeirim et al., 2013). Density-wise sub-filaments are reminiscent of the most massive low-mass star-forming filaments. It would take the merging of tens of them to form ridges, and that could then be considered as a second generation of supercritical (gravitationally bound) filamentary structures (Hennemann et al., 2012). Velocity drifts of one to a few are observed along sub-filaments, which converge toward ridges/hubs, suggesting drifts feed subfilaments by funneling the surrounding gas (e.g., Schneider et al., 2010; Peretto et al., 2013). Ridges and hubs would therefore be large gravity potentials attracting filaments, sometimes following a fan-shaped structure. Numerical simulations of high-density collapsing clumps agree with such a picture (Hartmann & Burkert, 2007; Schneider et al., 2010; Gómez & Vázquez-Semadeni, 2014, see Figure 9b).
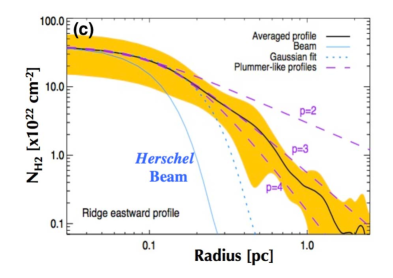
Molecular line imaging, with the combination of optically thick and thin lines, have revealed that ridges and hubs undergo global collapse with supersonic inward velocities, over pc2 (Schneider et al., 2010; Peretto et al., 2013, see Figure 10a). This strong result builds on initial studies by, e.g., Rudolph et al. (1990), Wu & Evans (2003), and Motte et al. (2005) and agrees with simulated line profiles of collapsing clumps (Smith et al., 2013). The general structure of collapsing ridges may reflect gas compression. They indeed have steeper radial density profiles than the classical law (see Figure 10c Hennemann et al., 2012; Didelon et al., 2015) and display long gravity tails and even secondary tails in their column density probability distribution functions (PDFs, Hill et al., 2011; Russeil et al., 2013; Schneider et al., 2015a, b). In some intermediate-mass clouds, similar but slower global collapses have been observed (Loren, 1977; Peretto, André & Belloche, 2006; Kirk et al., 2013) and suggested to result from cloud-cloud collision (Nakamura et al., 2014). Infall motions, sometimes called gravitational focusing, are expected in colliding flow models (e.g., Vázquez-Semadeni et al., 2007; Hartmann & Burkert, 2007) as well as in ionization compression models (e.g., Tremblin et al., 2012). In any case, whatever the origin of the additional pressure, arising from colliding flows or ionization, it supersedes the thermal and micro-turbulence pressure inducing ridges and hubs to collapse.
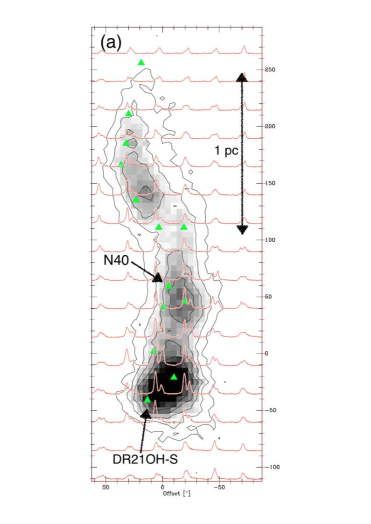
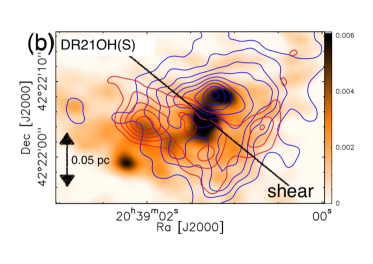
Detailed analyses of the ridge inner structure suggest they are braids/bundles of filaments (Hennemann et al., 2012; Henshaw et al., 2014), like the main Taurus filament (B213, Hacar et al., 2013). Kinematic imaging of ridges, with high-density molecular lines such as N2H+, indeed revealed multiple velocity components, interpreted as sub-filaments which sometimes cross each others (e.g., Galván-Madrid et al., 2010; Henshaw et al., 2013, 2014; Tackenberg et al., 2014). In the high-density, complex medium of ridges, these sub-filaments are difficult to recognize and disentangle from each others. The non-homogeneous structure of ridges and their potential rotation along the big axis could partly explain why their inflow rate would be smaller than free-fall (Wyrowski et al., 2016). An indirect evidence of these filament bundles arises from the detection of shocks associated with gas shears created by this braiding. Large-scale SiO emission has been found along several ridges, suggesting shock velocities of (Jiménez-Serra et al., 2010; Nguyn Lu’o’ng et al., 2013; Sanhueza et al., 2013; Duarte-Cabral et al., 2014; Louvet et al., 2016). A detailed shock modeling of the strong and extended, 5 pc, SiO emission found along the W43-MM1 ridge proved that the low-velocity shock, developing within high-density ridges can liberate SiO from the grains (Louvet et al., 2016).
The complex structure and high dynamics of ridges may have direct consequences for the building phase of 0.1 pc MDCs and their 0.02 pc protostellar cores. In the global hierarchical collapse model of Vázquez-Semadeni et al. (2009) (see also Smith, Longmore & Bonnell, 2009), the gas mass accretion rate onto MDCs and individual cores is determined by their tidal radii and initial ridge structure. In contrast, the isolated turbulent core model of McKee & Tan (2002) postulates that the ridge kinematics does not impact much the protostellar collapse as global infall should somehow be stopped at MDC scales. A pioneer study has been performed within Cygnus X and especially the DR21 ridge MDCs (Csengeri et al., 2011b) (see also Galván-Madrid et al., 2009). This kinematical study found high-density gas streams inflowing on 0.05 pc scales and developing 2 km s-1 shears in the immediate proximity of Cygnus X high-mass protostars (with H13CO+ and CH3CN lines, Csengeri et al., 2011a, b, see Figure 10b). Investigating many more ridges, with a series of angular resolutions, is necessary to properly follow inflowing gas from the ridge to the MDC, and finally the protostellar scales. This is a challenging but mandatory step to better understand star formation in ridges. As for now, the only secure conclusion one can derive is that ridges and hubs are highly dynamical medium, within which prestellar cores can probably not be long-lived objects, in agreement with statistical studies (see Sects. 3.1.1 and 3.4, Motte et al., 2007; Tigé et al., 2017).
4.2 Mini-starburst activity within ridges
The extreme characteristics of ridges and hubs, in terms of density and kinematics (see Sect. 4.1), could lead to an atypical star formation activity. Star formation efficiencies (SFE) and rates (SFR) are indeed predicted to continuously increase with gas density (e.g., Hennebelle & Chabrier, 2011). The clear accumulation of high-mass protostars observed along ridges (see, e.g., Figure 11 Left) in fact tends to suggest an intense star formation activity.
Among the numerous methods used to estimate SFRs, the two more direct ones, based on young star or protostar counting, are the most relevant for estimates in nearby clouds of the Milky Way (see, e.g., Vutisalchavakul, Evans & Heyer, 2016). Several authors have used near- to mid-IR imaging, such as those done with Spitzer, to measure SFRs. They either counted pre-main sequence, T Tauri, stars or integrated the diffuse mid-IR polycyclic aromatic hydrocarbon (PAH) emission attributed to the luminosity impact of recently formed OB stars on the cloud. The first method is the only direct one. It was applied in nearby, 500 pc, low-mass star-forming regions (e.g., Heiderman et al., 2010; Dunham et al., 2015). The second method was used when the angular resolution was not sufficient for counting purposes, for example for Galactic molecular complexes (Nguyn Lu’o’ng et al. 2011b; see also Eden et al. 2012 using Herschel m). If the star formation activity varies with time, these two methods, based on years-old T Tauri and years-old OB stars, would measure past and integrated SFRs.
In contrast, counting years-old protostars permits evaluation of the current and instantaneous star formation activity, meaning the star formation developing for a few free-fall times of MDCs. This method was applied first on regions imaged by ground-based submillimeter radio-telescopes (e.g. Motte, Schilke & Lis, 2003; Maury et al., 2011) and more recently on Herschel images (e.g. Nguyn Lu’o’ng et al., 2011a; Sadavoy et al., 2014).
On the ridge spatial scale, 1 pc, current and instantaneous SFRs have been estimated for a few ridges (e.g., Motte, Schilke & Lis, 2003; Nguyn Lu’o’ng et al., 2011a; Louvet et al., 2014). They have star formation rate densities, yr-1 kpc-2, on pc2 areas, worthy of starburst galaxies, usually defined by (see Figure 11 Right). For this reason, G035.39-00.33 and W43-MM1 were called mini-starburst ridges, i.e. miniature and instantaneous models of starburst galaxies.
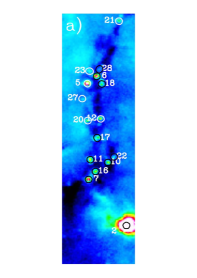
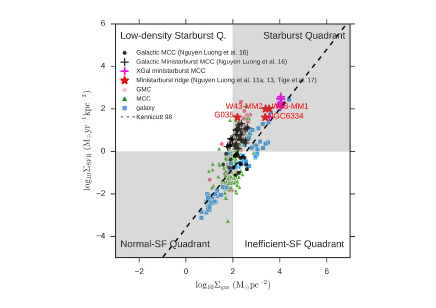
These mini-starburst events most probably follow the formation of the ridges, which was proposed to develop through gravitationally driven, and possibly colliding, flows (see Sect. 4.1). Indeed, short mini-bursts of star formation are to be expected after a fast episode of cloud formation (e.g., Vázquez-Semadeni et al., 2008) or, equivalently, for a cloud under compressive turbulent forcing (Federrath & Klessen, 2012). In this scenario the star formation should gradually settle within ridges. We should thus measure different SFR levels depending on the evolutionary status of ridges. To investigate this statement, one must calculate current and instantaneous SFRs, whose timescale, over which the SFR is integrated, remains much shorter than the ridge formation timescale, yr versus yr.
Louvet et al. (2014) measured instantaneous SFRs within regions of the W43-MM1 ridge and found a clear correlation of SFR with cloud density. This result recalls the correlation of the core formation efficiency (CFE, cloud concentration at high densities) with cloud density (see Motte, André & Neri, 1998; Bontemps et al., 2010b; Palau et al., 2013). Interestingly, SFR is smaller within the part of the ridge where the shocks associated with most recent cloud formation are the strongest (Louvet et al., 2014, 2016). Therefore, the dynamical ridge formation may well be followed by a series of intense bursts of star formation.
5 TOWARD GALAXY-WIDE SURVEYS
For a long time, the only way to work on comprehensive samples of high-mass star-forming sites was to focus on the nearest, massive molecular complexes (see Sect. 5.1). Galaxy-wide surveys performed during the past decade are now entering the maturity phase and provide the well-characterized samples of high-mass star and massive cluster precursors, which are necessary to make progress (see Sect. 5.2). In parallel, the physical processes of high-mass star and cluster formation will soon be investigated for variations throughout the Milky Way (see Sect. 5.3), with the ultimate goal to extrapolate them to other galaxies.
| Complex | dSun | Gas massa | Size | Ref.b | High-mass star-forming | |
|---|---|---|---|---|---|---|
| name | (kpc) | () | (pc) | (cm-3) | complex | |
| Cygnus X⋆ | 1.4 | 200 | 7.9 | (1) | Richest and most nearby | |
| Rosette⋆ | 1.6 | 96 | 6.1 | (2)(3) | Relatively isolated | |
| M16/M17⋆ | 1.7 | 120 | 9.1 | (4) | In the Sagittarius arm | |
| NGC6334-6357⋆ | 1.7 | 99 | 11.8 | (4) | In the Carina-Sag. arm | |
| Vulpecula | 2.0 | 140 | 5.1 | (4)(5) | Recently identified | |
| G345 | 2.0 | 116 | 6.1 | (4) | Recently identified | |
| W3/KR140⋆ | 2.2 | 140 | 4.6 | (6)(7) | In the Perseus arm | |
| Carina | 2.3 | 110 | 6.3 | (4)(8) | Formed a massive cluster | |
| NGC 7538⋆ | 2.8 | 65 | 20 | (9) | In the Perseus arm | |
| W48⋆ | 3.0 | 170 | 5.7 | (4) | In the molecular ring or | |
| 1.6 | 90 | 10.6 | (4) | at a much closer distance | ||
| Orion | 0.45 | 100 | 5.5 | (10) | Formed the ONC cluster |
-
⋆
Molecular complexes imaged by the Herschel/HOBYS survey (Motte et al., 2010).
-
a
The listed masses and average densities are, for homogeneity reasons, derived from 2MASS extinction maps. They are found to be similar to those derived using other methods such as CO surveys.
-
b
References: (1) Schneider et al. (2006); (2) Williams, Blitz & Stark (1995); (3) Heyer, Williams & Brunt (2006); (4) Bontemps et al. in prep.; (5) Billot et al. (2010); (6) Lada et al. (1978); (7) Carpenter, Heyer & Snell (2000); (8) Preibisch et al. (2012); (9) Ungerechts, Umbanhowar & Thaddeus (2000); (10) Tatematsu et al. (1998).
5.1 Most nearby, massive molecular cloud complexes
The most nearby cloud complexes are particularly interesting because they offer the opportunity to reach the smallest spatial scales and separate individual collapsing objects. To actually probe the accreting phase for high-mass star formation, it is however necessary to focus on the most massive such complexes. With a total mass of (Tatematsu et al., 1998), Orion is itself not massive enough to contain more than a couple of high-mass protostars. Such low numbers are estimated assuming typical cloud lifetime and SFE, yr and , a typical IMF with 10 of the stellar mass in high-mass stars, and a protostellar lifetime of yr (see Table 2). If we restrict ourselves to the IR-quiet high-mass protostellar phase, whose lifetime is even shorter, less than one such object is expected in Orion and indeed no high-mass IR-quiet protostar is known in Orion.
About ten years ago, to prepare the Herschel surveys (such as Herschel/HOBYS, Motte et al., 2010), S. Bontemps derived a near-IR extinction image of the Milky Way. Partly shown in Figs. 4-6 of Schneider et al. (2011), it was built from the stellar reddening measured by 2MASS and confirmed by CO surveys according to the method presented in Schneider et al. (2011). It led to the identification of 100 pc molecular cloud complexes, which are massive enough, , to contain high-mass protostars. Located at less than 3 kpc from the Sun, these cloud complexes can be imaged by Herschel with a spatial resolution below 0.1 pc at 70 m. Table 3 lists the seven complexes selected for the Herschel/HOBYS survey, Carina, and two recently identified complexes. They constitute a complete sample of molecular cloud complexes, which currently form high-mass stars at less than 3 kpc. The nearby cloud complexes of Table 3 contain 30 times more mass than Orion and one/two of them is/are among the most massive molecular cloud complexes known to date, (see Nguyn Lu’o’ng et al. 2016). The amount of molecular gas contained in these cloud complexes should provide about 80 OB star precursors and should statistically permit studying the precursors of stars with masses from 8 to . {marginnote}[] \entry2MASSThe Two Micron All Sky Survey scanned 70% of the sky in J, H, and K.
Because all Gould Belt clouds sum up to about but do not host high-mass star precursors (André et al., 2010), the combination of large mass and high density may be prerequisites for a cloud structure to be able to form high-mass stars. Orion indeed appears in Table 3 as those with both the lowest average density and lowest cloud mass. The Carina molecular complex is also interesting because it formed already several clusters hosting high-mass stars but may not form high-mass stars anymore (Gaczkowski et al., 2013). It remains to be investigated if the strong feedback effects of Carina HII regions do prevent further generation of high-mass stars to form in this rather massive cloud complex.
The most nearby, massive molecular cloud complexes are rich star-forming sites, whose study allowed researchers to make definite progress in the understanding of high-mass star formation, massive cloud and cluster formation (see Sects. 2–4). However, located up to 3 kpc, these complexes can only offer limited statistics to study the shortest, and therefore rarest, phases of the formation of high-mass stars. Therefore, Galaxy-wide surveys are required to fully investigate each step of the high-mass star formation process.
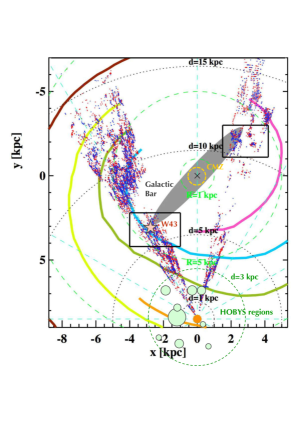
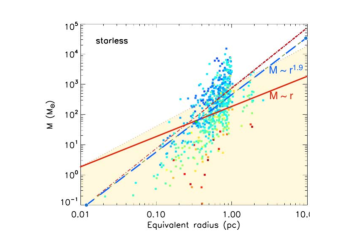
5.2 Combination of Galaxy-wide surveys and detailed images with ALMA
It is the convergence of large far-IR to millimeter imaging surveys of the Galactic plane, proper distance derivation analyses, and high-spatial resolution follow-up observations which has recently opened a new window on high-mass star formation. Large imaging surveys are required to get unbiased lists of high-mass star precursors. To recognize individual high-mass protostars and prestellar cores, Galactic plane studies need precise distance derivations and high-spatial resolution follow-ups. High-mass star-forming sites provided by Galactic plane surveys indeed spread over large, typically kpc, distance ranges, and most of them are expected to lie further than 5 kpc from the Sun (see, e.g., Figure 12a). We summarize below the results and prospects of the most relevant programs in this context.
[] \entryGLIMPSEThe Galactic Legacy IR Mid-Plane Survey Extraordinaire covered the Galactic plane at m. \entryMIPSGALThe MIPS GALactic plane survey covered the Galactic plane at 24 m (70 m band almost useless). The advent of large-format millimeter cameras on ground-based telescopes and of two space missions, Spitzer and Herschel, have provided a whole set of complete and sensitive surveys of the inner Galactic plane. The most sensitive and complete surveys are Spitzer/GLIMPSE and Spitzer/MIPSGAL from 4 to 24 m (Benjamin et al., 2003), Herschel/Hi-GAL from 70 to 500 m (Molinari et al., 2010), APEX/ATLASGAL at 870 m (Schuller et al., 2009), and the CSO/BGPS at 1.1 mm (Aguirre et al., 2011; Ginsburg et al., 2013). The Spitzer/GLIMPSE survey has been particularly successful to recognize and build complete samples of IRDCs (Simon et al., 2006a; Peretto & Fuller, 2009). The extremely green objects also appeared as useful probes of the earliest phases of (high-mass) star formation (EGOs, Cyganowski et al., 2011). {marginnote}[] \entryATLASGALThe APEX Telescope Large Area Survey of the Galaxy covered the whole inner Galactic plane at 870 m. \entryBGPSThe BOLOCAM Galactic Plane Survey imaged it at 1.1 mm from the Northern hemisphere.
Herschel/Hi-GAL becomes a reference survey for the earliest phases of high-mass star-forming sites in the Galactic plane (Molinari et al., 2016). With its five far-IR bands covering the SED peak of stellar precursors, it has the potential to trace both the column density and temperature of dusty cloud fragments. However, its highest resolution at the shortest wavelengths, at m, is barely sufficient to resolve clumps hosting protoclusters of 0.5 pc typical sizes when located at kpc from the Sun (see, e.g., Fig. 3 of Beltrán et al., 2013). Interferometric follow-ups at (sub)millimeter wavelengths, with e.g. ALMA, will thus be mandatory to probe individual protostellar or prestellar cores forming high-mass stars in these clumps. Until now, the Hi-GAL survey started the census of clumps throughout the Milky Way and discussed their evolutionary sequence from their earliest phases to the development of UCHII regions (e.g., Elia et al., 2017). Among the large numbers of high-mass star-forming sites, Hi-GAL identified hundreds of starless clump candidates, whose gas concentration resemble that of starless MDCs (e.g., Traficante et al., 2015, compare Figures 7 and 12b). The distribution, mass, and luminosity of clumps in the Galaxy was also used to estimate SFRs of some specific areas such as the tips of the Galactic long bar (Veneziani et al., 2017, see Figure 12a).
The ATLASGAL survey covered the whole inner Galactic plane at 870 m, with a resolution (Schuller et al., 2009). This uniquely complete survey of the submillimeter range revealed several thousands of dense clumps, mostly located at 2 to 8 kpc distances (e.g., Contreras et al., 2013; Csengeri et al., 2014, see Figure 13). Huge efforts have been dedicated to distance determination, using NH3 line detections of the most massive ATLASGAL clumps and innovative methods to resolve the distance ambiguity (Wienen et al., 2015). Recent VLBI determinations of maser parallaxes have shown that kinematic distances can still be inaccurate when there are large deviations from the mean rotation curve of the Milky Way. Wienen et al. (2015) incorporated the recent results from VLBI distance determinations to improve ATLASGAL clump distances. In the very near future, the release of GAIA catalogs will greatly improve the distance determination of Galactic young clusters (some massive stars in most, even distant, clusters are optically visible and will be part of the GAIA catalogs) and thus of their associated star formation sites. As for now, virtually all massive clumps detected by the ATLASGAL survey have reasonably well-determined distances. {marginnote}[] \entryVLBIThe Very Long Baseline Interferometry technique derives parallax distances for strong maser sources. \entryGAIAThe Gaia mission aims to chart a three-dimensional map of the Milky Way.
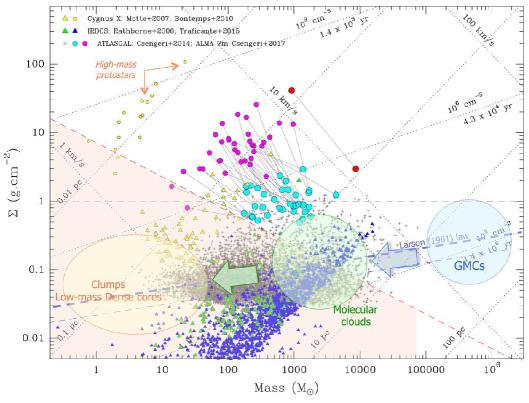
ATLASGAL and Hi-GAL are the perfect surveys to identify the targets to observe at high-resolution when the goal is to recognize and statistically study high-mass protostars and prestellar cores. Indeed, ATLASGAL and Hi-GAL catalogs (Csengeri et al., 2014; Elia et al., 2017) include 0.1 pc MDCs and 1 pc massive clumps that need to be investigated down to the 0.02 pc scale of protostars. While several surveys already identified a few cloud structures able to form high-mass stars (e.g., Motte et al., 2007, see Sect. 3.0.1), only Galaxy-wide surveys like ATLASGAL and Hi-GAL can reveal a statistically-significant number of clumps, which sit in the high-mass star formation regime (Csengeri et al., 2014; Traficante et al., 2015, see Figures 13 and 12b). Figure 13 shows the distribution of ATLASGAL clumps in a surface density versus mass diagram adapted from Tan et al. (2014). As part of a first ALMA imaging survey, as many as 35 of these ATLASGAL clumps were observed down to a 0.01 pc spatial resolution with the ALMA 7 m and 12 m antennas. They are the most massive ATLASGAL IR-quiet clumps at less than 4.5 kpc and thus are candidate precursors of the richest, highest-mass clusters of the Milky Way. The first results on the fragmentation properties of these clumps with the ALMA 7 m compact array is displayed in Figure 13 (Csengeri et al., 2017). It shows that most of these clumps are much more centrally concentrated than cloud structures following the Larson’s law (Larson, 1981). Their gas mass concentration close to is an indication that they are gravity-dominated and could have formed dynamically, in agreement with their short lifetime ( yr, Csengeri et al., 2014). The most massive ATLASGAL clumps also are overdense by one to two orders of magnitude with respect to the density-size Larson’s relation shared by typical cloud complexes and low-mass dense cores (sizes from 100 pc to 0.1 pc). Massive ATLASGAL clumps may thus originate from gas concentration loci associated with large-scale collapses rather than typical turbulent fluctuations (Csengeri et al., 2017).
This ALMA survey will investigate if MDCs further concentrate down to the individual core scale of 0.02 pc, as observed for Cygnus X and W43-MM1 protostellar MDCs (Bontemps et al., 2010b; Louvet et al., 2014, see Figure 13). This survey, along with other similar ALMA projects, will also have the potential to finally determine if high-mass prestellar cores exist or not.
5.3 Extreme molecular cloud complexes in the Milky Way and starburst clusters
The Milky Way offers a wide variety of star formation and cluster formation environments, from the Galactic disk to the bar and central regions which can be probed for environ,mental effects on the process of star and cluster formation. One can first investigate variations of the star formation activity across the Milky Way and test star formation models up to their limit by studying the extreme molecular cloud complexes of our Galaxy. They host very massive ridges or hubs, called mini-starburst clumps, precursors of young massive clusters, or even precursors of super star clusters (e.g., Motte, Schilke & Lis, 2003; Bressert et al., 2012). Their study is just starting as presented in the recent review by Longmore et al. (2014).
W43 probably is the best-studied of these mini-starburst regions. The molecular complex was identified from a combination of its CO and H I line cubes and ATLASGAL 870 m emission (Nguyn Lu’o’ng et al., 2011b). It has a 290 pc diameter and mass, characteristics quantitatively larger than those of nearby massive molecular complexes (see Table 3). W43 is located at the junction of the Scutum arm and the Galactic bar (Nguyn Lu’o’ng et al., 2011b; Carlhoff et al., 2013). Its star formation activity estimated from cloud concentration at 0.1 pc scales and from its Spitzer m emission suggests it qualifies as a mini-starburst (Motte, Schilke & Lis, 2003; Nguyn Lu’o’ng et al., 2011b). W43 host two ridges, whose cloud structure and star formation content are as extreme as in mini-starbursts (Nguyn Lu’o’ng et al., 2013; Louvet et al., 2014, see Sect. 4.2 and Figure 11 Right). The exceptional star formation activity measured in W43 is probably related to cloud-cloud agglomeration or collision events suggested from few hundreds of pc (Motte et al., 2014; Renaud et al., 2015) down to 1 pc (Nguyn Lu’o’ng et al., 2013; Louvet et al., 2016). ALMA imaging of the W43-MM1 ridge, which is the most concentrated pc-scale cloud at less than 6 kpc, revealed a rich protocluster. It is currently being investigated to look for high-mass prestellar cores and to constrain the origin of the IMF in extreme clouds (Nony et al. in prep.; Motte et al. subm.).
Other well-known mini-starburst regions of the Milky Way galactic disk are W49 (e.g., Galván-Madrid et al., 2013), W51 (e.g., Ginsburg et al., 2015), and Sgr B2 (e.g., Schmiedeke et al., 2016). A catalog of mini-starburst complexes of the Milky Way has been built using CO and centimeter free-free surveys and aims to help go beyond these very few examples (Nguyn Lu’o’ng et al., 2016).
In contrast to these mini-starburst regions of the Galactic disk, the Central Molecular Zone contains high-density molecular clouds with low star formation activity (Longmore et al., 2013), even when investigating the current SFR through protostellar core counting in ALMA images (Henshaw et al., 2017). An analytical model proposed that the low star formation efficiency of this cloud is because of the strong shearing effects developing in the central Galactic regions (Kruijssen et al., 2014).
6 CONCLUSIONS AND PERSPECTIVES
The fifteen past years have seen an increasing interest in approaching the issue of the formation of high-mass stars and massive clusters, from both the theoretical and observational sides. Here we reviewed the progress that was made from observations, especially with submillimeter radiotelescopes, the Herschel far-IR observatory, and submillimeter interferometers.
Current knowledge of high-mass star formation is mainly based on statistical studies of distance-limited samples of molecular complexes (see Table 3). High-mass star formation scenarios currently undergo a change of paradigm, in which this process is no longer quasi-static but simultaneously evolves with both cloud and cluster formation. The lifetime of high-mass protostars and the lack of high-mass, 0.02 pc-scale, prestellar cores presented in Sect. 2 are consistent with the large dynamics of their hosted ridges, hubs, and MDCs on 1 pc to 0.1 pc scales (see Sect. 4). As a consequence, we propose an evolutionary scenario, inside which the high-mass analogs of prestellar cores are replaced by large-scale, pc, gas reservoirs, called starless MDCs or starless clumps. During their protostellar phase, these mass reservoirs would concentrate their mass into high-mass cores at the same time as they accrete stellar embryos, skipping the high-mass prestellar core phase. Figure 8 illustrates this evolutionary scheme.
Although star cluster properties, among them the IMF (see, e.g., Kroupa, 2001), seem universal, our review suggests that massive stellar clusters form in extreme clouds called ridges. Unlike the case of low-mass stars which accrete their final mass from well-defined pre-stellar cores, with a mass distribution mimicking the IMF (Motte, André & Neri, 1998; Könyves et al., 2015), (high-mass) stars within ridges should have a much more complex accretion history (see Sect. 3.4.2). One should therefore investigate the detailed properties of mini-starburst protoclusters to constrain the outcome characteristics of massive clusters.
Because Galactic-scale surveys are starting to provide well-constrained samples of high-mass star-forming sites and because we are entering the ALMA era, we are at the dawn of 1/ definitively stating the evolutionary scenario for both high-mass star and massive cluster formation and 2/ following their evolution throughout the Milky Way and beyond.
DISCLOSURE STATEMENT
The authors are not aware of any affiliations, memberships, funding, or financial holdings that might be perceived as affecting the objectivity of this review.
ACKNOWLEDGMENTS
We wish to thank Ewine van Dishoeck, Quang Nguyn Lu’o’ng, Pierre Didelon, and ARAA reviewers for helpful comments. We also thank all the authors who provided figures for this review: Henrik Beuther, Paolo Cortes, Timea Csengeri, Ana Duarte Cabral, Benjamin Gaczkowski, Martin Hennemann, Quang Nguyn Lu’o’ng, Nicolas Peretto, Nicola Schneider, Jérémy Tigé, Alessio Traficante, Marcella Veneziani, Ke Wang, Qizhou Zhang. During the writing of this review we were supported by CNRS, CNES, and Programme National de Physique Stellaire (PNPS) and program Physique et Chime du Milieu Interstellaire (PCMI) of CNRS/INSU, France. This project has received funding from the European Union?s Horizon 2020 research and innovation programme under grant agreement No 687528.
References
- Aguirre et al. (2011) Aguirre JE, Ginsburg AG, Dunham MK, Drosback MM, Bally J, et al. 2011. ApJS 192:4
- Alves, Lombardi & Lada (2007) Alves J, Lombardi M, Lada CJ. 2007. A&A 462:L17–L21
- André et al. (2010) André P, Men’shchikov A, Bontemps S, Könyves V, Motte F, et al. 2010. A&A 518:L102+
- André, Ward-Thompson & Barsony (2000) André P, Ward-Thompson D, Barsony M. 2000. Protostars and Planets IV :59–+
- Ballesteros-Paredes et al. (2011) Ballesteros-Paredes J, Hartmann LW, Vázquez-Semadeni E, Heitsch F, Zamora-Avilés MA. 2011. MNRAS 411:65–70
- Bally et al. (2010) Bally J, Aguirre J, Battersby C, Bradley ET, Cyganowski C, et al. 2010. ApJ 721:137–163
- Beltrán et al. (2006) Beltrán MT, Brand J, Cesaroni R, Fontani F, Pezzuto S, et al. 2006. A&A 447:221–233
- Beltrán et al. (2013) Beltrán MT, Olmi L, Cesaroni R, Schisano E, Elia D, et al. 2013. A&A 552:A123
- Benjamin et al. (2003) Benjamin RA, Churchwell E, Babler BL, Bania TM, Clemens DP, et al. 2003. PASP 115:953–964
- Bergin & Tafalla (2007) Bergin EA, Tafalla M. 2007. ARA&A 45:339–396
- Beuther et al. (2007a) Beuther H, Churchwell EB, McKee CF, Tan JC. 2007a. Protostars and Planets V :165–180
- Beuther et al. (2015) Beuther H, Henning T, Linz H, Feng S, Ragan SE, et al. 2015. A&A 581:A119
- Beuther et al. (2002a) Beuther H, Schilke P, Menten KM, Motte F, Sridharan TK, Wyrowski F. 2002a. ApJ 566:945–965
- Beuther et al. (2002b) Beuther H, Schilke P, Sridharan TK, Menten KM, Walmsley CM, Wyrowski F. 2002b. A&A 383:892–904
- Beuther & Steinacker (2007) Beuther H, Steinacker J. 2007. ApJ Lett. 656:L85–L88
- Beuther et al. (2007b) Beuther H, Zhang Q, Bergin EA, Sridharan TK, Hunter TR, Leurini S. 2007b. A&A 468:1045–1056
- Billot et al. (2010) Billot N, Noriega-Crespo A, Carey S, Guieu S, Shenoy S, et al. 2010. ApJ 712:797–812
- Bonnell & Bate (2002) Bonnell IA, Bate MR. 2002. MNRAS 336:659–669
- Bonnell, Bate & Zinnecker (1998) Bonnell IA, Bate MR, Zinnecker H. 1998. MNRAS 298:93–102
- Bonnell et al. (2001) Bonnell IA, Clarke CJ, Bate MR, Pringle JE. 2001. MNRAS 324:573–579
- Bonnor (1956) Bonnor WB. 1956. MNRAS 116:351
- Bontemps et al. (2010a) Bontemps S, André P, Könyves V, Men’shchikov A, Schneider N, et al. 2010a. A&A 518:L85+
- Bontemps et al. (1996) Bontemps S, André P, Terebey S, Cabrit S. 1996. A&A 311:858–872
- Bontemps et al. (2010b) Bontemps S, Motte F, Csengeri T, Schneider N. 2010b. A&A 524:A18
- Bressert et al. (2012) Bressert E, Ginsburg A, Bally J, Battersby C, Longmore S, Testi L. 2012. ApJ Lett. 758:L28
- Breen et al. (2010) Breen SL, Ellingsen SP, Caswell JL, Lewis BE. 2010. MNRAS 401:2219-44
- Bronfman, Nyman & May (1996) Bronfman L, Nyman LA, May J. 1996. A&AS 115:81
- Butler & Tan (2009) Butler MJ, Tan JC. 2009. ApJ 696:484–497
- Butler & Tan (2012) Butler MJ, Tan JC. 2012. ApJ 754:5
- Carey et al. (2000) Carey SJ, Feldman PA, Redman RO, Egan MP, MacLeod JM, Price SD. 2000. ApJ Lett. 543:L157–L161
- Carlhoff et al. (2013) Carlhoff P, Nguyn Lu’o’ng Q, Schilke P, Motte F, Schneider N, et al. 2013. A&A 560:A24
- Carpenter, Heyer & Snell (2000) Carpenter JM, Heyer MH, Snell RL. 2000. ApJS 130:381–402
- Chandrasekhar & Fermi (1953) Chandrasekhar S, Fermi E. 1953. ApJ 118:116
- Churchwell (2002) Churchwell E. 2002. ARA&A 40:27–62
- Commerçon, Hennebelle & Henning (2011) Commerçon B, Hennebelle P, Henning T. 2011. ApJ Lett. 742:L9
- Contreras et al. (2013) Contreras Y, Schuller F, Urquhart JS, Csengeri T, Wyrowski F, et al. 2013. A&A 549:A45
- Cortes et al. (2016) Cortes PC, Girart JM, Hull CLH, Sridharan TK, Louvet F, et al. 2016. ApJ Lett. 825:L15
- Crutcher (2012) Crutcher E. 2012. ARA&A 50:29–63
- Csengeri et al. (2011a) Csengeri T, Bontemps S, Schneider N, Motte F, Dib S. 2011a. A&A 527:A135
- Csengeri et al. (2011b) Csengeri T, Bontemps S, Schneider N, Motte F, Gueth F, Hora JL. 2011b. ApJ Lett. 740:L5
- Csengeri et al. (2014) Csengeri T, Urquhart JS, Schuller F, Motte F, Bontemps S, et al. 2014. A&A 565:A75
- Csengeri et al. (2017) Csengeri T, Bontemps S, Wyrowski F, Motte F, Menten KM, et al. 2017. A&A 600:L10.
- Cyganowski et al. (2011) Cyganowski CJ, Brogan CL, Hunter TR, Churchwell E, Zhang Q. 2011. ApJ 729:124
- Cyganowski et al. (2014) Cyganowski CJ, Brogan CL, Hunter TR, Graninger D, Öberg KI, et al. 2014. ApJ Lett. 796:L2
- Cyganowski et al. (2017) Cyganowski CJ, Brogan CL, Hunter TR, Smith R, Kruijssen JMD, et al. 2017. MNRAS 468:3694-08
- Didelon et al. (2015) Didelon P, Motte F, Tremblin P, Hill T, Hony S, et al. 2015. A&A 584:A4
- Duarte-Cabral et al. (2014) Duarte-Cabral A, Bontemps S, Motte F, Gusdorf A, Csengeri T, et al. 2014. A&A 570:A1
- Duarte-Cabral et al. (2013) Duarte-Cabral A, Bontemps S, Motte F, Hennemann M, Schneider N, André P. 2013. A&A 558:A125
- Dunham et al. (2015) Dunham MM, Allen LE, Evans II NJ, Broekhoven-Fiene H, Cieza LA, et al. 2015. ApJS 220:11
- Eden et al. (2012) Eden DJ, Moore TJT, Plume R, Morgan LK. 2012. MNRAS 422:3178–3188
- Egan et al. (1998) Egan MP, Shipman RF, Price SD, Carey SJ, Clark FO, Cohen M. 1998. ApJ Lett. 494:L199+
- Elia et al. (2017) Elia D, Molinari S, Schisano E, Pestalozzi M, Pezzuto D, et al. 2017. MNRAS :subm
- Evans et al. (2009) Evans II NJ, Dunham MM, Jørgensen JK, Enoch ML, Merín B, et al. 2009. ApJS 181:321–350
- Falgarone et al. (2008) Falgarone E, Troland TH, Crutcher RM, Paubert G. 2008. A&A 487:247-252
- Fallscheer et al. (2013) Fallscheer C, Reid MA, Di Francesco J, Martin PG, Hill T, et al. 2013. ApJ 773:102
- Faúndez et al. (2004) Faúndez S, Bronfman L, Garay G, Chini R, Nyman LÅ, May J. 2004. A&A 426:97–103
- Faure et al. (2015) Faure A, Faure M, Theulé P, Quirico E, Schmitt B. 2015. A&A 584:A98
- Federrath & Klessen (2012) Federrath C, Klessen RS. 2012. ApJ 761:156
- Federrath et al. (2010) Federrath C, Roman-Duval J, Klessen RS, Schmidt W, Mac Low MM. 2010. A&A 512:A81
- Fontani et al. (2011) Fontani F, Palau A, Caselli P, Sánchez-Monge Á, Butler MJ, et al. 2011. A&A 529:L7
- Fuller et al. (2005) Fuller GA, Williams SJ, Sridharan TK. 2005. A&A 442:A949
- Gaczkowski et al. (2013) Gaczkowski B, Preibisch T, Ratzka T, Roccatagliata V, Ohlendorf H, et al. 2013. A&A 549:A67
- Galván-Madrid et al. (2009) Galván-Madrid R, Keto E, Zhang Q, Kurtz S, Rodríguez LF, Ho PTP. 2009. ApJ 706:1036–1053
- Galván-Madrid et al. (2013) Galván-Madrid R, Liu HB, Zhang ZY, Pineda JE, Peng TC, et al. 2013. ApJ 779:121
- Galván-Madrid et al. (2010) Galván-Madrid R, Zhang Q, Keto E, Ho PTP, Zapata LA, et al. 2010. ApJ 725:17–28
- Garay et al. (2002) Garay G, Brooks KJ, Mardones D, Norris RP, Burton MG. 2002. ApJ 579:678–687
- Garay et al. (2004) Garay G, Faúndez S, Mardones D, Bronfman L, Chini R, Nyman LÅ. 2004. ApJ 610:313–319
- Garay & Lizano (1999) Garay G, Lizano S. 1999. PASP 111:1049–1087
- Ginsburg et al. (2015) Ginsburg A, Bally J, Battersby C, Youngblood A, Darling J, et al. 2015. A&A 573:A106
- Ginsburg et al. (2012) Ginsburg A, Bressert E, Bally J, Battersby C. 2012. ApJ Lett. 758:L29
- Ginsburg et al. (2013) Ginsburg A, Glenn J, Rosolowsky E, Ellsworth-Bowers TP, Battersby C, et al. 2013. ApJS 208:14
- Girart et al. (2013) Girart JM, Frau P, Zhang Q, Koch PM, Qiu K, et al. 2013. ApJ 772:69
- Girart, Rao, & Marrone (2006) Girart JM, Rao R, Marrone DP. 2006. Science 313:812–814
- Gómez & Vázquez-Semadeni (2014) Gómez G, Vázquez-Semadeni E. 2014. ApJ 791:124
- Green et al. (2012) Green JA, McClure-Griffiths NM, Caswell JL, Robishaw T, Harvey-Smith L. 2012. MNRAS 425, 2530-47
- Hacar et al. (2013) Hacar A, Tafalla M, Kauffmann J, Kovács A. 2013. A&A 554:A55
- Hartmann, Ballesteros-Paredes & Heitsch (2012) Hartmann L, Ballesteros-Paredes J, Heitsch F. 2012. MNRAS 420:1457–1461
- Hartmann & Burkert (2007) Hartmann L, Burkert A. 2007. ApJ 654:988–997
- Heiderman et al. (2010) Heiderman A, Evans II NJ, Allen LE, Huard T, Heyer M. 2010. ApJ 723:1019–1037
- Heithausen et al. (1998) Heithausen A, Bensch F, Stutzki J, Falgarone E, Panis JF. 1998. A&A 331:L65–L68
- Heitsch & Hartmann (2008) Heitsch F, Hartmann L. 2008. ApJ 689:290–301
- Helmich & van Dishoeck (1997) Helmich FP, van Dishoeck EF. 1997. A&AS 124:205–253
- Hennebelle & Chabrier (2011) Hennebelle P, Chabrier G. 2011. ApJ Lett. 743:L29
- Hennemann et al. (2010) Hennemann M, Motte F, Bontemps S, Schneider N, Csengeri T, et al. 2010. A&A 518:L84+
- Hennemann et al. (2012) Hennemann M, Motte F, Schneider N, Didelon P, Hill T, et al. 2012. A&A 543:L3
- Henshaw et al. (2014) Henshaw JD, Caselli P, Fontani F, Jiménez-Serra I, Tan JC. 2014. MNRAS 440:2860–2881
- Henshaw et al. (2013) Henshaw JD, Caselli P, Fontani F, Jiménez-Serra I, Tan JC, Hernandez AK. 2013. MNRAS 428:3425–3442
- Henshaw et al. (2017) Henshaw JD, Jiménez-Serra I, Longmore SN, Caselli P, Pineda JE, et al. 2017. MNRAS 464:L31–L35
- Herpin et al. (2012) Herpin F, Chavarría L, van der Tak F, Wyrowski F, van Dishoeck EF, et al. 2012. A&A 542:A76
- Herpin et al. (2016) Herpin F, Chavarría L, Jacq T, Braine J, van der Tak F, et al. 2016. A&A 587:A139
- Heyer, Williams & Brunt (2006) Heyer MH, Williams JP, Brunt CM. 2006. ApJ 643:956–964
- Hill et al. (2005) Hill T, Burton MG, Minier V, Thompson MA, Walsh AJ, et al. 2005. MNRAS 363:405–451
- Hill et al. (2011) Hill T, Motte F, Didelon P, Bontemps S, Minier V, et al. 2011. A&A 533:A94
- Hill et al. (2012) Hill T, Motte F, Didelon P, White GJ, Marston AP, et al. 2012. A&A 542:A114
- Hoare et al. (2007) Hoare MG, Kurtz SE, Lizano S, Keto E, Hofner P. 2007. Protostars and Planets V :181–196
- Hosokawa & Omukai (2009) Hosokawa T, Omukai K. 2009. ApJ 691:823–846
- Hunter et al. (1998) Hunter TR, Neugebauer G, Benford DJ, Matthews K, Lis DC, et al. 1998. ApJ Lett. 493:L97–L100
- Jiménez-Serra et al. (2010) Jiménez-Serra I, Caselli P, Tan JC, Hernandez AK, Fontani F, et al. 2010. MNRAS 406:187–196
- Johnstone et al. (2000) Johnstone D, Wilson CD, Moriarty-Schieven G, Joncas G, Smith G, et al. 2000. ApJ 545:327–339
- Kauffmann et al. (2008) Kauffmann J, Bertoldi F, Bourke TL, Evans II NJ, Lee CW. 2008. A&A 487:993–1017
- Kauffmann & Pillai (2010) Kauffmann J, Pillai T. 2010. ApJ Lett. 723:L7–L12
- Kauffmann, Pillai & Goldsmith (2013) Kauffmann J, Pillai T, Goldsmith PF. 2013. ApJ 779:185
- Kennicutt (1998) Kennicutt RC. 1998. ApJ 498:541
- Kenyon & Hartmann (1995) Kenyon SJ, Hartmann L. 1995. ApJS 101:117
- Keto (2003) Keto E. 2003. ApJ 599:1196–1206
- Kirk et al. (2013) Kirk H, Myers PC, Bourke TL, Gutermuth RA, Hedden A, Wilson GW. 2013. ApJ 766:115
- Kirk, Ward-Thompson & André (2005) Kirk JM, Ward-Thompson D, André P. 2005. MNRAS 360:1506–1526
- Klein et al. (2005) Klein R, Posselt B, Schreyer K, Forbrich J, Henning T. 2005. ApJS 161:361–393
- Kong et al. (2017) Kong S, Tan JC, Caselli P, Fontani F, Liu M, et al. 2017. ApJ 834:193
- Könyves et al. (2015) Könyves V, André P, Men’shchikov A, Palmeirim P, Arzoumanian D, et al. 2015. A&A 584:A91
- Kurtz, Cesaroni, Churchwell, Hofner & Walmsley (2000) Kurtz S, Cesaroni R, Churchwell E, Hofner P, Walmsley CM. 2000. Protostars and Planets IV :299–326
- Kramer, Stutzki & Winnewisser (1996) Kramer C, Stutzki J, Winnewisser G. 1996. A&A 307:915–935
- Kroupa (2001) Kroupa P. 2001. MNRAS 322:231–246
- Kruijssen et al. (2014) Kruijssen JMD, Longmore SN, Elmegreen BG, Murray N, Bally J, et al. 2014. MNRAS 440:3370–3391
- Krumholz (2015) Krumholz MR. 2015. The Formation of Very Massive Stars. In Very Massive Stars in the Local Universe, ed. JS Vink, vol. 412 of Astrophysics and Space Science Library
- Krumholz et al. (2009) Krumholz MR, Klein RI, McKee CF, Offner SSR, Cunningham AJ. 2009. Science 323:754
- Kuiper et al. (2011) Kuiper R, Klahr H, Beuther H, Henning T. 2011. ApJ 732:20
- Kuiper et al. (2010) Kuiper R, Klahr H, Dullemond C, Kley W, Henning T. 2010. A&A 511:A81
- Kurtz et al. (2000) Kurtz S, Cesaroni R, Churchwell E, Hofner P, Walmsley CM. 2000. Protostars and Planets IV :299–326
- Lada et al. (1978) Lada CJ, Elmegreen BG, Cong HI, Thaddeus P. 1978. ApJ Lett. 226:L39–L42
- Larson (1981) Larson RB. 1981. MNRAS 194:809
- Leurini et al. (2007) Leurini S, Beuther H, Schilke P, Wyrowski F, Zhang Q, Menten KM. 2007. A&A 475:925–939
- Li et al. (2014) Li HB, Goodman A, Sridharan TK, Houde M, Li ZY, et al. 2014. Protostars and Planets VI :101–123
- Li et al. (2015) Li HB, Yuen KH, Otto F, Leung PK, Sridharan TK, et al. 2015. Nature 520:518–521
- Longmore et al. (2013) Longmore SN, Bally J, Testi L, Purcell CR, Walsh AJ, et al. 2013. MNRAS 429:987–1000
- Longmore et al. (2014) Longmore SN, Kruijssen JMD, Bastian N, Bally J, Rathborne J, et al. 2014. Protostars and Planets VI :291–314
- López-Sepulcre et al. (2011) López-Sepulcre A, Walmsley CM, Cesaroni P, Codella C, Schuller F, et al. 2011. A&A 526:L2
- Loren (1977) Loren RB. 1977. ApJ 215:129–150
- Louvet et al. (2016) Louvet F, Motte F, Gusdorf FMA, Nguyn Lu’o’ng Q, Lesaffre P, et al. 2016. A&A 595:A122
- Louvet et al. (2014) Louvet F, Motte F, Hennebelle P, Maury A, Bonnell I, et al. 2014. A&A 570:A15
- Lumsden et al. (2013) Lumsden SL, Hoare MG, Urquhart JS, Oudmaijer RD, Davies B, et al. 2013. ApJS 208:11
- Martins et al. (2008) Martins F, Hillier DJ, Paumard T, Eisenhauer F, Ott T, Genzel R. 2008. A&A 478:219–233
- Maury et al. (2011) Maury AJ, André P, Men’shchikov A, Könyves V, Bontemps S. 2011. A&A 535:A77
- McKee & Tan (2002) McKee CF, Tan JC. 2002. Nature 416:59–61
- McKee & Tan (2003) McKee CF, Tan JC. 2003. ApJ 585:850–871
- Minier et al. (2005) Minier V, Burton MG, Hill T, Pestalozzi MR, Purcell CR, et al. 2005. A&A 429:945–960
- Molinari et al. (2000) Molinari S, Brand J, Cesaroni R, Palla F. 2000. A&A 355:617–628
- Molinari et al. (2008) Molinari S, Pezzuto S, Cesaroni R, Brand J, Faustini F, Testi L. 2008. A&A 481:345–365
- Molinari et al. (2016) Molinari S, Schisano E, Elia D, Pestalozzi M, Traficante A, et al. 2016. A&A 591:A149
- Molinari et al. (2010) Molinari S, Swinyard B, Bally J, Barlow M, Bernard J, et al. 2010. A&A 518:L100+
- Molinari et al. (1998) Molinari S, Testi L, Brand J, Cesaroni R, Palla F. 1998. ApJ Lett. 505:L39–L42
- Motte & André (2001) Motte F, André P. 2001. A&A 365:440–464
- Motte, André & Neri (1998) Motte F, André P, Neri R. 1998. A&A 336:150–172
- Motte et al. (2001) Motte F, André P, Ward-Thompson D, Bontemps S. 2001. A&A 372:L41–L44
- Motte et al. (2005) Motte F, Bontemps S, Schilke P, Lis DC, Schneider N, Menten KM. 2005. In vol. 227 of IAU Symposium
- Motte et al. (2007) Motte F, Bontemps S, Schilke P, Schneider N, Menten KM, Broguière D. 2007. A&A 476:1243–1260
- Motte et al. (2014) Motte F, Nguyn Lu’o’ng Q, Schneider N, Heitsch F, Glover S, et al. 2014. A&A 571:A32
- Motte, Schilke & Lis (2003) Motte F, Schilke P, Lis DC. 2003. ApJ 582:277–291
- Motte et al. (2010) Motte F, Zavagno A, Bontemps S, Schneider N, Hennemann M, et al. 2010. A&A 518:L77+
- Mottram et al. (2011) Mottram JC, Hoare MG, Urquhart JS, Lumsden SL, Oudmaijer RD, et al. 2011. A&A 525:A149+
- Mueller et al. (2002) Mueller KE, Shirley YL, Evans II NJ, Jacobson HR. 2002. ApJS 143:469–497
- Murray & Chang (2012) Murray N, Chang P. 2009. ApJ 746:75
- Murray & Chang (2015) Murray N, Chang P. 2015. ApJ 804:44
- Myers et al. (2013) Myers AT, McKee CF, Cunningham AJ, Klein RI, Krumholz MR. 2002. ApJ 766:97
- Myers (2009) Myers PC. 2009. ApJ 700:1609–1625
- Nakamura et al. (2014) Nakamura F, Sugitani K, Tanaka T, Nishitani H, Dobashi K, et al. 2014. ApJ Lett. 791:L23
- Nguyn Lu’o’ng et al. (2016) Nguyn Lu’o’ng Q, Nguyen HVV, Motte F, Schneider N, Fujii M, et al. 2016. ApJ 833:23
- Nguyn Lu’o’ng et al. (2013) Nguyn Lu’o’ng Q, Motte F, Carlhoff P, Louvet F, Lesaffre P, et al. 2013. ApJ 775:88
- Nguyn Lu’o’ng et al. (2011a) Nguyn Lu’o’ng Q, Motte F, Hennemann M, Hill T, Rygl KLJ, et al. 2011a. A&A 535:A76
- Nguyn Lu’o’ng et al. (2011b) Nguyn Lu’o’ng Q, Motte F, Schuller F, Schneider N, Bontemps S, et al. 2011b. A&A 529:A41
- Onishi et al. (2002) Onishi T, Mizuno A, Kawamura A, Tachihara K, Fukui Y. 2002. ApJ 575:950–973
- Palau et al. (2015) Palau A, Ballesteros-Paredes J, Vázquez-Semadeni E, Sánchez-Monge Á, Estalella R, et al. 2015. MNRAS 453:3785–3797
- Palau et al. (2013) Palau A, Fuente A, Girart JM, Estalella R, Ho PTP, et al. 2013. ApJ 762:120
- Palmeirim et al. (2013) Palmeirim P, André P, Kirk J, Ward-Thompson D, Arzoumanian D, et al. 2013. A&A 550:A38
- Pérault et al. (1996) Pérault M, Omont A, Simon G, Seguin P, Ojha D, et al. 1996. A&A 315:L165–L168
- Peretto, André & Belloche (2006) Peretto N, André P, Belloche A. 2006. A&A 445:979–998
- Peretto & Fuller (2009) Peretto N, Fuller GA. 2009. A&A 505:405–415
- Peretto & Fuller (2010) Peretto N, Fuller GA. 2010. ApJ 723:555–562
- Peretto et al. (2014) Peretto N, Fuller GA, André P, Arzoumanian D, Rivilla VM, et al. 2014. A&A 561:A83
- Peretto et al. (2013) Peretto N, Fuller GA, Duarte-Cabral A, Avison A, Hennebelle P, et al. 2013. A&A 555:A112
- Pestalozzi, Minier & Booth (2005) Pestalozzi MR, Minier V, Booth RS. 2005. A&A 432:737–742
- Pillai et al. (2016) Pillai T, Kauffmann J, Wiesemeyer H, Menten KM. 2016. A&A 591:A19
- Pillai et al. (2006) Pillai T, Wyrowski F, Carey SJ, Menten KM. 2006. A&A 450:569–583
- Plume et al. (1997) Plume R, Jaffe DT, Evans II NJ, Martín-Pintado J, Gómez-González J. 1997. ApJ 476:730–749
- Preibisch et al. (2012) Preibisch T, Roccatagliata V, Gaczkowski B, Ratzka T. 2012. A&A 541:132–145
- Qiu et al. (2011) Qiu K, Wyrowski F, Menten KM, Güsten R, Leurini S, Leinz C. 2011. ApJ Lett. 743:L25
- Ragan et al. (2012a) Ragan S, Henning T, Krause O, Pitann J, Beuther H, et al. 2012a. A&A 547:A49
- Ragan et al. (2006) Ragan SE, Bergin EA, Plume R, Gibson DL, Wilner DJ, et al. 2006. ApJS 166:567–584
- Ragan et al. (2012b) Ragan SE, Heitsch F, Bergin EA, Wilner D. 2012b. ApJ 746:174
- Rathborne et al. (2011) Rathborne JM, Garay G, Jackson JM, Longmore S, Zhang Q, Simon R. 2011. ApJ 741:120
- Rathborne et al. (2010) Rathborne JM, Jackson JM, Chambers ET, Stojimirovic I, Simon R, et al. 2010. ApJ 715:310–322
- Rathborne, Jackson & Simon (2006) Rathborne JM, Jackson JM, Simon R. 2006. ApJ 641:389–405
- Rathborne et al. (2009) Rathborne JM, Johnson AM, Jackson JM, Shah RY, Simon R. 2009. ApJS 182:131–142
- Renaud et al. (2015) Renaud F, Bournaud F, Emsellem E, Agertz O, Athanassoula E, et al. 2015. MNRAS 454:3299–3310
- Rivera-Ingraham et al. (2013) Rivera-Ingraham A, Martin PG, Polychroni D, Motte F, Schneider N, et al. 2013. ApJ 766:85
- Robitaille et al. (2007) Robitaille TP, Whitney BA, Indebetouw R, Wood K. 2007. ApJS 169:328–352
- Rudolph et al. (1990) Rudolph A, Welch WJ, Palmer P, Dubrulle B. 1990. ApJ 363:528–546
- Russeil et al. (2013) Russeil D, Schneider N, Anderson LD, Zavagno A, Molinari S, et al. 2013. A&A 554:A42
- Russeil et al. (2010) Russeil D, Zavagno A, Motte F, Schneider N, Bontemps S, Walsh AJ. 2010. A&A 515:A55+
- Rygl et al. (2012) Rygl KLJ, Brunthaler A, Sanna A, Menten KM, Reid MJ, et al. 2012. A&A 539:A79
- Sadavoy et al. (2014) Sadavoy SI, Di Francesco J, André P, Pezzuto S, Bernard JP, et al. 2014. ApJ Lett. 787:L18
- Sakai et al. (2008) Sakai T, Sakai N, Kamegai K, Hirota T, Yamaguchi N, et al. 2008. ApJ 678:1049–1069
- Sandell (2000) Sandell G. 2000. A&A 358:242–256
- Sandell & Sievers (2004) Sandell G, Sievers A. 2004. ApJ 600:269–278
- Sanhueza et al. (2013) Sanhueza P, Jackson JM, Foster JB, Jimenez-Serra I, Dirienzo WJ, Pillai T. 2013. ApJ 773:123
- Schmiedeke et al. (2016) Schmiedeke A, Schilke P, Möller T, Sánchez-Monge Á, Bergin E, et al. 2016. A&A 588:A143
- Schneider et al. (2015a) Schneider N, Bontemps S, Girichidis P, Rayner T, Motte F, et al. 2015a. MNRAS 453:41–45
- Schneider et al. (2016) Schneider N, Bontemps S, Motte F, Blazere A, André P, et al. 2016. A&A 591:A40
- Schneider et al. (2006) Schneider N, Bontemps S, Simon R, Jakob H, Motte F, et al. 2006. A&A 458:855–871
- Schneider et al. (2011) Schneider N, Bontemps S, Simon R, Ossenkopf V, Federrath C, et al. 2011. A&A 529:A1
- Schneider et al. (2010) Schneider N, Csengeri T, Bontemps S, Motte F, Simon R, et al. 2010. A&A 520:A49+
- Schneider et al. (2015b) Schneider N, Csengeri T, Klessen RS, Tremblin P, Ossenkopf V, et al. 2015b. A&A 578:A29
- Schuller et al. (2009) Schuller F, Menten KM, Contreras Y, Wyrowski F, Schilke P, et al. 2009. A&A 504:415–427
- Shu, Adams & Lizano (1987) Shu FH, Adams FC, Lizano S. 1987. ARA&A 25:23–81
- Simon et al. (2006a) Simon R, Jackson JM, Rathborne JM, Chambers ET. 2006a. ApJ 639:227–236
- Simon et al. (2006b) Simon R, Rathborne JM, Shah RY, Jackson JM, Chambers ET. 2006b. ApJ 653:1325–1335
- Smith, Longmore & Bonnell (2009) Smith RJ, Longmore S, Bonnell I. 2009. MNRAS 400:1775–1784
- Smith et al. (2013) Smith RJ, Shetty R, Beuther H, Klessen RS, Bonnell IA. 2013. ApJ 771:24
- Spitzer (1978) Spitzer L. 1978. Physical processes in the interstellar medium
- Sridharan et al. (2005) Sridharan TK, Beuther H, Saito M, Wyrowski F, Schilke P. 2005. ApJ Lett. 634:L57–L60
- Sridharan et al. (2002) Sridharan TK, Beuther H, Schilke P, Menten KM, Wyrowski F. 2002. ApJ 566:931–944
- Svoboda et al. (2016) Svoboda BE, Shirley YL, Battersby C, Rosolowsky EW, Ginsburg AG, et al. 2016. ApJ 822:59
- Tackenberg et al. (2014) Tackenberg J, Beuther H, Henning T, Linz H, Sakai T, et al. 2014. A&A 565:A101
- Tackenberg et al. (2012) Tackenberg J, Beuther H, Henning T, Schuller F, Wienen M, et al. 2012. A&A 540:A113
- Tan et al. (2014) Tan JC, Beltrán MT, Caselli P, Fontani F, Fuente A, et al. 2014. Protostars and Planets VI :149–172
- Tan et al. (2013) Tan JC, Kong S, Butler MJ, Caselli P, Fontani F. 2013. ApJ 779:96
- Tan et al. (2016) Tan JC, Kong S, Zhang Y, Fontani F, Caselli P, Butler MJ. 2016. ApJ Lett. 821:L3
- Tatematsu et al. (1998) Tatematsu K, Umemoto T, Heyer MH, Hirano N, Kameya O, Jaffe DT. 1998. ApJS 118:517–539
- Teyssier, Hennebelle & Pérault (2002) Teyssier D, Hennebelle P, Pérault M. 2002. A&A 382:624–638
- Thompson et al. (2006) Thompson MA, Hatchell J, Walsh AJ, MacDonald GH, Millar TJ. 2006. A&A 453:1003–1026
- Tigé et al. (2017) Tigé J, Motte F, Russeil D, Zavagno A, Hennemann M, et al. 2017. A&A :in press (ArXiv e-prints 1703.09839)
- Traficante et al. (2015) Traficante A, Fuller GA, Peretto N, Pineda JE, Molinari S. 2015. MNRAS 451:3089–3106
- Tremblin et al. (2012) Tremblin P, Audit E, Minier V, Schmidt W, Schneider N. 2012. A&A 546:A33
- Ungerechts, Umbanhowar & Thaddeus (2000) Ungerechts H, Umbanhowar P, Thaddeus P. 2000. ApJ 537:221–235
- Urquhart et al. (2014) Urquhart JS, Moore TJT, Csengeri T, Wyrowski F, Schuller F, et al. 2014. MNRAS 443:1555–1586
- Vallée & Fiege (2006) Vallée JP, Fiege JD. 2006. ApJ 636:332–347
- van der Tak et al. (2000) van der Tak FFS, van Dishoeck EF, Evans II NJ, Blake GA. 2000. ApJ 537:283–303
- Vázquez-Semadeni et al. (2007) Vázquez-Semadeni E, Gómez GC, Jappsen AK, Ballesteros-Paredes J, González RF, Klessen RS. 2007. ApJ 657:870–883
- Vázquez-Semadeni et al. (2009) Vázquez-Semadeni E, Gómez GC, Jappsen AK, Ballesteros-Paredes J, Klessen RS. 2009. ApJ 707:1023–1033
- Vázquez-Semadeni et al. (2008) Vázquez-Semadeni E, González RF, Ballesteros-Paredes J, Gazol A, Kim J. 2008. MNRAS 390:769–780
- Vázquez-Semadeni et al. (2017) Vázquez-Semadeni E, González-Samaniego A, Colín P. 2017. MNRAS 467:1313-28
- Veneziani et al. (2017) Veneziani M, Schisano E, Elia D, Noriega-Crespo A, Carey S, et al. 2017. A&A 599:A7
- Vutisalchavakul, Evans & Heyer (2016) Vutisalchavakul N, Evans II NJ, Heyer M. 2016. ApJ 831:73
- Walsh et al. (2016) Walsh AJ, Beuther H, Bihr S, Johnson KG, Dawson JR, et al. 2016. MNRAS 455:3494–3510
- Walsh et al. (1998) Walsh AJ, Burton MG, Hyland AR, Robinson G. 1998. MNRAS 301:640-98
- Wang et al. (2014) Wang K, Zhang Q, Testi L, van der Tak F, Wu Y, et al. 2014. MNRAS 439:3275–3293
- Wang et al. (2011) Wang K, Zhang Q, Wu Y, Zhang H. 2011. ApJ 735:64
- Wang et al. (2013) Wang KS, Bourke TL, Hogerheijde MR, van der Tak FFS, Benz AO, et al. 2013. A&A 558:A69
- Ward-Thompson, Motte & André (1999) Ward-Thompson D, Motte F, André P. 1999. MNRAS 305:143–150
- Ward-Thompson et al. (1994) Ward-Thompson D, Scott PF, Hills RE, André P. 1994. MNRAS 268:276
- Wienen et al. (2015) Wienen M, Wyrowski F, Menten KM, Urquhart JS, Csengeri T, et al. 2015. A&A 579:A91
- Wienen et al. (2012) Wienen M, Wyrowski F, Schuller F, Menten KM, Walmsley CM, et al. 2012. A&A 544:A146
- Williams, Blitz & McKee (2000) Williams JP, Blitz L, McKee CF. 2000. Protostars and Planets IV :97
- Williams, Blitz & Stark (1995) Williams JP, Blitz L, Stark AA. 1995. ApJ 451:252
- Wolfire & Cassinelli (1987) Wolfire MG, Cassinelli JP. 1987. ApJ 319:850–867
- Wood & Churchwell (1989) Wood DOS, Churchwell E. 1989. ApJ 340:265–272
- Wu & Evans (2003) Wu J, Evans II NJ. 2003. ApJ Lett. 592:L79–L82
- Wyrowski et al. (2016) Wyrowski F, Güsten R, Menten KM, Wiesemeyer H, Csengeri T, et al. 2016. A&A 585:A149
- Yorke & Sonnhalter (2002) Yorke HW, Sonnhalter C. 2002. ApJ 569:846–862
- Zavagno et al. (2010) Zavagno A, Russeil D, Motte F, Anderson LD, Deharveng L, et al. 2010. A&A 518:L81+
- Zhang et al. (2014) Zhang Q, Qiu K, Girart JM, Baobab Liu H, Tang YW, et al. 2014. ApJ 792:116
- Zhang et al. (2009) Zhang Q, Wang Y, Pillai T, Rathborne J. 2009. ApJ 696:268–273
- Zinnecker & Yorke (2007) Zinnecker H, Yorke HW. 2007. ARA&A 45:481–563
References
- Polychroni et al. (2013) Polychroni D, Schisano E, Elia D, Roy A, Molinari S, et al.. 2013. ApJ Lett. 777:L33
- Rygl et al. (2014) Rygl KLJ, Goedhart S, Polychroni D, Wyrowski F, Motte F, et al. 2014. MNRAS 440:427-47