On the statistics of proto-cluster candidates detected in the Planck all-sky survey
Abstract
Observational investigations of the abundance of massive precursors of local galaxy clusters (“proto-clusters”) allow us to test the growth of density perturbations, to constrain cosmological parameters that control it, to test the theory of non-linear collapse and how the galaxy formation takes place in dense environments. The Planck collaboration has recently published a catalogue of 2000 cold extra-galactic sub-millimeter sources, i.e. with colours indicative of , almost all of which appear to be over-densities of star-forming galaxies. They are thus considered as proto-cluster candidates. Their number densities (or their flux densities) are far in excess of expectations from the standard scenario for the evolution of large-scale structure. Simulations based on a physically motivated galaxy evolution model show that essentially all cold peaks brighter than mJy found in Planck maps after having removed the Galactic dust emission can be interpreted as positive Poisson fluctuations of the number of high- dusty proto-clusters within the same Planck beam, rather then being individual clumps of physically bound galaxies. This conclusion does not change if an empirical fit to the luminosity function of dusty galaxies is used instead of the physical model. The simulations accurately reproduce the statistic of the Planck detections and yield distributions of sizes and ellipticities in qualitative agreement with observations. The redshift distribution of the brightest proto-clusters contributing to the cold peaks has a broad maximum at . Therefore follow-up of Planck proto-cluster candidates will provide key information on the high- evolution of large scale structure.
keywords:
galaxies: clusters: general – galaxies: evolution – large-scale structure of Universe – submillimetre: galaxies1 Introduction
Observations of the early evolution of large scale structure are important tools for testing galaxy formation theories, investigating galaxy evolution in dense environments and getting independent constraints on fundamental cosmological parameters (e.g., , 2012, 2016). This has motivated several observational efforts to identify high-redshift proto-clusters of galaxies (for a review see Overzier, 2016) defined as high- galaxy over-densities that will evolve into the local galaxy clusters.
The detection of these objects, however, proved to be challenging. Above the searches via the X-ray emission or the Sunyaev-Zeldovich (SZ) effect as well as the optical detection of the galaxy red sequence are inefficient, not only because of the difficulty of high- observations but even more because these methods are appropriate to detect evolved clusters with mature galaxy populations or the signature of a hot inter-cluster medium (ICM). But in high- proto-clusters the ICM may not have yet reached the high temperatures necessary for X-ray or SZ detections, and member galaxies may be still in the active star-formation phase.
Indeed, (sub-)millimeter surveys with Herschel, SCUBA-2 or APEX LABOCA proved to be capable of detecting candidate high- proto-clusters of star-bursting galaxies (, 2013, 2014, 2014; Ma et al., 2015; , 2015, 2016). These objects are however rare and therefore very large area surveys are necessary to get a good statistics. As first pointed out by Negrello et al. (2005) low-resolution sub-mm surveys, such as those carried out by the Planck satellite, are very well suited for detecting proto-clusters because they integrate over the emission of all star-forming member galaxies, not only of those above some detection limit.
The (2016, PCXXXIX hereafter) provided a catalog of 2151 cold sub-mm sources with spectral energy distributions peaking between 353 and 857 GHz at resolution, detected by Planck in the cleanest 26% of the sky, with flux density at 545 GHz above 500 mJy. This is referred to as the Planck high-, or PH, sample. The vast majority of the sources in the sample appear as overdensities of dusty star-forming galaxies, having colours consistent with and were considered as proto-cluster candidates.
Planck Collaboration XXVII (2015) used the Spectral and Photometric Imaging Receiver (SPIRE) on the Herschel satellite to perform follow-up observations of 234 cold Planck sources, satisfying the criterion of having their rest-frame far-IR peak redshifted to the frequency range GHz, as expected for galaxies in the redshift range –4. Usable results were obtained for 228 of them, including 83 of the 203 sources within the area covered by the PH sample. About 94% of the SPIRE sources associated to the 228 Planck objects were found to be consistent with being galaxy overdensities; their (photometric) redshift distribution peaks at for a typical dust temperature of 35 K. Seven sources (about 3%) are candidate lensed systems; all of them have spectroscopic redshifts and are at (, 2015).
As pointed out by PCXXXIX the nature of the high- galaxy overdensities is still uncertain. Given the large uncertainties in the photometric redshift estimates, it is impossible, at present, to establish whether galaxies making up the overdensities are physically related or are just part of random fluctuations in the galaxy number density within the Planck resolution element.
PCXXXIX found that the distribution of the total (8–m) infrared (IR) luminosities of overdensities peaks around for their reference dust temperature of 35 K. Using the calibration by (2012), the corresponding star formation rate (SFR) is . The associated halo mass, , can be estimated using the SFR– relation at derived by (2015) exploiting the abundance matching technique. For mean SFRs in the range 30–1000 (the typical SFR of star-forming galaxies is , see Fig. 9 of Cai et al., 2014) the sum of halo masses of star-forming galaxies is , independently of the SFR. If the lifetime of the star-forming phase is , the total halo mass is , where Gyr is the age of the universe at . Since is likely Gyr, is probably several times larger than . The redshift-dependent halo mass function by (1999) gives a surface density of halos with mass larger than at of deg-2 (and much lower than that for , since the density sinks down exponentially in this mass range) to be compared with the surface density of Planck overdensities of . This already highlights a problem with the interpretation of overdensities as proto-clusters.
To look for a plausible explanation of the results by PCXXXIX we have updated the study by Negrello et al. (2005) who worked out a formalism to derive the IR luminosity functions and number counts of proto-clusters of dusty galaxies. In the last decade the amount of data on the cosmological evolution of the IR luminosity function and on the clustering properties of dusty galaxies has grown enormously, allowing us to put our estimates on a much more solid basis than was possible in 2005. We will adopt as our reference the latest (2013) version of the self-regulated galaxy evolution model developed by (2004) and (2006, 2011). However we checked that our results and conclusions do not significantly change if we adopt an empirical fit the luminosity function of dusty galaxies (e.g. Mancuso et al., 2016).
The paper is organized as follow. In Section 2 we review and update the formalism introduced by Negrello et al. (2005), while in Section 3 we briefly describe the model adopted for the luminosity function and the clustering properties of dusty galaxies. Predictions for the number counts of proto-clusters and comparison with data are presented in Section 4. In Section 5 we investigate the effect on the estimated number counts of Poisson fluctuations of the number of proto-clusters within the Planck beam. Section 6 summarizes and discusses our main conclusions.
Throughout the paper we assume a flat cold dark matter cosmology with , , and , with an index for the power spectrum of primordial density fluctuations, consistent with the Planck results (Planck Collaboration XIII, 2016).
2 Formalism
The mean luminosity of a clump of clustered galaxies, or of a proto-cluster, at redshift is111At variance with Negrello et al. (2005) we have now dropped from the equations all the Poisson terms, as we are specifically interested in physically related galaxies. (Peebles, 1980)
| (1) |
where is the comoving luminosity function of galaxies and is their spatial correlation function; is the volume of the proto-cluster (the choice of the proto-cluster radius will be discussed in Section 3), while is the comoving radial distance to the volume element . The variance of the clump luminosity is
| (2) | |||||
where is the comoving distance between the volume elements and , and is the reduced part of the three-point spatial correlation function for which we assume the standard hierarchical formula:
| (3) |
The variance of clump luminosities [eq. (2)] is the sum of the contributions from fluctuations in the total
luminosity and in the number of member sources. ).
Using Eq. (3) we rewrite Eq. (2) as
| (4) | |||||
The statistics of the matter-density distribution found in N-body simulations is succesfully reproduced by a log-normal function (, 1991, 1994, 2000, 2001, 2003), not only in weakly non-linear regimes, but also up to density contrasts . If light is a (biased) tracer of mass, fluctuations in the luminosity density should reflect the statistics of the matter-density field. Therefore we adopt, following N05, a log-normal shape for the distribution of . This function is completely determined by its first (mean) and second (variance) moments:
| (5) |
where
| (6) | |||||
| (7) |
The function is normalized by requiring the conservation of the luminosity density
| (8) |
3 Adopted model for dusty galaxies
We compute the clump total-infrared (m) luminosity
function using the redshift–dependent IR luminosity function of dusty
galaxies provided by the (2013, C13 hereafter) model which accurately
reproduces the observational determinations, available up to (see Fig. 1 of , 2014), as well as a broad variety of
other relevant data222A tabulation of the IR luminosity
function at several redshifts as well as figures showing fits to
other relevant data sets are available at
http://people.sissa.it/~zcai/galaxy_agn/ or
http://staff.ustc.edu.cn/~zcai/galaxy_agn/index.html..
In order to assess the robustness of our results
we also work out predictions based on a parametric fit to the
infrared luminosity function of dusty galaxies. Specifically we
use the results by Mancuso et al. (2016) who preformed a fit to the global, redshift-dependent,
SFR function of galaxies measured at UV and far-IR
wavelengths by the Hubble and the Herschel space
telescopes. As we are interested in the dust-obscured phase of the
formation of galaxy clusters at , we just need the part of
the global SFR function above Myr-1 [corresponding to
luminosities L⊙
(, 2012)], where, generally, the star formation is heavily obscured by dust. In practise we identify the value of the SFR at which the global SFR function is a factor of 10
higher than the SFR function derived by Mancuso et al. from UV
(dust-corrected) data alone and apply an exponential cut-off below
that value. The cut-off correponds to M⊙ yr-1 to M⊙ yr-1 from to
, or to infrared luminosities L⊙ to
L⊙, respectively.
The two-point correlation function of dusty galaxies was computed using the Halo Occupation Distribution (HOD) formalism. The power spectrum of the galaxy distribution is parameterized as the sum of two terms: a 1-halo term, dominating on small scales, that accounts for the distribution of galaxies within the same halo, and a 2-halo term, that describes the correlations among galaxies residing on different halos and, therefore, dominates on larger scales. The HOD provides a statistical description of how galaxies populate dark matter halos and we model it using the central-satellite formalism (see, e.g., , 2005). This assumes that the first galaxy to be hosted by a halo lies at its center, while the remaining galaxies are distributed in proportion to the halo mass profile and are classified as satellites. The mean halo occupation function of satellite galaxies is parameterized as: , where is the halo mass and the power-law index is a free parameter. As for the 2-halo term, the key parameter, determining the amplitude of the effective bias function , is the minimum halo mass, .
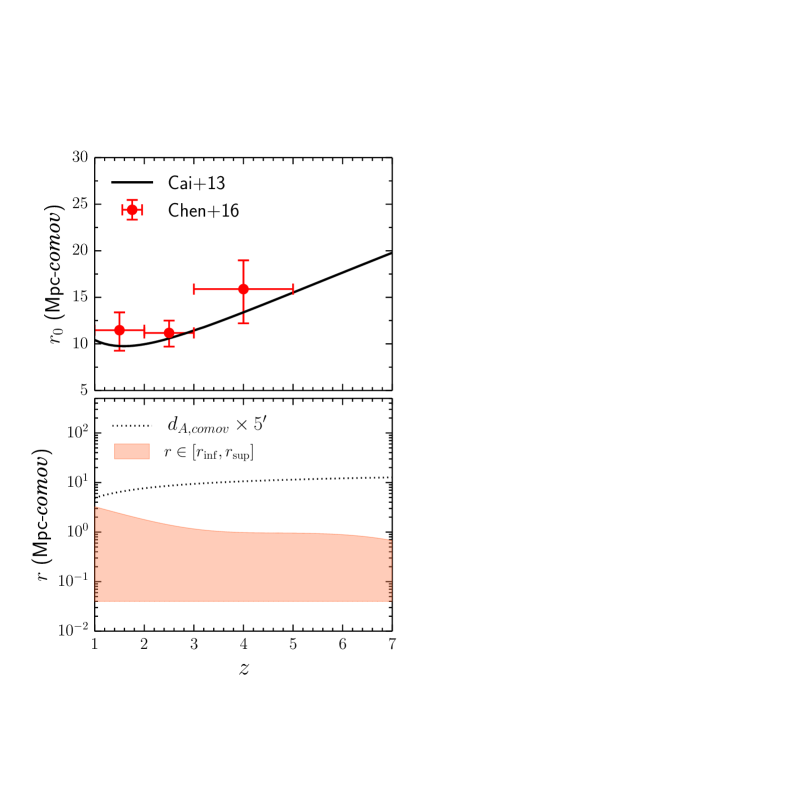
We have adopted the HOD parameter values derived by C13 by fitting the power spectra of the Cosmic Infrared Background (CIB) measured by Planck and Herschel. The spatial correlation function, , was then computed as the Fourier anti-transform of the 3D power spectrum. We refer the reader to (2012) for all the relevant details on the formalism used. The clustering radius, or correlation length, , defined by , is found to be, in comoving units, Mpc in the redshift range . It is shown by the solid line in the upper panel of Fig. 1.
Recently, (2016b) have measured the correlation length of a sample of sub-millimetre galaxies, with redshifts and star formation rates Myr-1, identified using a new colour selection technique, which combines three optical-near-infrared colours (, 2016a). Their estimates of in 3 redshift intervals (, and ) are shown in the same figure and are in good agreement with the results of C13.
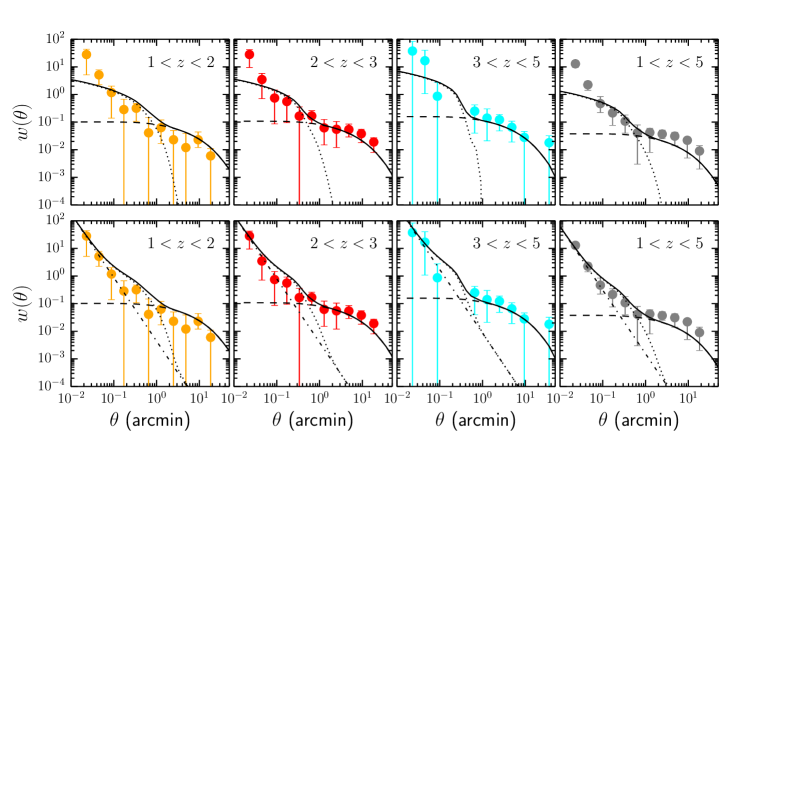
In Fig. 2 we show the angular correlation function measured by (2016b) in the 3 redshift slices and for the full sample (). The prediction of the C13 model (computed using the redshift distribution of the Chen et al. sample), without any tuning of the HOD parameters, is also shown for comparison (dashed curve for the 2-halo term; dotted curve for the 1-halo term). The agreement is remarkably good on angular scales ; however, on the smallest scales the model significantly underestimate the clustering of sub-mm galaxies. This is not a surprise considering that the constraints derived by C13 were obtained from measurements performed at larger angular scales than those probed by Chen et al. It is beyond the scope of this paper to perform a detailed analysis of the signal measured by Chen et al. within the HOD formalism. Therefore, in order to achieve a good agreement with the data we add an extra contribution to the 1-halo term below 0.2′, that we model as a power-law, . The fit to the data gives . The extra term is shown by the dot-dashed curve in the lower panels of Fig. 2.
We adopt the transition scale between the 2- and the 1-halo terms as the radius of the proto-cluster, . As illustrated by Fig. 2, the corresponding angular scale ranges from to for varying from to . Hence, the Planck resolution is not ideal for detecting individual proto-clusters. Higher resolution surveys, such as those planned with the Cosmic Origins Explorer (CORE), will be far more efficient for this purpose (De Zotti et al., 2016).
The additional power-law contribution to dominates on scales corresponding to physical linear scales of 50–100 kpc. Interestingly, this is the scale of the proto-cluster cores at –2.5 detected by (2013) and (2016).
The integrals over in eqs. (1) and (4) are carried out up to , while the lowest value of is set by the minimum angular scale probed by the Chen et al. measurements, i.e. (or 1.5′′), which corresponds to a comoving length of kpc for . In our calculations we set kpc (comoving), corresponding to kpc (physical) at where the distribution of Planck proto-cluster candidates peaks. The values of and , as a function of redshift, are shown by the upper and lower limits of the shaded region in lower panel of Fig. 1. In the same figure, the dotted curve represents the scale sampled by the beam of Planck at sub-millimeter wavelengths (i.e. ). It is clear that such proto-clusters would appear as point-like sources in the Planck maps.
For the amplitude of the three point correlation function
we assumed . This
formula was derived by (2001) from N-body simulations and
holds on scales Mpc h-1, i.e. on the scales of
interest here. We neglect any dependence of on the
linear scale. At variance with N05 we do not consider a model with
suggested by perturbation theory (, 1993) as this holds
on larger scales, i.e. in the limit of small density
fluctuations. We also discard the unrealistic
model corresponding to , as this holds for a pure dark-matter
distribution, i.e. not for visible galaxies
(e.g. , 1996).
We note that since decreases with increasing redshift, the
contribution to from the second term in the
right-hand side
of eq. (2) may become negative. When this happens we set such contribution to zero.
| Reference | ||
|---|---|---|
| 2.050.09 | 316 | (2014) |
| 2.270.12 | 7311 | (2014) |
| 2.41 | 576 | (2013) |
| 2.506 | 15.8 | (2016) |
| 5.30 | 178 | (2011) |
4 Results and comparison with observations
The search of proto clusters at high redshift have been carried out using many different approaches and several of these structures have already been found. We provide below a summary of some of the most significant findings.
By exploiting the wealth of data covering the entire accessible electromagnetic spectrum in the 2 deg2 Cosmological Evolution Survey (COSMOS; , 2007) field, (2011) searched for proto-clusters finding one at . This primordial cluster is characterized by an overdensity of galaxies within a region of Mpc (comoving) radius around the extreme starburst galaxy COSMOS AzTEC-3 and has an estimated total (baryonic+dark) mass of M⊙.
(2013) identified at least four intrinsically luminous galaxies at across an kpc region by studying the CO line properties of the sub-mm brightest sources in the Herschel Astrophysical Terahertz Large Area Survey (H-ATLAS; , 2010). Specifically, they focused on a sample of candidate lensed galaxies with , extracted from deg2 of the H-ATLAS (i.e. the Equatorial North Galactic pole fields), for which measurements of the CO(1-0) emission line were previously obtained with the Green Bank Telescope (, 2012). The clump of luminous galaxies discovered by Ivison et al. was interpreted as the core of an overdensity that will evolve into a massive (M⊙) cluster.
(2016) looked instead for concentrations of -band selected red galaxies at over a 1.62 deg2 region of the COSMOS field, finding a significant overdensity of massive galaxies at associated with extended X-ray emission. The high star formation rate (Myr-1) measured in the central 80 kpc region of the overdensity suggests that also in this case we are witnessing the rapid build-up of a cluster core.
(2014) examined the Herschel/SPIRE images of the 16 Planck Early Release Compact Source Catalog sources lying within the 90 deg2 of the Herschel Multitiered Extragalactic Survey (HerMES; , 2012), finding 4 overdensities of sub-mm sources. Using existing multiwavelength photometric data they estimated redshifts in the range and typical star formation rates SFRM⊙ yr-1 for the protoclusters.
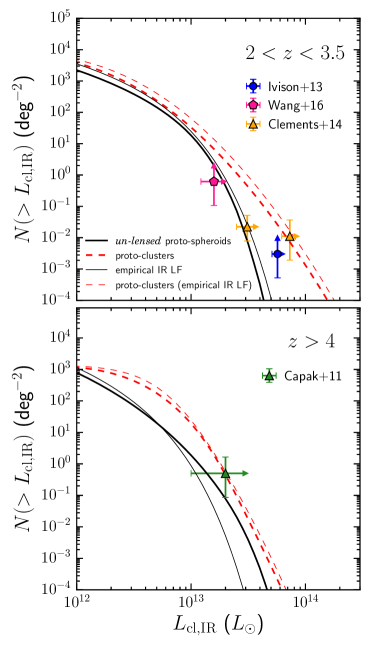
In Fig. 3 we compare these observations with the predictions based on our model. The measured infrared luminosities of the proto-clusters, listed in Table 1, are presented as lower limits. In fact they only account for cluster members detected above the flux limit of the observations, while a significant, or even dominant, contribution is expected from fainter members. For example, using the (2013) model we find that sources brighter than 50 mJy at m, approximately the 90% completeness level of Herschel observations used by Planck Collaboration XXVII (2015), comprise 29, 43, 65 and 66% of the luminosity obtained integrating the whole luminosity function at , 2, 2.5 and 3, respectively. In other words, proto-clusters stand out more clearly in sub-mm maps, such as those that have been provided by Planck and will be hopefully provided by CORE, than in much higher resolution point source surveys at the same wavelengths. This is in keeping with the findings by (2014) and (2016) who noted that the sub-mm flux densities of proto-cluster candidates measured by Planck are about 2 to 3 times larger than the summed luminosities of member galaxies detected with Herschel within the Planck beam, although part of the difference is to be attributed to the ‘flux boosting’ affecting the low signal-to-noise Planck measurements (sources are preferentially detected if they are on top of positive confusion plus instrumental noise fluctuations).
Not only the proto-cluster luminosities but also the number densities inferred from the (2013) and (2016) detections are lower limits. (2013) only focused on Herschel sources with existing CO line measurements, while (2016) based their selection on a -band catalogue, that may miss proto-clusters of heavily dust-enshrouded galaxies. Information on the redshift and infrared luminosity of the proto-clusters in Fig. 3 are summarized in Table 1.
We also show, in the same figure, the predictions based on the infrared luminosity function of Mancuso et al. (2016). For the latter predicts more proto-clusters than the Cai et al. model. This is because the Mancuso et al. infrared luminosity function is higher than the Cai et al. one for L⊙ and , which leads to higher values of the mean and variance of the clump luminosity. However, the difference between the two models is still consistent with the uncertainties in the measured luminosity function of dusty galaxies at those luminosities and redshifts (see fig.1 of Mancuso et al., 2016).
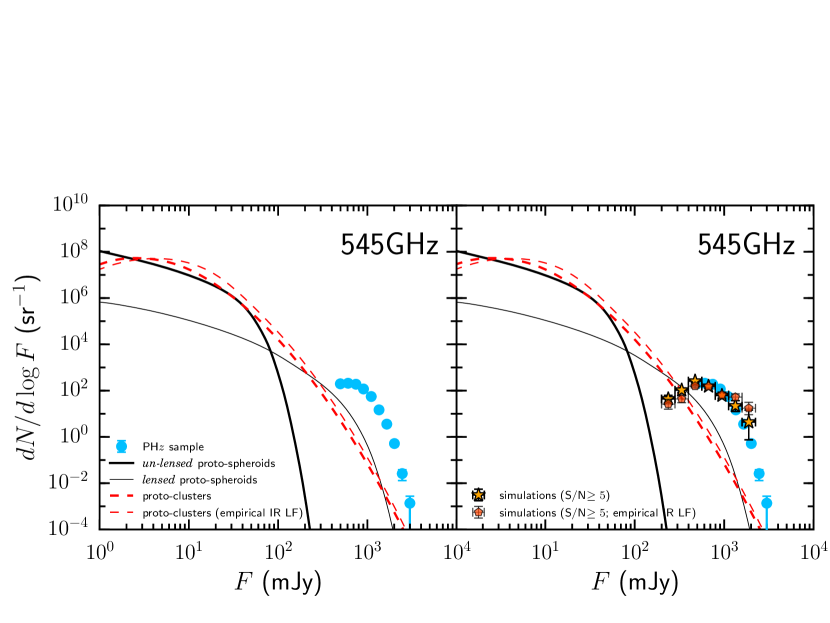
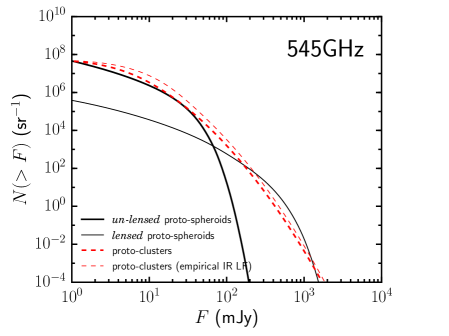
Having checked that our model yields results consistent with observations, that refer to the redshift range probed by the sample of PCXXXIX, we compare, in Fig. 4, our predictions (dashed red curve; thicker for the Cai et al. model and lighter for the Mancuso et al. empirical luminosity function) with the counts at 545 GHz (550m) of the PH sources, reported in the latter paper (filled blue circles). The number counts at a given wavelength are derived from the IR luminosity function of the clumps [eq. (5)] by adopting the spectral energy distribution (SED) of the star forming galaxy SMM J2135-0102 (, 2010) for the proto-spheroids, as done by (2013).
Apart from the small fraction of strongly lensed galaxies (around 3%; Planck Collaboration XXVII, 2015), these candidate high- sources may be either over-densities of bright star-forming galaxies (i.e. proto-clusters) or high peaks of the cosmic infrared background (CIB) fluctuations with red colours because are contributed by physically unrelated high- galaxies.
Figure 4 also shows, for comparison, the differential number counts of strongly lensed galaxies. Such counts were computed using the formalism of (2012, their SISSA model) with a maximum amplification that is found by (2017) to reproduce the counts of strongly lensed galaxies in the H-ATLAS. The number densities of the PH sample are well in excess of those expected from our model, also when using the empirical luminosity function of Mancuso et al., and, more importantly, of the number densities of high- halos capable of hosting them, as pointed out in Sect. 1. In the next Section we discuss a plausible explanation of the discrepancy.
5 The effect of source confusion
Thanks to the very low instrumental noise of the Planck High Frequency Instrument (HFI), the fluctuation field measured in the HFI maps is signal-dominated. In regions with low Galactic dust content, clustering of high- sources making up the CIB is the dominant source of intensity fluctuations, at sub-mm wavelengths, on the several arcmin scales of interest here. The probability distribution function (PDF) of such intensity fluctuations is highly skewed, with an extended tail towards high signal-to-noise ratios (cf. Fig. 10 of , 2015).
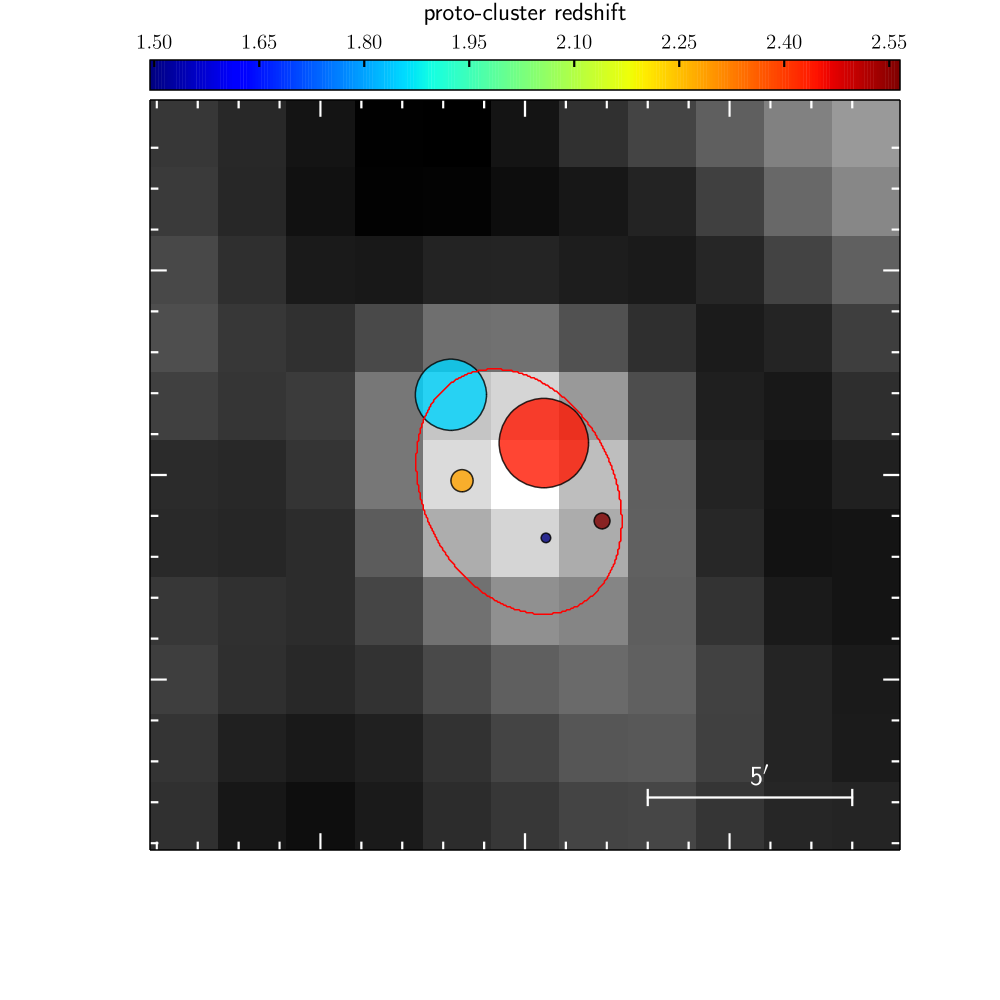
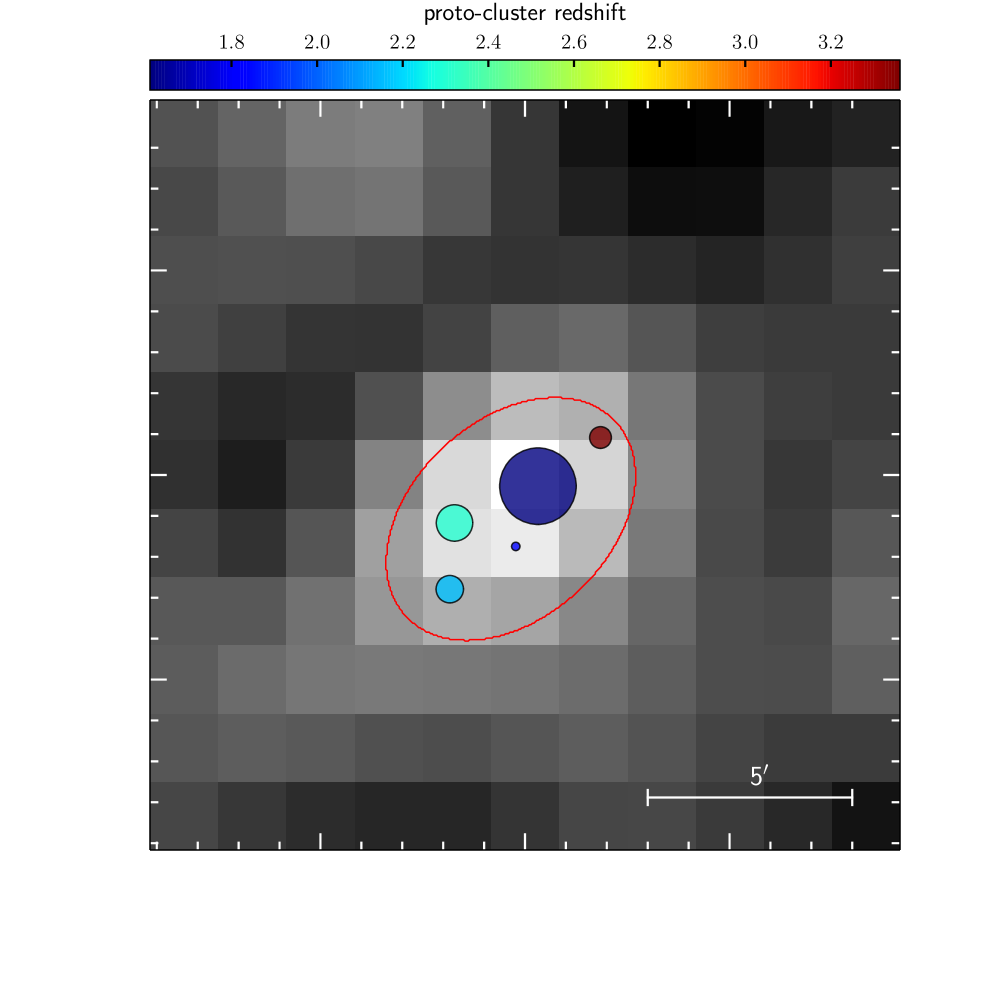
To investigate the nature of high signal-to-noise intensity peaks we have resorted to Monte Carlo simulations. Proto-clusters have been randomly distributed in infrared luminosity and redshift over an area of deg2, according to the modelled luminosity functions. The area was divided into 1.7′1.7′ pixels3331.7′ corresponds to 1/3 of the Planck Full Width at Half Maximum (FWHM) at 545 GHz. and the flux densities of proto-clusters within each pixel were summed up. The map was then convolved with the Planck beam and background subtracted. The source extraction was performed by looking for connected pixels with signal-to-noise ratio (SNR)444A detection requires at least one pixel above the SNR threshold. SNR as in PCXXXIX. A couple of examples of the content of simulated intensity peaks with are shown in Fig. 6. One or two very luminous proto-clusters are generally present; however, most of the flux density within the Planck beam is accounted for by much fainter objects, as implied by the steepness of the bright portion of the proto-cluster counts (Figs. 4 and 5).
The source flux density is obtained by first fitting a Gaussian to a postage stamp centered on the detected object and then integrating the best-fit model. The differential number counts measured in the simulated map are shown in the right-hand panel of Fig. 4 by the yellow stars. The effect of source confusion is dramatic and brings the number counts in line with the measured ones (blue dots). The same conclusion is reached when we use the Mancuso et al. empirical luminosity function for dusty galaxies, as illustrated by the orange pentagons in the same figure.
The model integral number counts of individual high- () proto-clusters, displayed in Fig. 5, show that those brighter than the flux limit of the PH sample (500 mJy at 545 GHz), hence detectable by Planck, are expected to be very rare. The CORE project can do much better. Its estimated detection limits, at the nearby frequency of 520 GHz, range from 141 mJy for the 1 m telescope option to 82.5 mJy for a 1.5 m telescope (De Zotti et al., 2016). From Fig. 5 the corresponding surface densities range from to .
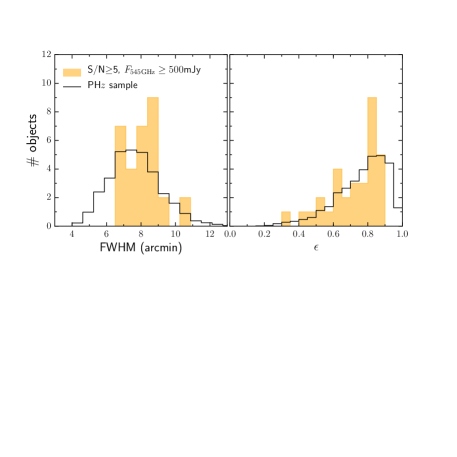
The yellow histograms in Fig. 7 show the distributions of the FWHMs and of the ellipticities, , of sources detected in simulated maps with SNR and mJy (very similar results are obtained using the empirical luminosity function of Mancuso et al.). The distributions are qualitatively consistent with those of the PH sample (solid histograms, taken from Fig. 14 of PCXXXIX), suggesting that the elongated shape of the detected sources is an effect of source confusion rather than being an intrinsic property of the proto-clusters. Note that a close agreement between the results of our simulations and the observed distributions is not to be expected because simulations cannot reproduce exactly the selection criteria adopted by PCXXXIX (simultaneous detection within a radius in the 545 GHz excess map, with , and in the 857, 545, and 353 GHz cleaned maps with ; absence, at 100 GHz, of any local maximum with within a radius of of the 545 GHz position; colour-colour selection) and their procedures for determining sizes and ellipticities.
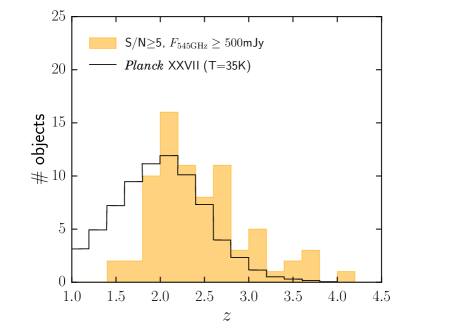
Finally, in Fig. 8 we show the redshift distribution of the brightest proto-clusters associated with the sources detected in the simulated map with SNR and mJy. For comparison, we also show the photometric redshift distribution (obtained assuming a modified black body spectrum with dust temperature K and dust emissivity index ) of the Herschel/SPIRE detected sources associated with the Planck candidate proto-clusters (Planck Collaboration XXVII, 2015, black histogram in the same figure). Both histograms peak in the redshift range showing the great potential offered by the Planck catalogue for studying the early phases of clusters formation.
6 Conclusions
The PHz catalogue appears to be dominated by over-densities of star-forming galaxies plus a small fraction of strongly gravitationally lensed galaxies (around 3%; Planck Collaboration XXVII, 2015). Motivated by these results, we have updated the N05 predictions for the number counts of proto-clusters of star-forming galaxies and compared them with observational estimates.
We stress that our results are largely model-independent. The basic ingredients of our calculations are the sub-mm luminosity functions of high- galaxies and their spatial correlation function. The luminosity functions have been observationally determined up to , based on Herschel survey data (Gruppioni et al., 2013). The model we have used reproduces very well the observational determinations at each redshift (, 2013, 2014). Furthermore, we have shown that the results do not change significantly if the model is replaced by an empirical fit of the observed luminosity function of dusty galaxies (Mancuso et al., 2016). As shown by Fig. 2, our model also provides an accurate representation of the observed redshift dependent correlation functions.
We find that the counts of sub-mm bright proto-clusters, obtained in the framework of the standard CDM cosmology, are well below the observational estimates by PCXXXIX. A similar conclusion can be inferred from the results of (2015) who also predict, by using a completely different approach, a number of proto-clusters well below the one suggested by the statistics of Planck detections.
We have shown that this basically follows from the fact that, at high , there are not enough sufficiently massive halos. On the other hand we have shown, by means of simulations, that the Planck cold intensity peaks are fully consistent with being mostly random fluctuations in the number of unrelated proto-clusters at within the Planck beam. This is highlighted in Fig. 6 where examples of sources detected in the simulation are shown together with the brightest proto-clusters they are comprised of. The counts of these fluctuations match very well those of cold peaks and there is qualitative agreement also with the distributions of their FWHM’s and of their ellipticities. Interestingly, the only Planck over-density for which spectroscopic or photometric redshifts of member galaxies have been obtained, was found to consist of 2 physically unrelated structures at and (, 2016).
The redshift distribution of the brightest proto-clusters contributing to the cold peaks, given by the model, has a broad maximum between and . Therefore, follow-up observations of galaxies within the Planck overdensities providing redshift estimates would be a powerful tool to investigate the early phases of cluster formation, inaccessible by other means.
Acknowledgments
We thank the referee for helpful suggestions.
MN acknowledges financial support from the European Union’s Horizon
2020 research and innovation
programme under the Marie Skłodowska-Curie grant agreement No 707601.
GDZ acknowledges financial support by by ASI/INAF agreement
n. 2014-024-R.1 for the Planck LFI activity of Phase
E2. J.G.N. acknowledges financial support from the Spanish MINECO for
a ’Ramon y Cajal’ fellowship (RYC-2013-13256)
and the I+D 2015 project AYA2015-65887-P (MINECO/FEDER)
References
- (1) Aversa R., Lapi A., de Zotti G., Shankar F., Danese L., 2015, ApJ, 810, 74
- (2) Bonato M. et al. 2014, MNRAS, 438, 2547
- (3) Cai Z.-Y. et al. 2013, ApJ, 768, 21
- Cai et al. (2014) Cai Z.-Y., Lapi A., Bressan A., De Zotti G., Negrello M., Danese L., 2014, ApJ, 785, 65
- (5) Cañameras R., et al., 2015, A&A, 581, A105
- (6) Capak P. L. et al., 2011,Nature, 470, 233
- (7) Casey C. M., et al., 2015, ApJ, 808, L33
- (8) Casey C. M., 2016, ApJ, 824, 36
- (9) Chen C. C., et al. 2016a, ApJ, 820, 82
- (10) Chen C. C., et al. 2016b, ApJ, 831, 91
- (11) Clements D. L. et al., 2014, MNRAS 439, 1193
- (12) Clements D. L., et al., 2016, MNRAS, 461, 1719
- (13) Coles P., Jones B., 1991, MNRAS, 248, 1
- (14) Dannerbauer H., et al., 2014, A&A, 570, A55
- (15) De Zotti G., et al., 2015, JCAP, 6, 018
- De Zotti et al. (2016) De Zotti G., et al., 2016, arXiv, arXiv:1609.07263
- (17) Eales S. et al., 2010, PASP, 122, 499
- (18) Flores-Cacho I., et al., 2016, A&A, 585, A54
- (19) Fry J. N., Gaztanaga E., 1993, ApJ, 413, 447
- (20) Granato G. L., De Zotti G., Silva L., Bressan A., Danese L., 2004, ApJ, 600, 580
- (21) Granato G. L., Ragone-Figueroa C., Domínguez-Tenreiro R., Obreja A., Borgani S., De Lucia G., Murante G., 2015, MNRAS, 450, 1320
- Gruppioni et al. (2013) Gruppioni C., et al., 2013, MNRAS, 432, 23
- (23) Harrison I., Coles P., 2012, MNRAS, 421, L19
- (24) Harris A. et al., 2012, ApJ, 752, 152
- (25) Ivison R., et al. 2013, ApJ, 772, 137
- (26) Kayo I., Taruya A., Suto Y., 2001, ApJ, 561, 22
- (27) Kennicutt R. C., Evans N. J., 2012, ARA&A, 50, 531
- (28) Kofman L., Bertschinger E., Gelb J. M., Nusser A., Dekel A., 1994, ApJ, 420, 44
- (29) Lapi A., et al., 2006, ApJ, 650, 42
- (30) Lapi A., et al., 2011, ApJ, 742, 24
- (31) Lapi A., Negrello M., Gonzalez-Nuevo J., Cai Z.-Y., De Zotti G., Danese L., 2012, ApJ, 755, 46
- Ma et al. (2015) Ma C.-J., et al., 2015, ApJ, 806, 257
- Mancuso et al. (2016) Mancuso C. et al. 2016, ApJ, 833, 152
- Negrello et al. (2005) Negrello M., Gonzalez-Nuevo J., Magliocchetti M., Moscardini L., De Zotti G., Toffolatti L., Danese L., 2005, MNRAS, 358, 869
- (35) Negrello M., et al., 2017, MNRAS, 465, 3558
- (36) Oliver S. J. 2012, MNRAS, 424, 1614
- Overzier (2016) Overzier R. A., 2016, A&ARv, 24, 14
- Peebles (1980) Peebles P. J. E., 1980, The Large-Scale Structure of the Universe. Princeton Univ. Press Princeton
- Planck Collaboration XXVII (2015) Planck Collaboration. XXVII, 2015, A&A, 582, A30
- Planck Collaboration XIII (2016) Planck Collaboration. XIII, 2016, A&A, 594, A13
- (41) Planck Collaboration. XXXIX, 2016, A&A, 596, A100
- (42) Rigby E. E., et al., 2014, MNRAS, 437, 1882
- (43) Scoville N. Z. et al. 2007, ApJ, 172, 1
- (44) Sheth R. K. & Tormen G., 1999, MNRAS, 308, 119
- (45) Swinbank A. M. et al. 2010, Nature, 464, 733
- (46) Szapudi I., Meiksin A., Nichol R. C., 1996, ApJ, 473, 15
- (47) Szapudi I., Postman M., Lauer T. R., Oegerle W., 2001, ApJ, 548, 114
- (48) Taruya A., Hamana T., Kayo I., 2003, MNRAS, 339, 495
- (49) Taylor A. N., Watts P. I. R., 2000, MNRAS, 314, 92
- (50) Valtchanov I., et al., 2013, MNRAS, 436, 2505
- (51) Wang T. et al. 2016, ApJ, 828, 56
- (52) Xia J.-Q., Negrello M., Lapi A. De Zotti G., Danese L., Viel M., 2012, MNRAS,422, 1324
- (53) Zheng Z., et al., 2005, ApJ, 633, 791