11email: kokusho@u.phys.nagoya-u.ac.jp 22institutetext: Sub-department of Astrophysics, Department of Physics, University of Oxford, Denys Wilkinson Building, Keble Road, Oxford OX1 3RH, UK
33institutetext: Institute of Space and Astronautical Science, Japan Aerospace Exploration Agency, Chuo-ku, Sagamihara 252-5210, Japan
A star formation study of the ATLAS3D early-type galaxies with the AKARI all-sky survey
Abstract
Context. The star formation properties of early-type galaxies (ETGs) are currently the subject of considerable interest, particularly whether they differ from those of gas-rich spirals.
Aims. We perform a systematic study of star formation in a large sample of local ETGs using polycyclic aromatic hydrocarbon (PAH) and dust emission, focusing on the galaxies’ star formation rates (SFRs) and star formation efficiencies (SFEs).
Methods. Our sample is composed of the ETGs from the ATLAS3D survey, from which we use the cold gas measurements (H i and CO). The SFRs are estimated from stellar, PAH and dust fits to spectral energy distributions created from new AKARI measurements and literature data from WISE and 2MASS.
Results. The mid-infrared luminosities of non-CO-detected galaxies are well correlated with their stellar luminosities, showing that they trace (circum)stellar dust emission. CO-detected galaxies show an excess above these correlations, uncorrelated with their stellar luminosities, indicating that they likely contain PAHs and dust of interstellar origin. PAH and dust luminosities of CO-detected galaxies show tight correlations with their molecular gas masses, and the derived current SFRs are typically – yr-1. These SFRs systematically decrease with stellar age at fixed stellar mass, while they correlate nearly linearly with stellar mass at fixed age. The majority of local ETGs follow the same star-formation law as local star-forming galaxies, and their current SFEs do not depend on either stellar mass or age.
Conclusions. Our results clearly indicate that molecular gas is fueling current star formation in local ETGs, that appear to acquire this gas via mechanisms regulated primarily by stellar mass. The current SFEs of local ETGs are similar to those of local star-forming galaxies, indicating that their low SFRs are likely due to smaller cold gas fractions rather than a suppression of star formation.
Key Words.:
Galaxies: elliptical and lenticular, cD – Galaxies: star formation – Galaxies: ISM – Galaxies: photometry – (ISM:) dust, extinction – Infrared: galaxies1 Introduction
Stellar population studies of local early-type galaxies (ETGs; ellipticals and lenticulars) show that they are dominated by old stars and reside in the so-called red sequence of the optical colour-magnitude diagram. This suggests that they ceased to form stars at an early stage of their evolution (e.g., Cowie et al. 1996; Thomas et al. 2010), and thus represent the end point of galaxy evolution.
The interstellar space of ETGs is generally filled with hot X-ray gas (e.g., Forman et al. 1985), that can heat and destroy any cold interstellar medium (ISM), the fuel for star formation. Nevertheless, atomic gas, molecular gas and dust have all been detected in a significant fraction of ETGs (e.g., Knapp et al. 1985; Wardle & Knapp 1986; Knapp et al. 1989; Knapp & Rupen 1996), and evidence for the presence of such cold gas and dust in ETGs has grown for the last two decades through both radio and infrared (IR) observations. In particular, Young et al. (2011) carried out a molecular gas survey of the ETGs in the ATLAS3D sample (Cappellari et al. 2011), that aimed to reveal the formation and evolutionary processes of nearby ETGs. With a high detection rate of , they confirmed that molecular gas is prevalent in ETGs, suggesting that some ETGs may still be able to form new stars. Far-infrared (FIR) emission from cold dust in ETGs was systematically investigated first with the Infrared Astronomical Satellite (IRAS; Knapp et al. 1989). More recent observations with satellites such as the Infrared Space Observatory (ISO), Spitzer, AKARI and Herschel also detected dust of both circumstellar and interstellar origin in many ETGs (e.g., Temi et al. 2003; Kaneda et al. 2011; Smith et al. 2012). Polycyclic aromatic hydrocarbons (PAHs), that are destroyed by X-rays much more easily than dust, are also detected in some ETGs (e.g., Kaneda et al. 2005, 2008; Rampazzo et al. 2013). As PAHs are considered a star formation tracer, their presence in ETGs again suggests that star formation is ongoing. Indeed, PAHs are excited and ionised by far-ultraviolet (FUV) light from young stars, producing strong features primarily at wavelengths of , and m, while they are destroyed by hard UV and X-ray radiation from active galactic nuclei (AGN; e.g., Peeters et al. 2004).
Utilizing PAH emission observed with Spitzer, Shapiro et al. (2010) investigated the star formation properties of the ETGs in the SAURON sample (de Zeeuw et al. 2002), and argued that ETGs are forming stars with surface densities and efficiencies similar to those of spiral galaxies. They also suggested that star formation in ETGs proceeds in at least two different modes (widespread and circumnuclear), that may reflect different evolutionary paths. With PAH and mid-infrared emission (MIR), Crocker et al. (2011) calculated the current star formation rates (SFRs) of the SAURON ETGs, and suggested that they form stars less efficiently than spiral galaxies. Using both numerical simulations and observational results, Martig et al. (2013) similarly argued that ETGs have lower star formation efficiencies (SFEs; defined as the SFR per unit cold gas mass ) than spiral galaxies, likely due to the increased stability of discs embedded in spheroids (morphological quenching). The same trend is reported in the ATLAS3D sample using SFRs estimated from MIR and FUV light (Davis et al. 2014). It has also been suggested that AGN and galaxy mergers can respectively heat (and expel) and strip away the cold ISM of ETGs, thus suppressing star formation (i.e., lowering the SFE; see, e.g., Schawinski et al. 2006; Nesvadba et al. 2011; Alatalo et al. 2015; Guillard et al. 2015; Lanz et al. 2016). It is therefore likely that while ETGs have a substantial cold ISM and are forming stars, their SFE is reduced with respect to that of spiral galaxies, due to a number of properties and mechanisms particular to them.
In a different vein, the sources of the cold ISM in ETGs are themselves a matter of debate. As mentioned above, the stellar populations of ETGs are uniformly old, indicating that the original cold gas reservoirs that led to galaxy formation have already been consumed (e.g., Bower et al. 1992). In addition, old stars do not efficiently produce dust, and ETGs are filled with hot X-ray gas, that can destroy dust through sputtering (e.g., Draine & Salpeter 1979). Yet Goudfrooij & de Jong (1995) clearly demonstrated that ellipticals contain more dust than that expected from the balance between production via stellar mass loss (e.g., Faber & Gallagher 1976) and destruction via X-ray sputtering. Galaxy mergers are therefore frequently invoked as a possible mechanism to supply cold gas and dust to ETGs. For example, Davis et al. (2011) studied the kinematics of stars, ionised gas and molecular gas in ETGs and, due to the pervasiveness of kinematic misalignments between stars and gas, suggested that the majority of them may obtain cold gas from external sources. Internal sources are however also proposed by several authors. For example, based on the spatial distribution of dust and X-ray gas, it has been suggested that intermittent buoyant outflows from low-luminosity AGN can replenish dust in ellipticals (e.g., Temi et al. 2007; Kaneda et al. 2011). Continuous dust production by old stars and dust growth in the ISM are other potential channels for dust production in ETGs (Martini et al. 2013; Hirashita et al. 2015).
Depending on how ETGs obtain their gas and dust, star formation may well proceed differently. A systematic study of the cold ISM properties of a large sample of ETGs, coupled with constraints on their star formation activity, is thus essential to properly understand ETG evolution. Here, we systematically investigate the star formation properties of the ATLAS3D ETGs using PAH and dust emission measured from the AKARI all-sky survey, combined with Wide-field Infrared Survey Explorer (WISE) and Two Micron All Sky Survey (2MASS) archival data, and atomic and molecular gas data from ATLAS3D. We detail our measurements in Sect. 2 and present the main results in Sect. 3. The star formation properties of ETGs are discussed in Sect. 4 and we summarise our results in Sect. 5.
2 Sample and Data
2.1 ATLAS3D survey
The goal of the ATLAS3D project was to conduct a comprehensive study of a complete, volume-limited sample of morphologically-selected local ETGs ( and Mpc; Cappellari et al. 2011). A diverse range of observations and simulations was performed, at its core optical integral-field spectroscopic observations with the SAURON instrument (Bacon et al. 2001), yielding detailed information on the stellar kinematics (Krajnović et al. 2011; Emsellem et al. 2011; Krajnović et al. 2013a, b) and populations (Cappellari et al. 2012; Scott et al. 2013; McDermid et al. 2014, 2015). In addition to single-dish molecular gas surveys (Combes et al. 2007; Young et al. 2011), both H I and CO interferometric observations were obtained (Young et al. 2008; Crocker et al. 2011; Serra et al. 2012; Alatalo et al. 2013). The morphology and kinematics of the molecular gas are characterised in Davis et al. (2013), while its physical conditions are discussed in Crocker et al. (2012) and Bayet et al. (2013).
2.2 AKARI all-sky survey
The new IR fluxes presented here were obtained from the AKARI satellite (Murakami et al. 2007) all-sky surveys in the MIR (central wavelengths and m; Onaka et al. 2007) and FIR (, and m; Kawada et al. 2007). For the MIR and m bands, the total galaxy flux densities were obtained through aperture photometry as follows. First, we applied a spatial filtering of arcmin-1 to each galaxy image, to remove periodic noise. Second, we performed aperture photometry on the all-sky diffuse maps (Doi et al. 2015; Ishihara et al., in preparation), within a circular aperture of radius , where is the effective radius of each galaxy in the optical band (Cappellari et al. 2011) and is the full width at half maximum of the point spread function (PSF) of the AKARI instrument at the given wavelength (Ishihara et al. 2010; Takita et al. 2015). The average sky level was first measured in a circular annulus of inner radius and outer radius , and was then subtracted from individual measurements. The uncertainty of the total flux density of a given object in a given band was estimated by appropriately propagating the uncertainty on individual measurements, taken as the standard deviation of the flux densities in the same sky annulus. For the FIR , and m bands, the total galaxy flux densities were measured in an identical manner, but without the initial spatial filtering. Details of the measurement will be provided in the AKARI ETG catalogue (Kaneda et al., in preparation), in which integrated flux density measurements of ETGs selected from the HyperLeda catalogue (Makarov et al. 2014) will be detailed.
Overall, we measured AKARI flux densities for , , , and of the ATLAS3D ETGs in the , , , and m bands, respectively, the missing measurements being due to incomplete AKARI sky coverage. When possible, the missing and m flux densities were replaced by IRAS and/or m measurements, as listed in the NASA/IPAC Extragalactic Database (NED)111https://ned.ipac.caltech.edu/. In the , and m bands, respectively, a further , and measurements are likely affected by source confusion or instrumental artefacts, and are thus excluded from our analysis. The MIR and FIR flux densities thus derived are listed in Table LABEL:tab:fluxes.
It has already been shown that AKARI fluxes are in good agreement with analogous measurements by Spitzer and Herschel (Suzuki et al. 2010; Hattori et al. 2016), but we nevertheless check the quality of our measurement here by comparing our AKARI and m flux densities with Spitzer and Herschel measurements. Among our sample, galaxies have published Spitzer m measurements (Amblard et al. 2014), and galaxies have both Herschel and m measurements (Dale et al. 2012; di Serego Alighieri et al. 2013; Baes et al. 2014). In all cases (AKARI m vs. Spitzer m, AKARI m vs. Herschel m and AKARI m vs. Herschel m), we find that most measurements are consistent within the uncertainties, and that they are proportional with a slope of approximately unity and a small intrinsic scatter of 0.2 dex, thus confirming the reliability of our measurements. These parameters are estimated using a linear fit with free slope and nul intercept in log-log space, adjusting the intrinsic scatter until the reduced is equal to (see Williams et al. 2010).
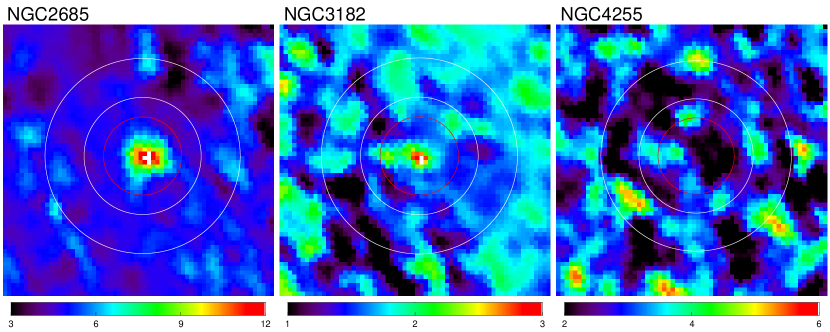
The number of galaxies robustly detected (defined here as having a signal-to-noise ratio ) is summarised in Table 1 for each band. Detection rates are , , , and for the , , , and m bands, respectively. In the FIR, 117 galaxies () are detected in at least one band (thus one, two or three FIR bands), while 71 galaxies () are detected in at least two bands (thus two or three FIR bands). The lower detection rates at and m are due to respectively a relatively high background level (Kondo et al. 2016) and a narrow bandwidth (Kawada et al. 2007). Systematic flux density uncertainties are estimated to be in the MIR ( and m; Ishihara et al., in preparation), and , and in the FIR (, and m, respectively; Takita et al. 2015). For illustrative purposes, Figure 1 shows an example of a strong detection (), a marginal detection () and a non-detection (), all in the AKARI m band.
| Band | Detected | Not detected | Not observed | Total |
|---|---|---|---|---|
| 9 m | 106 | 152 | 2 | 260 |
| 18 m | 33 | 227 | 0 | 260 |
| 65 m | 42 | 217 | 1 | 260 |
| 90 m | 111 | 148 | 1 | 260 |
| 140 m | 70 | 184 | 6 | 260 |
2.3 WISE survey
Near-infrared (NIR) and MIR flux densities for our sample galaxies are also available from the AllWISE catalog (Cutri et al. 2013), composed of data obtained during the cryogenic and post-cryogenic phases of the WISE all-sky survey. We therefore use the four WISE photometric bands with central wavelengths of , , and m. Total magnitudes were measured using aperture photometry (and are referred to as WXGMAG, with X equal to 1, 2, 3 or 4 for each of the four WISE bands), with the aperture calculated from 2MASS NIR surface photometry (Skrutskie et al. 2006) and the WISE PSF. When a WXGMAG magnitude is not available, we adopt instead the profile fit magnitude WXMPRO. However, as some galaxies are much more spatially extended than the WISE PSF, the profile fit photometry can underestimate the true total fluxes. To avoid this, the WXMPRO magnitudes are calibrated using the method of Griffith et al. (2015), that takes into account the extent of the galaxies as measured from other WISE photometric parameters. Despite this, we use the uncorrected profile fit magnitudes when there is strong contamination from background sources, as the correction process is then likely to be inaccurate. The 2MASS-determined WXGMAG apertures of galaxies that are well resolved spatially can also be slightly too small, resulting in total flux densities underestimated by as much as 333http://wise2.ipac.caltech.edu/docs/release/allsky/expsup/sec6_3e.html. We therefore add a systematic uncertainty of to the WISE systematic flux calibration uncertainties.
3 Results
3.1 Relation between IR and -band luminosities
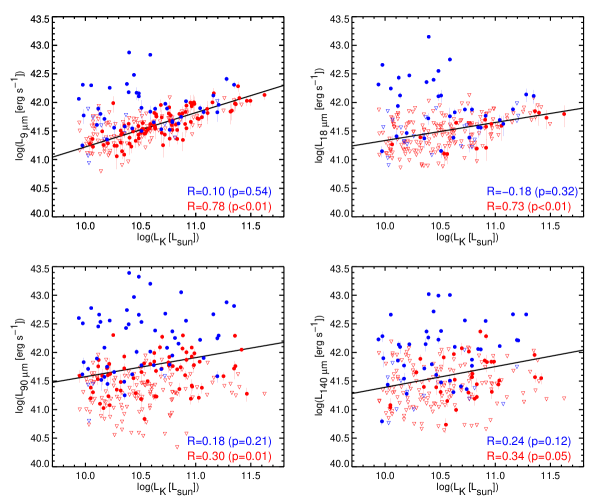
Figure 2 shows correlations between the total , , and m AKARI luminosities and the total -band luminosities listed in Cappellari et al. (2011). Luminosities are estimated using the galaxy distances listed in Cappellari et al. (2011) throughout this paper. Data points are colour-coded according to whether the sample galaxies are detected in CO (blue) or not (red) in Young et al. (2011). To quantify the contribution of the stellar emission from old stellar populations to the AKARI luminosities, we fitted the correlations of non-CO-detected galaxies with straight lines. The best fits are shown in the panels of Fig. 2 and the best-fit parameters are listed in Table 2. By subtracting the best fits from the luminosities of CO-detected galaxies, we can estimate their excess luminosities and assess whether these correlate with the -band luminosities. This in turn establishes if the excess luminosities are of (circum)stellar origin or not (and thus of interstellar origin).
| Band | ||
|---|---|---|
| 9 m | ||
| 18 m | ||
| 90 m | ||
| 140 m |
As the sample galaxies cover a rather large range of -band luminosities and are spread over that range roughly uniformly in , it is preferable to do the above fits in - space (as shown in Fig. 2). While we would ideally use for those fits only robustly detected galaxies (i.e., those measurements with ), this would not leave enough data points for a reliable fit at m. For each band, we therefore use the lowest threshold yielding only positive measurements (, , and at respectively , , and m). The linear correlation coefficients () of those measurements and the probabilities of obtaining the measured if the null hypothesis is true () are also listed in each panel, to ascertain the strengths of the correlations. Measurements below those thresholds are replaced by upper limits of the same significance in Fig. 2.
As can be seen in the top-left panel of Fig. 2, the m luminosities of non-CO-detected galaxies correlate very well with their -band luminosities (with a correlation coefficient and confidence levels). As band traces old stellar populations and the m emission of non-CO-detected galaxies is also expected to be dominated by emission from the stars themselves, a correlation between these two bands is expected. However, CO-detected galaxies show excess m emission, being systematically above the correlation of non-CO-detected galaxies (or consistent with it), suggesting that CO-detected galaxies have PAH emission beyond any associated with the stars. Indeed, the AKARI m band is sensitive to major PAH bands at , and m (Ishihara et al. 2010). Furthermore, the excess luminosities of CO-detected galaxies do not correlate well with their -band luminosities ( and ), suggesting that their PAHs are not of circumstellar origin but rather of interstellar origin.
The correlation between the m and -band luminosities is also significant for non-CO-detected galaxies ( and ; top-right panel of Fig. 2), suggesting that the bulk of their m emission is of circumstellar dust origin. This is supported by the fact that circumstellar dust generated and heated by old stars is known to be the dominant emission source in ETGs at and m (Athey et al. 2002; Temi et al. 2009). Most CO-detected galaxies again show a significant excess above the correlation of non-CO-detected galaxies, and their excess luminosities is not correlated with their -band luminosities ( and ). The m emission of CO-detected galaxies is thus likely due to interstellar dust heated by relatively young stellar populations or AGN activity (see Nyland et al. 2016 for a study of nuclear radio emission in ATLAS3D ETGs). The and m luminosities thus strongly suggest that ETGs with detectable molecular gas also contain significant interstellar dust.
In the bottom two panels of Fig. 2, the correlations between the FIR and m luminosities (tracing cold dust) and the NIR -band luminosities (tracing stellar emission) of non-CO-detected galaxies are weaker than those in the MIR bands and are not statistically significant. This appears consistent with the results of Temi et al. (2007), who argued that FIR emission in ETGs originates from cold dust of interstellar origin, presumably spread and heated by diffuse starlight and/or hot gas. However, it is worth noting that the correlations are not totally negligible either ( and at and m, respectively). This raises the interesting possibility that the stellar populations of ETGs may have cold dust of circumstellar origin, perhaps in shells at large stellar-centric radii. This should however be verified with either more accurate or more numerous data. Either way, CO-detected galaxies again show systematically brighter FIR emission, uncorrelated with stellar emission, implying that they are even richer in interstellar cold dust than the norm (i.e., than non-CO-detected galaxies).
3.2 PAH and dust emission
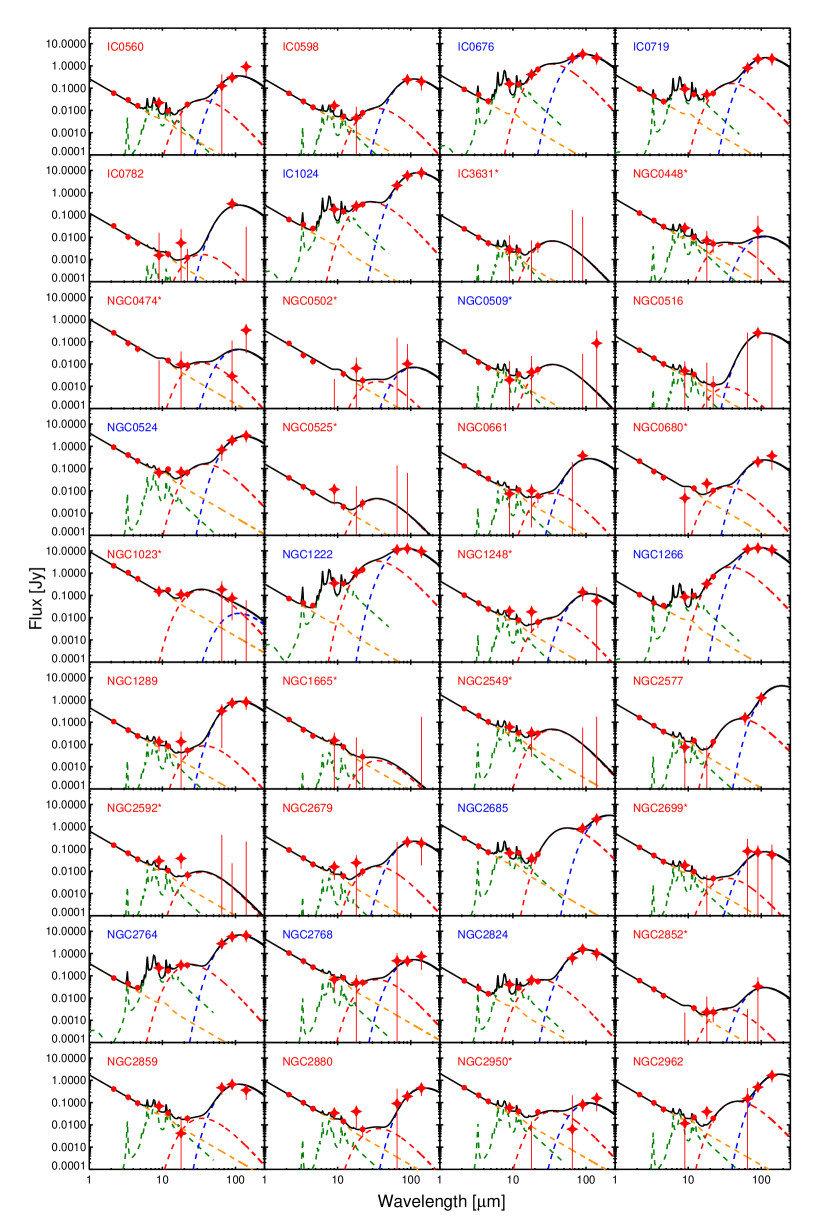
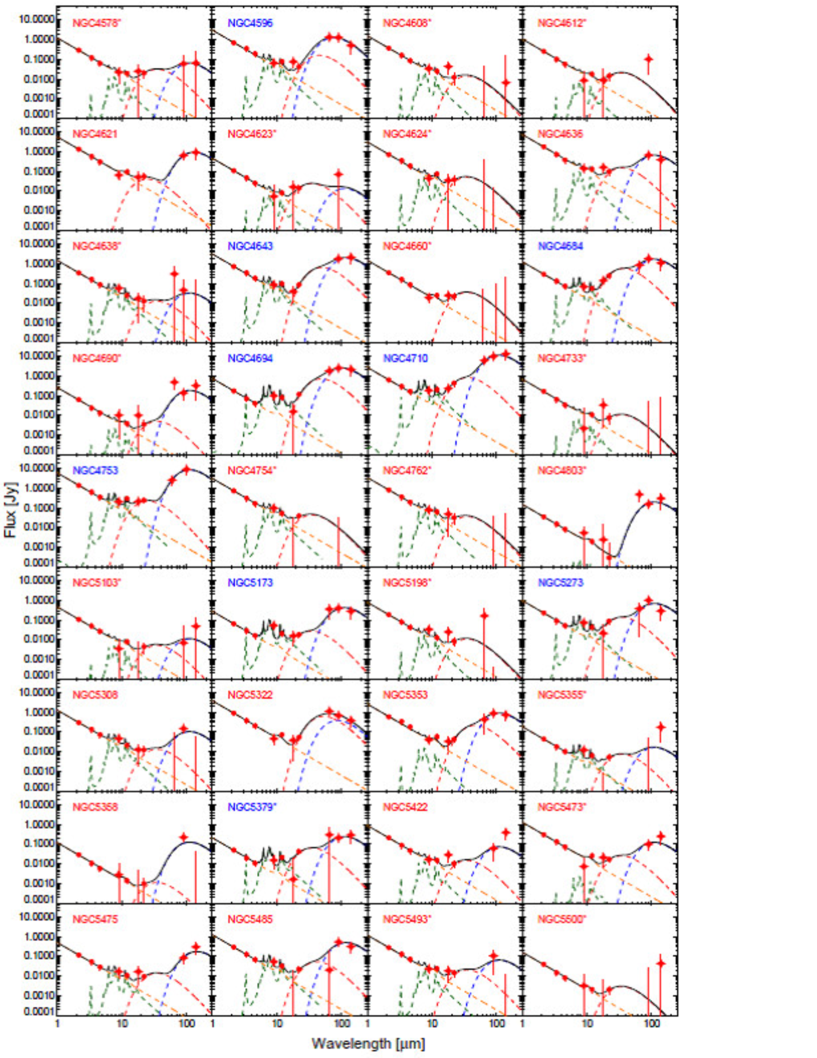
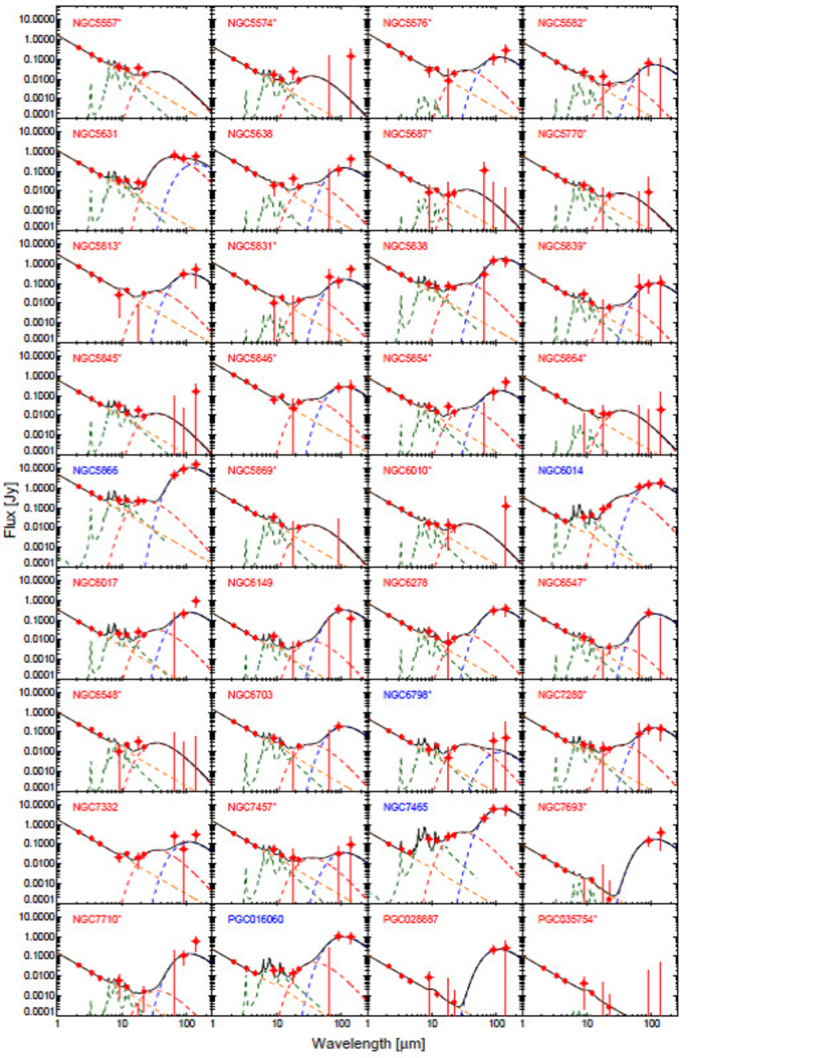
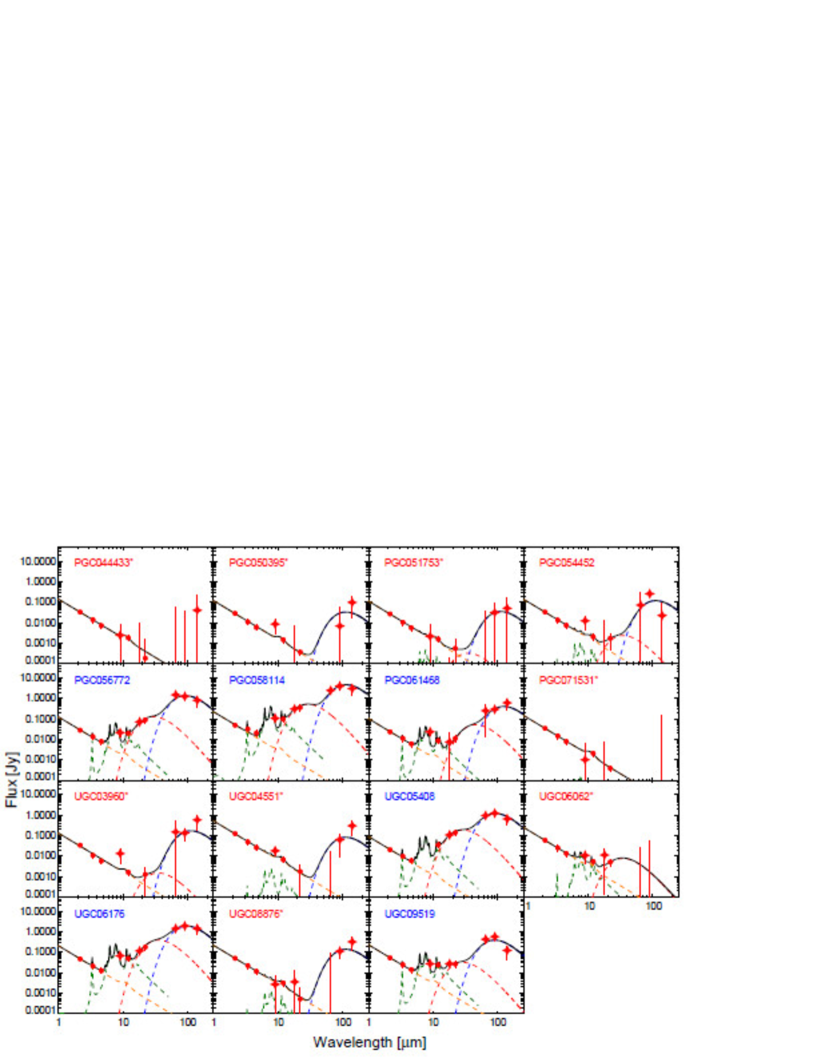
To estimate accurate PAH and dust luminosities for our sample galaxies, we created spectral energy distributions (SEDs) by combining the 2MASS -band, WISE and AKARI data. We fitted each SED with a model composed of emission from stars, PAHs and two dust components (warm and cold). We described the stellar continuum emission with a power-law model. In addition, to describe a silicate feature seen in ETGs around m (e.g., Bressan et al. 2006), we added a Gaussian function to the power-law model, where the width and amplitude of the Gaussian relative to the stellar continuum were determined from the quiescent elliptical galaxy template of Kaneda et al. (2008). The Draine & Li (2007) model was used for the PAH emission, with a size distribution and ionised fraction typical of the diffuse ISM of star-forming galaxies (for lack of a better model), while only the amplitude was allowed to vary. The warm and cold dust components were each described by a modified blackbody model with emissivity power-law index (Galametz et al. 2012), while the amplitude and temperature were allowed to vary. When fitting the SEDs, we used all detections regardless of their significance, adopting their errors as weights (, where is the error), with the additional constraint that the fits must be positive at all wavelengths.
First, we fitted the SEDs of galaxies robustly detected (i.e., ) in two or three FIR bands, by allowing all the parameters to vary. Then, by fixing the warm and cold dust temperatures to the means of the best-fit temperatures of those galaxies, we fitted the SEDs of the remaining galaxies (i.e., galaxies detected in only one or no FIR band). Although this ignores the differences between random and systematic uncertainties and is therefore not ideal, we added the measurement and systematic flux calibration uncertainties in quadrature when performing the fits.
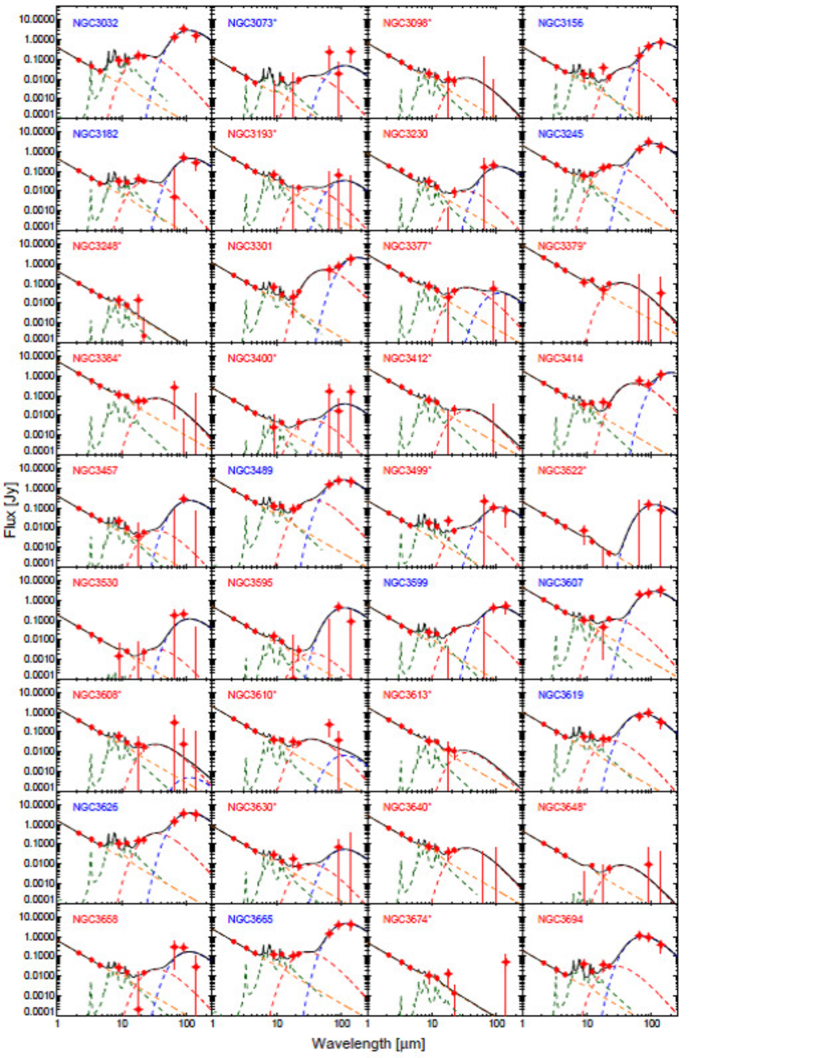
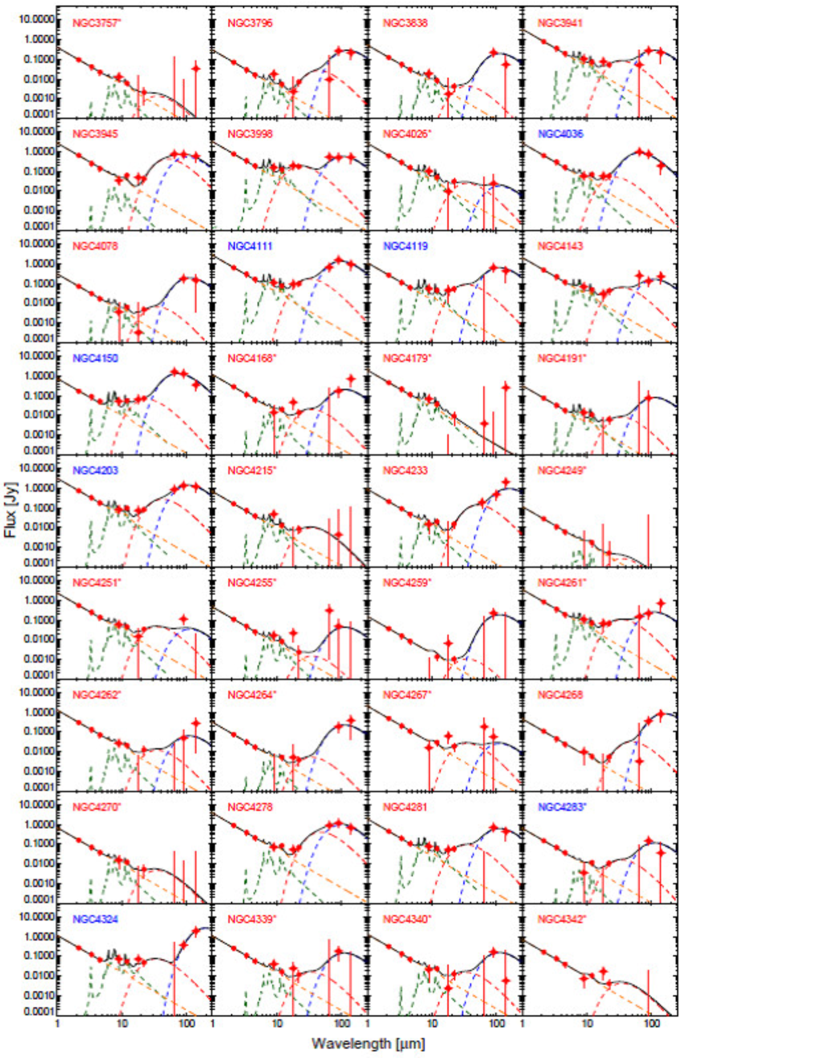
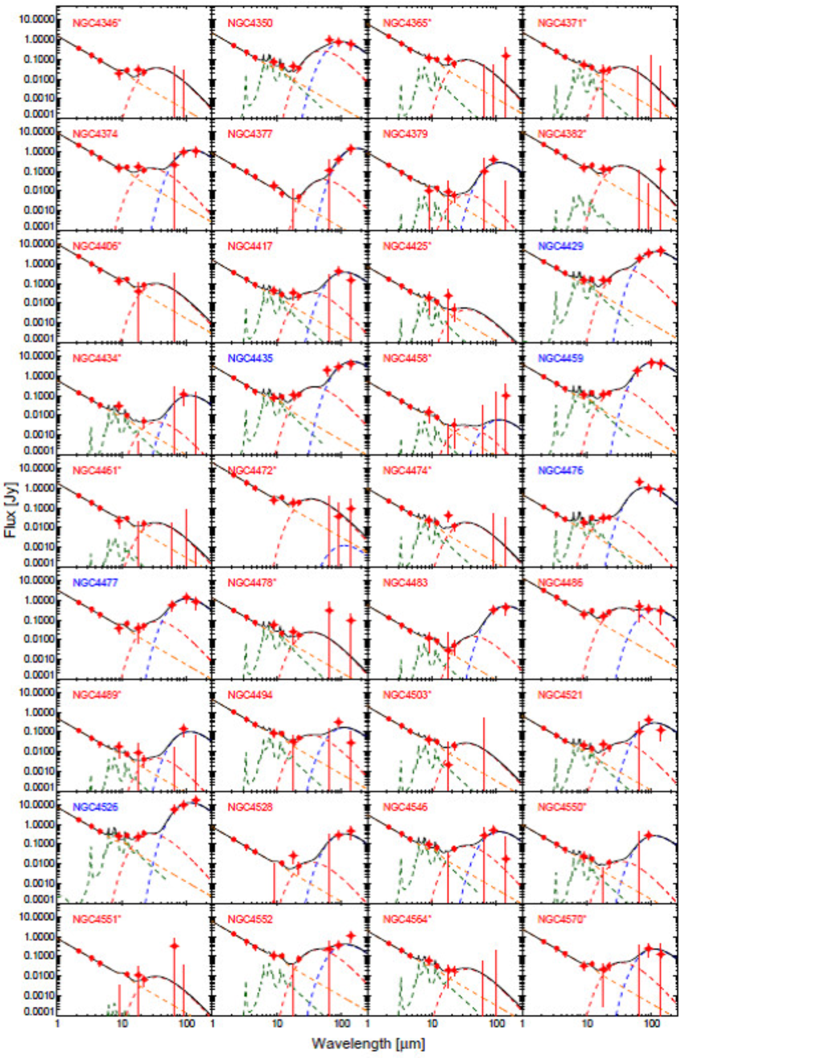
In our sample, galaxies are robustly detected in two or three FIR bands, from which we estimated a mean dust temperature of K for the warm component and K for the cold component. The fit was not acceptable at the confidence level for of these objects. For the remaining galaxies, the fit was not acceptable for objects. These objects were thus excluded from the following analysis. The SEDs and best-fit models of the remaining ATLAS3D ETGs are shown in Fig. 3.
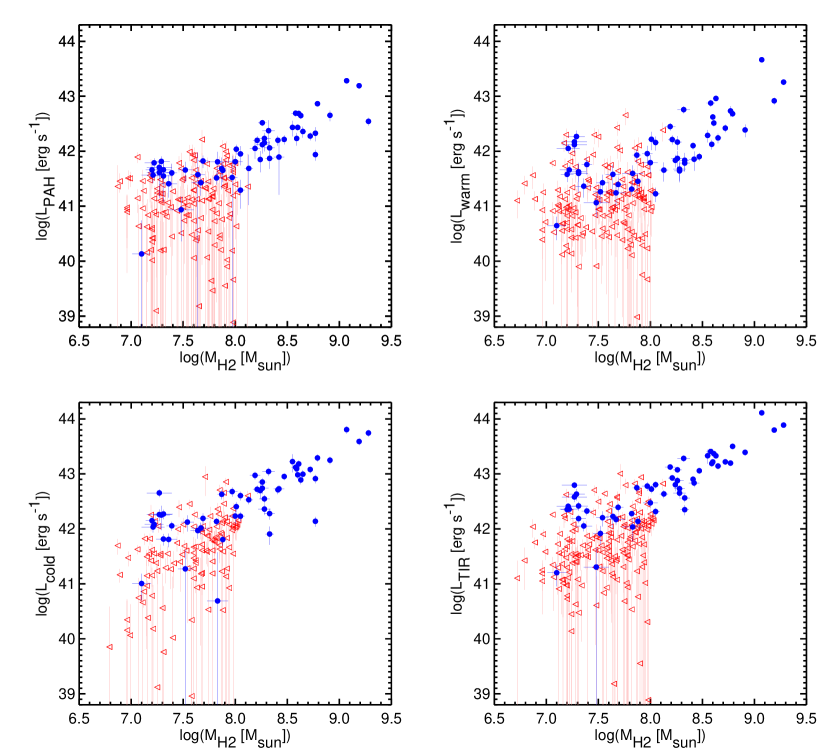
We calculated the PAH and dust luminosities (, and ) by integrating the aforementioned best-fits of each component over the wavelength range – m. The luminosities thus derived are listed in Table LABEL:tab:luminosities, and the total IR (TIR) luminosities () were estimated by simply taking the sums of those three components. To check the reliability of our PAH luminosities, we compared them to the PAH luminosities derived by Shapiro et al. (2010) using the non-stellar Spitzer m emission (as done in Sect. 2.2 for our and m flux densities). The PAH luminosities are almost all consistent within the uncertainties, and are proportional with a slope of approximately unity and a small intrinsic scatter of 0.2 dex. Figure 4 shows , , and plotted against H2 mass, the latter calculated from the integrated CO line intensity assuming a Galactic conversion factor (see Young et al. 2011). It is clear that the IR luminosities of CO-detected galaxies (here stellar emission-subtracted by construction) are well correlated with their molecular gas masses, thus confirming a tight connection between dust and molecular gas even in ETGs (see also Combes et al. 2007). Among the IR luminosities, has a relatively large scatter, suggesting that dust heating by young stellar populations and/or AGN can vary from galaxy to galaxy.
3.3 Star formation rates
To estimate the current SFRs of the ATLAS3D ETGs with good SED fits, we utilised the PAH and TIR luminosities calculated from those fits. In particular, ionised PAHs are known to be good tracers of star formation, as they are exposed to the radiation fields of photo-dissociation regions around relatively young stars, and the AKARI m band is sensitive to the , and m features of ionised PAHs (Ishihara et al. 2010). We note that relatively quiescent ETGs tend to show unusually high PAH m/PAH m ratios, indicating a dominance of neutral PAHs not related to star formation (e.g., Kaneda et al. 2005, 2008; Panuzzo et al. 2011), but our results are not likely to be sensitive to this unusual interband ratio as is mostly determined from the AKARI m band that excludes the m feature. Furthermore, the WISE m-band fluxes do not indicate the presence of unusually strong PAH m features. To convert to a SFR, we adopted the method described in Shipley et al. (2016), in which the sum of the , and m features is used to estimate the SFR. The ratio of these PAH bands to the total PAH emission is in the PAH template adopted for our SED fits (a value typical of star-forming galaxies; Smith et al. 2007), so we simply propagate this fraction in our calculations. To convert to a SFR, we used the conversion of Kennicutt (1998) with a correction to the Kroupa initial mass function (Hao et al. 2011; Murphy et al. 2011).
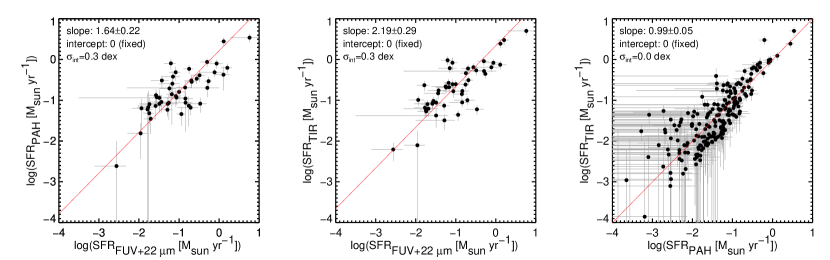
For the majority of our ETGs, the current SFR is estimated to be in the range – yr-1. Furthermore, as shown in the right panel of Fig. 5, the SFRs estimated from PAH luminosities are in good agreement with those estimated from TIR luminosities, with an average ratio of SFRPAH/SFR and nul intrinsic scatter (given the large uncertainties; estimated again as in Sect. 2.2).
For CO-detected ETGs of the ATLAS3D sample, Davis et al. (2014) estimated the current SFR with a combination of FUV and m emission. In the left and middle panels of Fig. 5, we therefore compare those SFRs with the PAH and TIR SFRs calculated here. Our SFRs are generally in good agreements with those of Davis et al. (2014), but they are systematically larger by a factor of at SFRs smaller than yr-1 (SFRPAH/SFR and SFRTIR/SFR, with intrinsic scatters of dex, for all galaxies in common). This systematic difference is presumably due to the specific physical conditions in the star-formation regions of ETGs, that will be discussed in Sect. 4.3.
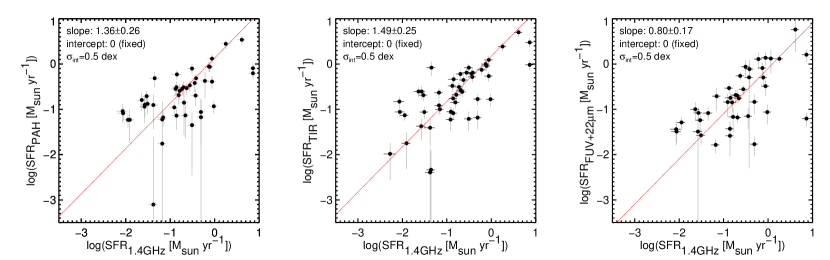
Low-frequency ( GHz) radio continuum observations of ATLAS3D ETGs were presented by Nyland et al. (2017). We therefore estimated SFRs from these measurements using the conversion of Murphy et al. (2011), and we compare these estimates with our PAH- and TIR-derived estimates in Fig. 6. As shown in the left and middle panels, our measurements are generally in good agreements with those derived from Nyland et al. (2017), but they are systematically larger by factors of SFRPAH/SFR and SFRTIR/SFR, with intrinsic scatters of dex (for all galaxies in common). As can be expected from the discussion in the paragraph above, the GHz- and FUV+ m-derived SFRs are then in rough agreement (SFRFUV+22μm/SFR, with an intrinsic scatter of dex for galaxies in common; see the right panel of Fig. 6). These results will also be discussed in Sect. 4.3.
4 Discussion
4.1 Relations between SFRs and gas masses
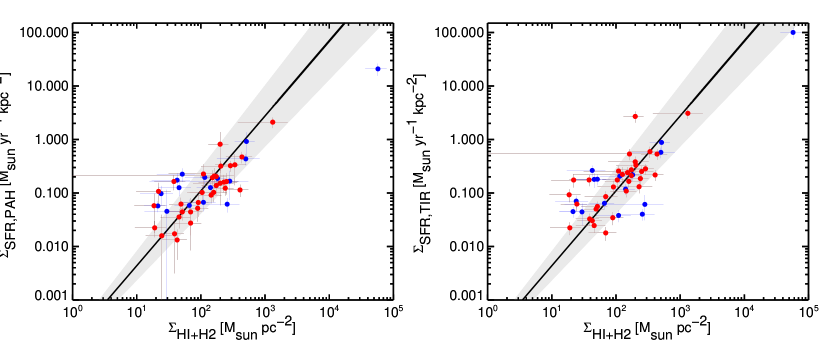
Star formation in galaxies is characterized by a power-law relation between the current SFR () and cold gas mass () surface densities, known as the Kennicutt-Schmidt (KS) law (), where the power-law index is found to be for local star-forming galaxies (Kennicutt 1998) but varies from to from galaxy to galaxy, reflecting differences in the star formation processes (e.g., Taniguchi & Ohyama 1998; Misiriotis et al. 2006). The power-law index is also generally closer to unity for molecules tracing gas denser than CO (e.g., HCN; Gao & Solomon 2004). Davis et al. (2014) investigated the KS law of CO-detected ATLAS3D galaxies using their SFRs estimated from FUV and m emission. Here, we revisit the KS law for the same ETGs using our SFRs estimated from PAH and TIR emission.
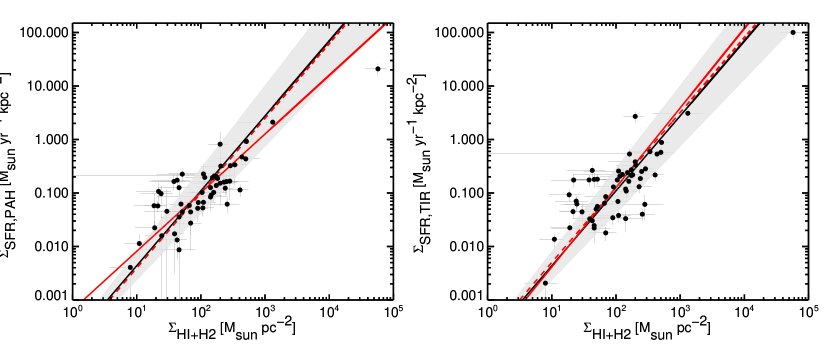
To calculate and , we use our own SFRs but the gas masses and source sizes listed in Davis et al. (2014), where the gas masses were derived by summing the CO and central H I gas masses, and the sizes were measured using interferometric CO, spatially-resolved MIR, optical or FUV observations. The resulting – correlations are shown in Fig. 7. The solid black lines and shaded grey regions show respectively the KS law of local star-forming galaxies with and its intrinsic scatter (Kennicutt 1998). The solid and dashed red lines show the best linear fits to the data with respectively free and fixed () slope. The best-fit parameters are listed in Table 3. We note that the galaxy NGC 1266, that is systematically located in the top-right of each panel of Fig. 7, is known to have strongly suppressed star formation and thus to be an outlier in the star-formation relation (see Alatalo et al. 2011, 2015; Nyland et al. 2013). We have thus excluded it from the fits. Figure 7 shows that the majority of CO-detected (and thus potentially star-forming) ETGs do follow the KS law of local star-forming galaxies. In particular, the fixed-slope fits have no offset with respect to the Kennicutt (1998) relation, suggesting that the SFEs of local ETGs are similar to those of local star-forming galaxies. This is contrary to the results of Davis et al. (2014), that suggested smaller SFEs for the same sample galaxies, by a factor of – . This difference can be directly attributed to the similarly higher SFRs calculated here from the AKARI data (see Sect. 3.3 and Figs. 5 and 6). We come back to this difference in Sect. 4.3.
| SFR tracer | ||
|---|---|---|
| PAH | ||
| PAH | (fixed) | |
| Total IR | ||
| Total IR | (fixed) |
When left free, the slopes of the power-law fits are and for the PAH and TIR SFRs, respectively. The significant deviation of the PAH SFR slope from appears to be caused by several galaxies with relatively high at pc-2. Those galaxies may have a different star-formation mode (e.g., widespread versus circumnuclear) or a different ISM-acquisition mode (e.g., internal versus external). The origin of the gas can be constrained by examining the kinematic misalignment between stars and gas. Kinematically-misaligned gas likely indicates an external origin (e.g., minor merger or accretion from filaments), while kinematically-aligned gas is expected from both internal (e.g., stellar mass loss or remnant from the galaxy formation event) and occasionally external gas. Figure 8 is analogous to Fig. 7, but we colour code the galaxies according to their star-ionised gas kinematic (mis)alignment, when such a measurement is available. Davis et al. (2011) measured star-gas kinematic (mis)alignments for CO-detected galaxies mapped interferometrically in CO, but CO-detected galaxies mapped with optical integral-field spectroscopy in ionised gas, and they showed that both measurements are always in agreement. We therefore use the latter measurements here. Interestingly, Fig. 8 reveals that many of the galaxies with relatively high at pc-2 (and none of the galaxies with relatively low at those same ) have kinematically-misaligned gas, indicating that they have acquired their ISM from external sources. Galaxies with kinematically-misaligned gas also seem to have higher scatters around the best-fit relations than galaxies with kinematically-aligned gas, perhaps suggesting a more bursty and thus temporally variable recent star formation history.
4.2 Relations between SFRs and stellar masses
| SFR tracer | Mass-weighted age (Gyr) | ||
|---|---|---|---|
| PAH | – | ||
| PAH | – | ||
| PAH | – | ||
| Total IR | – | ||
| Total IR | – | ||
| Total IR | – |
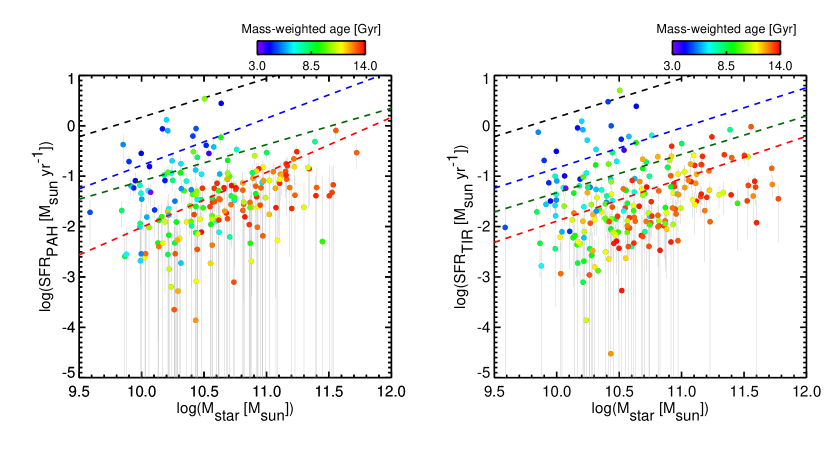
In Fig. 9, the PAH and TIR SFRs of our sample galaxies are plotted against their stellar masses , the latter calculated from optical photometry and stellar mass-to-light ratios measured from dynamical models (Cappellari et al. 2013). The data points are also colour-coded according to the mass-weighted stellar population age of each galaxy, obtained by fitting stellar population synthesis models to the optical spectrum of the inner effective radius (McDermid et al. 2015). We use mass-weighted ages rather than the more common luminosity-weighted ages as the former better represent the age of the bulk of the stellar populations, being less affected by a sprinkling of young stars onto a dominant old stellar population. The dotted black lines show the so-called star-formation main sequence, i.e., the correlation between current SFR and stellar mass of local star-forming galaxies (Elbaz et al. 2007). The dotted blue, green and red lines are linear fits to our ETG galaxies in the age range – , – and – Gyr, respectively. The best-fit parameters are listed in Table 4. A similar figure for the SAURON sample of ETGs was presented by Shapiro et al. (2010), but the much larger ATLAS3D sample of ETGs studied here ( with relevant measurements) offers much clearer insight into the relationship between current SFR, stellar mass and stellar population age.
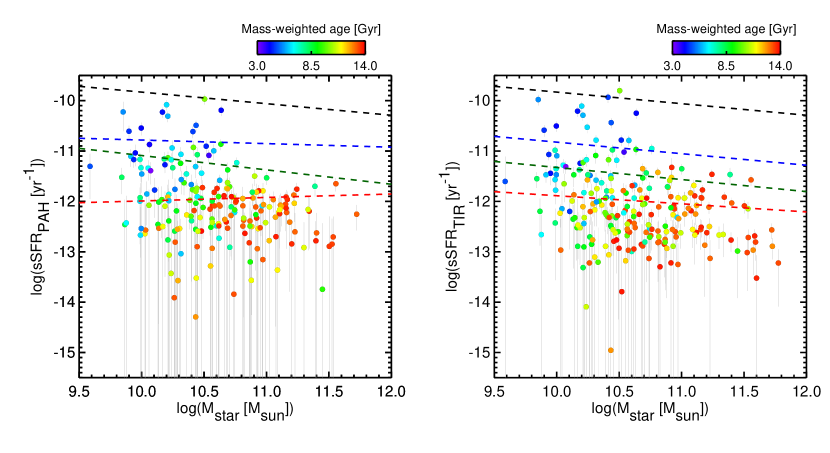
Figure 9 shows that, at fixed stellar mass, all our sample ETGs have a lower current SFR than that of local star-forming galaxies, confirming that local ETGs are quiescent galaxies. Figure 9 also shows that, overall (and at least in the recent history of the universe), the SFRs of ETGs must decrease as they evolve (i.e., ETGs move to the lower-right of the panels as they become older and more massive). However, while at fixed mass the current SFRs decrease strongly with age (here by about dex), at fixed stellar age the current SFRs increase with stellar mass. In fact, at fixed stellar age the SFRs and stellar masses of our ETGs are correlated similarly to those of local star-forming galaxies, with power-law slopes near unity (see Table 4). This is shown more clearly in Fig. 10, that shows the specific SFRs (sSFRs, i.e., ) of our sample galaxies as a function of stellar mass. Indeed, while the current sSFRs of our ETGs strongly decrease with age as expected from Fig. 9, they are nearly independent of stellar mass at any age. Similar trends are reported for galaxies with low SFRs by Saintonge et al. (2016), who studied both early- and late-type galaxies (see their Figs. 2 and 4). This suggests that local ETGs acquire their cold ISM necessary to form stars by mechanisms related to stellar mass, as do normal star-forming galaxies (e.g., Davé et al. 2011).
We note here that the sSFRs and stellar ages we discuss are independent of each other and are not correlated by construction. As our SFRs (estimated from MIR photometry) trace only young stars while our total stellar masses (estimated from optical photometry and stellar dynamical modelling) include both young and old stars, our sSFRs trace the ratio of young to both young and old stars. On the other hand, our stellar ages (estimated from optical spectroscopy) trace the ratio of young to old stars only. Our SFRs are also (nearly) instantaneous measures (tracing stars of ages typically Myrs), while our stellar ages are also affected by (and nearly always degenerate with) intermediate age stars ( Gyr).
4.3 Star formation in ETGs
Based on current SFRs estimated from FUV and m emission, Davis et al. (2014) argued that local ETGs have SFEs lower than those of local star-forming galaxies, an effect they assigned to the particular dynamical properties of ETGs, such as increased central disc stability and/or galactic shear in the central regions where molecular gas is found. However, our results show that the SFEs of (the same) local ETGs estimated from AKARI PAH and TIR emission are similar to those of local star-forming galaxies (see Figs. 5 and 7), in agreement with the smaller study of Shapiro et al. (2010) utilizing Spitzer PAH emission. As TIR emission can be enhanced by low-luminosity AGN and old stellar populations, that are unrelated to star-formation, the discrepancy of the TIR-estimated SFRs is likely easily explained. The discrepancy of the PAH-estimated SFRs is however not so easily explained, and may be due to the fact that PAH emission (like TIR emission) can trace star-formation regions with softer UV radiation fields than those traced in the FUV and at m (e.g., Compiègne et al. 2011). The higher PAH SFRs therefore apparently call for less massive star formation. Indeed, it is suggested that galaxies with low SFRs preferentially form low-mass stars (rather than high-mass stars; e.g., Hoversten & Glazebrook 2008; Gunawardhana et al. 2011), which would result in softer radiation fields in ETGs. The ratios of the [C ii] m line to FIR fluxes also support radiation fields softer in ETGs than in spiral galaxies (Malhotra et al. 2000). While old stars in ETGs can and do emit in the UV (UV-upturn phenomenon; Yi et al. 1997), Davis et al. (2014) argued that this does not significantly affect the FUV-based SFRs of the ATLAS3D ETGs. Interestingly, this preference for low-mass stars is consistent with a flurry of recent works arguing that ETGs have bottom-heavy initial mass functions (IMFs; see, e.g., van Dokkum & Conroy 2010; Cappellari et al. 2012).
Of course, just like the FUV and m estimates, the GHz SFR estimates derived from the Nyland et al.’s (2017) radio continuum measurements are also systematically lower than the PAH- and TIR-derived estimates (see Fig. 6). As the GHz continuum emission is due to non-thermal synchrotron emission associated with supernova remnants (and thus ultimately the explosions of massive stars; e.g., Murphy et al. 2011), this trend is also consistent with a scenario whereby massive star formation is inefficient in ETGs.
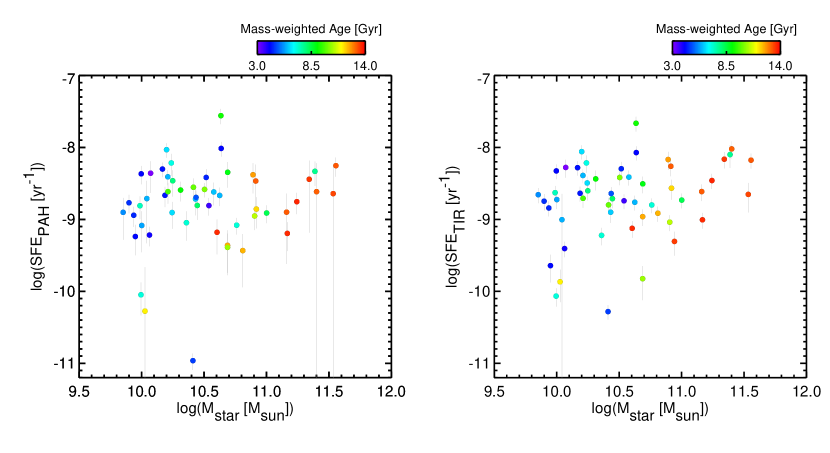
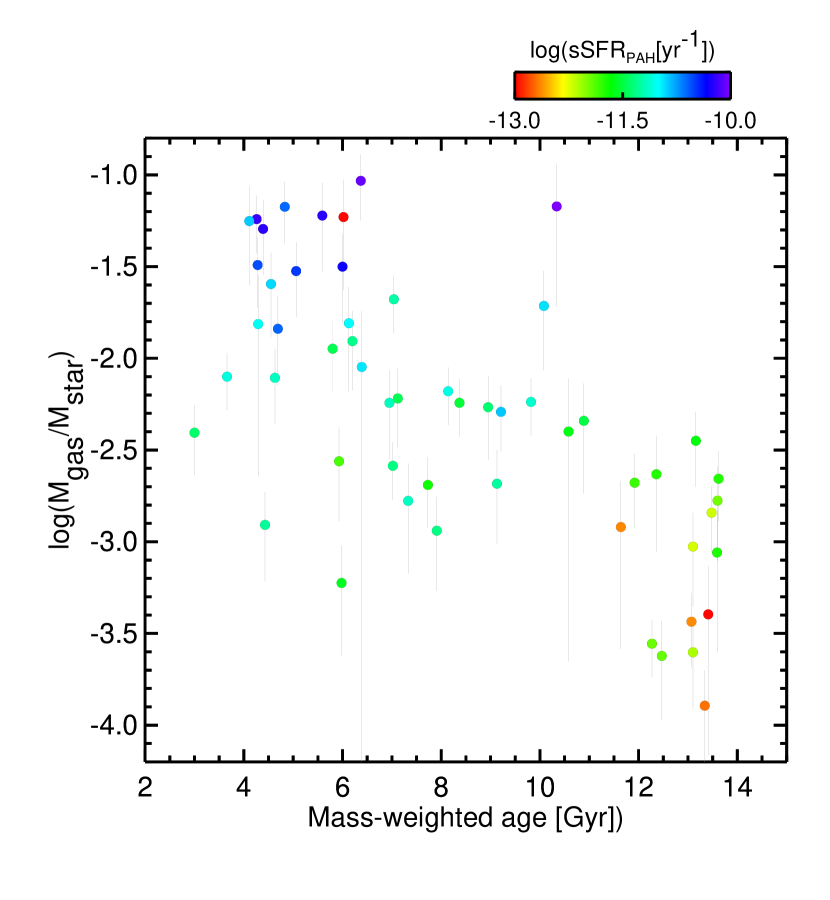
Figure 11 shows the current SFEs of CO-detected ETGs as a function of their stellar masses, with the data points colour-coded as a function of mass-weighted stellar age. No dependence is apparent as a function of either stellar mass or age. Combined with the continuous decrease of the sSFR – relations with stellar age seen in Fig. 10, this implies that the current cold gas fraction () of ETGs must decrease with stellar age (at fixed stellar mass; ). We show this trend in Fig. 12, where is plotted as a function of mass-weighted stellar age. The same trend is reported for nearby massive galaxies () by Saintonge et al. (2011, 2016), although our study extends the trend to lower gas fractions (). Hence our results suggest that the decrease of the current SFR in local ETGs is likely due to a decrease of their cold gas fractions, rather than a suppression of star formation (via, e.g., AGN feedback or specific dynamical properties).
5 Conclusions
We have conducted a systematic study of star formation in the local ETGs of the ATLAS3D survey, using newly measured IR fluxes from the AKARI all-sky diffuse maps combined with WISE and 2MASS literature data. In the AKARI FIR bands, () galaxies are detected in at least one band, while () galaxies are detected in at least two bands. The and m luminosities of the non-CO-detected galaxies are correlated with the stellar luminosities, showing that they trace respectively stellar and circumstellar dust emission. On the other hand, CO-detected galaxies show an excess above these correlations, uncorrelated with the stellar luminosities, indicating that they likely contain PAHs and dust of interstellar origin. There are at best weak correlations between the and m luminosities and the stellar luminosities of non-CO-detected galaxies (but again an excess for CO-detected galaxies), suggesting that FIR emission in ETGs primarily originates from cold dust unrelated to the stars.
We estimated the IR luminosities (, , and ) of the sample ETGs by decomposing their SEDs with a dust model. For the CO-detected galaxies, all of the IR luminosities correlate well with the H2 masses, confirming a tight connection between interstellar dust and molecular gas in local ETGs. Utilizing and as current SFR indicators, we measure typical current SFRs of – yr-1. These SFRs are generally in good agreement with previously measured SFRs using FUV and m emission as well as GHz radio continuum emission, but they are systematically higher by a factor of – , particularly at low SFRs. This discrepancy may be due to the fact that PAH and TIR emission can trace star-formation regions with softer radiation fields than those traced in the FUV, m and GHz bands. The majority of ETGs appear to follow the standard KS law of local star-forming galaxies, with no offset, indicating that they have similar current SFEs. This is contrary to recent results suggesting slightly lower SFEs, and is directly related to the higher SFRs derived. There is also some evidence that ETGs whose cold gas has an external origin have more varied SFEs.
We have also investigated the relations between current SFRs, stellar masses and mass-weighted stellar population ages. At fixed stellar mass, the SFRs rapidly decrease with age, but at fixed stellar age the SFRs are roughly linearly correlated with stellar mass, indicating roughly constant sSFRs. In addition, the current SFEs of CO-detected galaxies appear independent of both stellar age and mass. These results suggest that local ETGs acquire their cold ISM by mechanisms regulated primarily by stellar mass, while at fixed stellar mass the cold gas fraction must decrease with stellar age. Hence the current relatively low SFRs of local ETGs are likely due to a decrease of their cold gas fractions, rather than a suppression of star formation.
Acknowledgements.
This research is based on observations with AKARI, a JAXA project with the participation of ESA, and has made use of the NASA/IPAC Infrared Science Archive and Extragalactic Database (NED), both of which are operated by the Jet Propulsion Laboratory, California Institute of Technology, under contract with the National Aeronautics and Space Administration. T.K. is financially supported by Grants-in-Aid for JSPS Fellows No. 26003136.References
- Alatalo et al. (2011) Alatalo, K., Blitz, L., Young, L. M., et al. 2011, ApJ, 735, 88
- Alatalo et al. (2013) Alatalo, K., Davis, T. A., Bureau, M., et al. 2013, MNRAS, 432, 1796
- Alatalo et al. (2015) Alatalo, K., Lacy, M., Lanz, L., et al. 2015, ApJ, 798, 31
- Amblard et al. (2014) Amblard, A., Riguccini, L., Temi, P., et al. 2014, ApJ, 783, 135
- Athey et al. (2002) Athey, A., Bregman, J., Bregman, J., Temi, P., & Sauvage, M. 2002, ApJ, 571, 272
- Bacon et al. (2001) Bacon, R., Copin, Y., Monnet, G., et al. 2001, MNRAS, 326, 23
- Baes et al. (2014) Baes, M., Allaert, F., Sarzi, M., et al. 2014, MNRAS, 444, L90
- Bayet et al. (2013) Bayet, E., Bureau, M., Davis, T. A., et al. 2013, MNRAS, 432, 1742
- Bower et al. (1992) Bower, R. G., Lucey, J. R., & Ellis, R. S. 1992, MNRAS, 254, 601
- Bressan et al. (2006) Bressan, A., Panuzzo, P., Buson, L., et al. 2006, ApJ, 639, L55
- Cappellari et al. (2011) Cappellari, M., Emsellem, E., Krajnović, D., et al. 2011, MNRAS, 413, 813
- Cappellari et al. (2012) Cappellari, M., McDermid, R. M., Alatalo, K., et al. 2012, Nature, 484, 485
- Cappellari et al. (2013) Cappellari, M., Scott, N., Alatalo, K., et al. 2013, MNRAS, 432, 1709
- Combes et al. (2007) Combes, F., Young, L. M., & Bureau, M. 2007, MNRAS, 377, 1795
- Compiègne et al. (2011) Compiègne, M., Verstraete, L., Jones, A., et al. 2011, A&A, 525, A103
- Cowie et al. (1996) Cowie, L. L., Songaila, A., Hu, E. M., & Cohen, J. G. 1996, AJ, 112, 839
- Crocker et al. (2012) Crocker, A., Krips, M., Bureau, M., et al. 2012, MNRAS, 421, 1298
- Crocker et al. (2011) Crocker, A. F., Bureau, M., Young, L. M., & Combes, F. 2011, MNRAS, 410, 1197
- Cutri et al. (2013) Cutri, R. M., Wright, E. L., Conrow, T., et al. 2013, Explanatory Supplement to the AllWISE Data Release Products, Tech. rep.
- Dale et al. (2012) Dale, D. A., Aniano, G., Engelbracht, C. W., et al. 2012, ApJ, 745, 95
- Davé et al. (2011) Davé, R., Oppenheimer, B. D., & Finlator, K. 2011, MNRAS, 415, 11
- Davis et al. (2013) Davis, T. A., Alatalo, K., Bureau, M., et al. 2013, MNRAS, 429, 534
- Davis et al. (2011) Davis, T. A., Alatalo, K., Sarzi, M., et al. 2011, MNRAS, 417, 882
- Davis et al. (2014) Davis, T. A., Young, L. M., Crocker, A. F., et al. 2014, MNRAS, 444, 3427
- de Zeeuw et al. (2002) de Zeeuw, P. T., Bureau, M., Emsellem, E., et al. 2002, MNRAS, 329, 513
- di Serego Alighieri et al. (2013) di Serego Alighieri, S., Bianchi, S., Pappalardo, C., et al. 2013, A&A, 552, A8
- Doi et al. (2015) Doi, Y., Takita, S., Ootsubo, T., et al. 2015, PASJ, 67, 50
- Draine & Li (2007) Draine, B. T. & Li, A. 2007, ApJ, 657, 810
- Draine & Salpeter (1979) Draine, B. T. & Salpeter, E. E. 1979, ApJ, 231, 77
- Elbaz et al. (2007) Elbaz, D., Daddi, E., Le Borgne, D., et al. 2007, A&A, 468, 33
- Emsellem et al. (2011) Emsellem, E., Cappellari, M., Krajnović, D., et al. 2011, MNRAS, 414, 888
- Faber & Gallagher (1976) Faber, S. M. & Gallagher, J. S. 1976, ApJ, 204, 365
- Forman et al. (1985) Forman, W., Jones, C., & Tucker, W. 1985, ApJ, 293, 102
- Galametz et al. (2012) Galametz, M., Kennicutt, R. C., Albrecht, M., et al. 2012, MNRAS, 425, 763
- Gao & Solomon (2004) Gao, Y. & Solomon, P. M. 2004, ApJS, 152, 63
- Goudfrooij & de Jong (1995) Goudfrooij, P. & de Jong, T. 1995, A&A, 298, 784
- Griffith et al. (2015) Griffith, R. L., Wright, J. T., Maldonado, J., et al. 2015, ApJS, 217, 25
- Guillard et al. (2015) Guillard, P., Boulanger, F., Lehnert, M. D., et al. 2015, A&A, 574, A32
- Gunawardhana et al. (2011) Gunawardhana, M. L. P., Hopkins, A. M., Sharp, R. G., et al. 2011, MNRAS, 415, 1647
- Hao et al. (2011) Hao, C.-N., Kennicutt, R. C., Johnson, B. D., et al. 2011, ApJ, 741, 124
- Hattori et al. (2016) Hattori, Y., Kaneda, H., Ishihara, D., et al. 2016, PASJ, 68, 37
- Hirashita et al. (2015) Hirashita, H., Nozawa, T., Villaume, A., & Srinivasan, S. 2015, MNRAS, 454, 1620
- Hoversten & Glazebrook (2008) Hoversten, E. A. & Glazebrook, K. 2008, ApJ, 675, 163
- Ishihara et al. (2010) Ishihara, D., Onaka, T., Kataza, H., et al. 2010, A&A, 514, A1
- Kaneda et al. (2011) Kaneda, H., Ishihara, D., Onaka, T., et al. 2011, PASJ, 63, 601
- Kaneda et al. (2005) Kaneda, H., Onaka, T., & Sakon, I. 2005, ApJ, 632, L83
- Kaneda et al. (2008) Kaneda, H., Onaka, T., Sakon, I., et al. 2008, ApJ, 684, 270
- Kawada et al. (2007) Kawada, M., Baba, H., Barthel, P. D., et al. 2007, PASJ, 59, S389
- Kennicutt (1998) Kennicutt, Jr., R. C. 1998, ApJ, 498, 541
- Knapp et al. (1989) Knapp, G. R., Guhathakurta, P., Kim, D.-W., & Jura, M. A. 1989, ApJS, 70, 329
- Knapp & Rupen (1996) Knapp, G. R. & Rupen, M. P. 1996, ApJ, 460, 271
- Knapp et al. (1985) Knapp, G. R., Turner, E. L., & Cunniffe, P. E. 1985, AJ, 90, 454
- Kondo et al. (2016) Kondo, T., Ishihara, D., Kaneda, H., et al. 2016, AJ, 151, 71
- Krajnović et al. (2013a) Krajnović, D., Alatalo, K., Blitz, L., et al. 2013a, MNRAS, 432, 1768
- Krajnović et al. (2011) Krajnović, D., Emsellem, E., Cappellari, M., et al. 2011, MNRAS, 414, 2923
- Krajnović et al. (2013b) Krajnović, D., Karick, A. M., Davies, R. L., et al. 2013b, MNRAS, 433, 2812
- Lanz et al. (2016) Lanz, L., Ogle, P. M., Alatalo, K., & Appleton, P. N. 2016, ApJ, 826, 29
- Makarov et al. (2014) Makarov, D., Prugniel, P., Terekhova, N., Courtois, H., & Vauglin, I. 2014, A&A, 570, A13
- Malhotra et al. (2000) Malhotra, S., Hollenbach, D., Helou, G., et al. 2000, ApJ, 543, 634
- Martig et al. (2013) Martig, M., Crocker, A. F., Bournaud, F., et al. 2013, MNRAS, 432, 1914
- Martini et al. (2013) Martini, P., Dicken, D., & Storchi-Bergmann, T. 2013, ApJ, 766, 121
- McDermid et al. (2015) McDermid, R. M., Alatalo, K., Blitz, L., et al. 2015, MNRAS, 448, 3484
- McDermid et al. (2014) McDermid, R. M., Cappellari, M., Alatalo, K., et al. 2014, ApJ, 792, L37
- Misiriotis et al. (2006) Misiriotis, A., Xilouris, E. M., Papamastorakis, J., Boumis, P., & Goudis, C. D. 2006, A&A, 459, 113
- Murakami et al. (2007) Murakami, H., Baba, H., Barthel, P., et al. 2007, PASJ, 59, S369
- Murphy et al. (2011) Murphy, E. J., Condon, J. J., Schinnerer, E., et al. 2011, ApJ, 737, 67
- Nesvadba et al. (2011) Nesvadba, N. P. H., Boulanger, F., Lehnert, M. D., Guillard, P., & Salome, P. 2011, A&A, 536, L5
- Nyland et al. (2013) Nyland, K., Alatalo, K., Wrobel, J. M., et al. 2013, ApJ, 779, 173
- Nyland et al. (2017) Nyland, K., Young, L. M., Wrobel, J. M., et al. 2017, MNRAS, 464, 1029
- Nyland et al. (2016) Nyland, K., Young, L. M., Wrobel, J. M., et al. 2016, MNRAS, 458, 2221
- Onaka et al. (2007) Onaka, T., Matsuhara, H., Wada, T., et al. 2007, PASJ, 59, S401
- Panuzzo et al. (2011) Panuzzo, P., Rampazzo, R., Bressan, A., et al. 2011, A&A, 528, A10
- Peeters et al. (2004) Peeters, E., Spoon, H. W. W., & Tielens, A. G. G. M. 2004, ApJ, 613, 986
- Rampazzo et al. (2013) Rampazzo, R., Panuzzo, P., Vega, O., et al. 2013, MNRAS, 432, 374
- Saintonge et al. (2016) Saintonge, A., Catinella, B., Cortese, L., et al. 2016, MNRAS, 462, 1749
- Saintonge et al. (2011) Saintonge, A., Kauffmann, G., Kramer, C., et al. 2011, MNRAS, 415, 32
- Schawinski et al. (2006) Schawinski, K., Khochfar, S., Kaviraj, S., et al. 2006, Nature, 442, 888
- Scott et al. (2013) Scott, N., Cappellari, M., Davies, R. L., et al. 2013, MNRAS, 432, 1894
- Serra et al. (2012) Serra, P., Oosterloo, T., Morganti, R., et al. 2012, MNRAS, 422, 1835
- Shapiro et al. (2010) Shapiro, K. L., Falcón-Barroso, J., van de Ven, G., et al. 2010, MNRAS, 402, 2140
- Shipley et al. (2016) Shipley, H. V., Papovich, C., Rieke, G. H., Brown, M. J. I., & Moustakas, J. 2016, ApJ, 818, 60
- Skrutskie et al. (2006) Skrutskie, M. F., Cutri, R. M., Stiening, R., et al. 2006, AJ, 131, 1163
- Smith et al. (2007) Smith, J. D. T., Draine, B. T., Dale, D. A., et al. 2007, ApJ, 656, 770
- Smith et al. (2012) Smith, M. W. L., Gomez, H. L., Eales, S. A., et al. 2012, ApJ, 748, 123
- Suzuki et al. (2010) Suzuki, T., Kaneda, H., Onaka, T., Nakagawa, T., & Shibai, H. 2010, A&A, 521, A48
- Takita et al. (2015) Takita, S., Doi, Y., Ootsubo, T., et al. 2015, PASJ, 67, 51
- Taniguchi & Ohyama (1998) Taniguchi, Y. & Ohyama, Y. 1998, ApJ, 509, L89
- Temi et al. (2007) Temi, P., Brighenti, F., & Mathews, W. G. 2007, ApJ, 660, 1215
- Temi et al. (2009) Temi, P., Brighenti, F., & Mathews, W. G. 2009, ApJ, 695, 1
- Temi et al. (2003) Temi, P., Mathews, W. G., Brighenti, F., & Bregman, J. D. 2003, ApJ, 585, L121
- Thomas et al. (2010) Thomas, D., Maraston, C., Schawinski, K., Sarzi, M., & Silk, J. 2010, MNRAS, 404, 1775
- van Dokkum & Conroy (2010) van Dokkum, P. G. & Conroy, C. 2010, Nature, 468, 940
- Wardle & Knapp (1986) Wardle, M. & Knapp, G. R. 1986, AJ, 91, 23
- Williams et al. (2010) Williams, M. J., Bureau, M., & Cappellari, M. 2010, MNRAS, 409, 1330
- Yi et al. (1997) Yi, S., Demarque, P., & Oemler, Jr., A. 1997, ApJ, 486, 201
- Young et al. (2008) Young, L. M., Bureau, M., & Cappellari, M. 2008, ApJ, 676, 317
- Young et al. (2011) Young, L. M., Bureau, M., Davis, T. A., et al. 2011, MNRAS, 414, 940
Appendix A AKARI-measured infrared fluxes of all ATLAS3D galaxies, and infrared luminosities derived from SED fitting
1]
| Galaxy | m | m | m | m | m |
|---|---|---|---|---|---|
| (mJy) | (mJy) | (mJy) | (mJy) | (mJy) | |
| IC0560 | 22.09 7.24 | -2.74 14.81 | 126.86 287.93 | 300.85 92.04 | 919.98 353.35 |
| IC0598 | 16.27 5.93 | 4.54 10.00 | …b𝑏bb𝑏bMeasurement likely affected by source confusion or instrumental artefact. | 239.78 52.23 | 201.10 71.05 |
| IC0676 | 155.91 12.00 | 411.10 24.43 | 2258.15 263.38 | 3393.55 63.18 | 2304.91 77.22 |
| IC0719 | 91.47 7.36 | 51.06 11.60 | 813.76 252.97 | 2046.74 56.34 | 2123.08 285.24 |
| IC0782 | 1.53 14.34 | 5.56 17.69 | …b𝑏bb𝑏bMeasurement likely affected by source confusion or instrumental artefact. | 318.52 60.95 | -188.17 196.01 |
| IC1024 | 178.18 6.49 | 250.94 13.47 | 2126.95 251.55 | 5800.14 82.25 | 7864.90 183.53 |
| IC3631 | 2.84 9.25 | -6.92 14.09 | -179.53 343.00 | -24.24 108.04 | -91.55 75.64 |
| NGC0448 | 26.17 5.64 | 7.05 11.66 | -498.32 358.69 | 19.37 71.52 | …b𝑏bb𝑏bMeasurement likely affected by source confusion or instrumental artefact. |
| NGC0474 | -1.21 15.88 | 9.53 27.07 | …b𝑏bb𝑏bMeasurement likely affected by source confusion or instrumental artefact. | 2.84 110.22 | 333.20 252.83 |
| NGC0502 | -5.54 7.61 | 6.43 12.95 | -88.41 235.77 | 10.15 67.55 | …b𝑏bb𝑏bMeasurement likely affected by source confusion or instrumental artefact. |
| NGC0509 | 1.91 11.29 | 4.35 18.11 | …b𝑏bb𝑏bMeasurement likely affected by source confusion or instrumental artefact. | -28.15 56.44 | 86.19 224.23 |
| NGC0516 | 4.89 7.87 | -1.65 13.02 | -94.96 350.71 | 249.47 76.43 | -64.69 303.49 |
| NGC0524 | 64.88 20.75 | 70.81 41.79 | 696.44 458.18 | 1851.18 100.11 | 3048.60 352.18 |
| NGC0525 | 11.56 9.05 | -5.95 22.19 | -305.74 440.70 | -31.31 95.30 | -1062.66 588.40 |
| NGC0661 | 7.40 9.08 | 9.95 9.67 | -111.75 304.05 | 380.90 80.95 | -260.70 190.48 |
| NGC0680 | 4.68 8.38 | 21.22 13.66 | …b𝑏bb𝑏bMeasurement likely affected by source confusion or instrumental artefact. | 202.88 82.63 | 376.06 220.11 |
| NGC0770 | 5.20 7.36 | -10.05 11.09 | …b𝑏bb𝑏bMeasurement likely affected by source confusion or instrumental artefact. | …b𝑏bb𝑏bMeasurement likely affected by source confusion or instrumental artefact. | …b𝑏bb𝑏bMeasurement likely affected by source confusion or instrumental artefact. |
| NGC0821 | 65.18 14.52 | 76.42 23.71 | 303.32 240.86 | 208.02 87.63 | -257.83 361.71 |
| NGC0936 | 55.82 30.99 | -6.19 51.90 | …b𝑏bb𝑏bMeasurement likely affected by source confusion or instrumental artefact. | 435.32 69.74 | -171.50 137.64 |
| NGC1023 | 150.16 24.37 | 109.60 45.00 | 182.60 250.56 | 74.13 64.71 | -77.92 132.30 |
| NGC1121 | 17.73 6.05 | -16.98 9.58 | 177.91 239.43 | 3.35 77.73 | …b𝑏bb𝑏bMeasurement likely affected by source confusion or instrumental artefact. |
| NGC1222 | 353.33 8.04 | 1064.58 14.04 | 11289.63 344.26 | 12613.37 94.35 | 9493.47 185.41 |
| NGC1248 | 19.65 10.28 | 18.16 15.94 | -281.98 221.96 | 140.14 80.13 | 56.11 176.81 |
| NGC1266 | 84.42 10.53 | 333.47 18.08 | 11714.22 393.10 | 13428.99 116.75 | 11092.29 308.04 |
| NGC1289 | 13.39 8.41 | 13.35 24.69 | 319.36 305.82 | 723.11 90.96 | 807.54 192.19 |
| NGC1665 | 15.13 18.88 | -15.89 36.33 | …b𝑏bb𝑏bMeasurement likely affected by source confusion or instrumental artefact. | -169.08 91.80 | -134.52 296.68 |
| NGC2481 | 11.28 6.91 | 28.88 16.13 | …b𝑏bb𝑏bMeasurement likely affected by source confusion or instrumental artefact. | …b𝑏bb𝑏bMeasurement likely affected by source confusion or instrumental artefact. | …b𝑏bb𝑏bMeasurement likely affected by source confusion or instrumental artefact. |
| NGC2549 | 60.39 11.36 | 33.45 30.52 | …b𝑏bb𝑏bMeasurement likely affected by source confusion or instrumental artefact. | -13.90 70.67 | -84.19 253.56 |
| NGC2577 | 7.55 10.62 | -19.56 27.88 | 160.00 36.00a𝑎aa𝑎aNot observed with AKARI. When possible, the missing and/or m flux densities are replaced by IRAS and/or m measurements from NED. | 1250.00 193.00a𝑎aa𝑎aNot observed with AKARI. When possible, the missing and/or m flux densities are replaced by IRAS and/or m measurements from NED. | …a𝑎aa𝑎aNot observed with AKARI. When possible, the missing and/or m flux densities are replaced by IRAS and/or m measurements from NED. |
| NGC2592 | 29.13 17.87 | 37.73 24.79 | -118.57 548.53 | -67.72 89.59 | -84.68 296.58 |
| NGC2594 | …a𝑎aa𝑎aNot observed with AKARI. When possible, the missing and/or m flux densities are replaced by IRAS and/or m measurements from NED. | -25.05 13.64 | -340.62 191.10 | -95.55 44.75 | -85.23 171.77 |
| NGC2679 | 15.89 11.67 | 23.98 27.67 | -24.28 234.12 | 208.46 60.79 | 181.79 136.02 |
| NGC2685 | 66.02 10.20 | 37.36 19.71 | …b𝑏bb𝑏bMeasurement likely affected by source confusion or instrumental artefact. | 842.64 42.91 | 2239.30 134.75 |
| NGC2695 | -0.83 9.45 | 26.57 15.87 | …b𝑏bb𝑏bMeasurement likely affected by source confusion or instrumental artefact. | -272.73 108.70 | 155.48 156.47 |
| NGC2698 | 44.28 7.84 | -23.48 10.46 | …b𝑏bb𝑏bMeasurement likely affected by source confusion or instrumental artefact. | 367.39 49.86 | …b𝑏bb𝑏bMeasurement likely affected by source confusion or instrumental artefact. |
| NGC2699 | 18.44 6.91 | -3.51 10.35 | 79.44 203.29 | 71.41 73.37 | 54.61 99.46 |
| NGC2764 | 227.43 7.65 | 301.78 26.45 | 2779.17 238.58 | 5762.03 64.86 | 6479.78 288.04 |
| NGC2768 | 67.96 48.13 | 48.16 59.93 | 472.80 565.93 | 458.41 103.67 | 747.48 420.77 |
| NGC2778 | 20.26 8.38 | 16.18 16.24 | -337.31 147.70 | 456.60 71.52 | 244.53 115.49 |
| NGC2824 | 40.39 6.58 | 64.77 10.75 | 630.64 309.26 | 1564.48 52.88 | 1016.50 152.58 |
| NGC2852 | -4.30 6.51 | 2.34 9.45 | -211.10 210.08 | 33.60 53.46 | …b𝑏bb𝑏bMeasurement likely affected by source confusion or instrumental artefact. |
| NGC2859 | 69.67 11.30 | 4.21 20.47 | 468.12 226.05 | 660.07 54.60 | 363.20 142.21 |
| NGC2880 | 34.21 13.46 | 39.99 32.41 | 91.33 329.26 | 192.11 55.95 | 450.83 117.29 |
| NGC2950 | 58.73 10.41 | -1.27 15.37 | 6.39 204.51 | 82.08 39.25 | 158.41 86.79 |
| NGC2962 | 11.63 13.54 | 38.78 20.52 | 150.09 296.85 | 495.39 64.40 | 1671.71 212.41 |
| NGC2974 | 98.46 25.19 | 65.77 37.19 | 365.99 330.64 | 1083.13 80.70 | 2380.69 222.63 |
| NGC3032 | 89.03 12.02 | 158.63 15.81 | 1310.93 306.98 | 3533.09 76.29 | 1583.76 82.02 |
| NGC3073 | -7.47 15.59 | -4.61 23.95 | 234.57 196.62 | 18.41 52.96 | 242.43 121.60 |
| NGC3098 | 18.79 6.83 | 9.31 16.04 | -128.39 265.95 | -64.67 72.51 | -386.44 223.06 |
| NGC3156 | 17.76 10.31 | 37.45 20.08 | 150.44 267.86 | 446.58 75.94 | 736.41 184.56 |
| NGC3182 | 31.22 8.40 | 41.56 16.77 | 4.97 150.11 | 508.17 45.96 | 278.92 77.41 |
| NGC3193 | 69.13 15.99 | -3.75 22.51 | -142.28 232.99 | 64.48 69.28 | -102.89 156.10 |
| NGC3226 | 41.28 18.34 | 2.05 23.65 | …b𝑏bb𝑏bMeasurement likely affected by source confusion or instrumental artefact. | …b𝑏bb𝑏bMeasurement likely affected by source confusion or instrumental artefact. | …b𝑏bb𝑏bMeasurement likely affected by source confusion or instrumental artefact. |
| NGC3230 | 31.58 11.21 | -16.50 17.92 | 161.04 279.60 | 205.44 54.95 | -212.26 144.72 |
| NGC3245 | 60.19 13.59 | 153.32 22.68 | 1307.80 233.28 | 3225.60 66.75 | 1824.74 142.60 |
| NGC3248 | 14.60 8.83 | 14.54 12.84 | -356.26 282.41 | -86.67 58.23 | -255.13 185.92 |
| NGC3301 | 66.18 12.31 | 21.17 19.14 | 497.52 323.36 | 758.28 79.16 | 1807.68 242.41 |
| NGC3377 | 74.52 17.41 | 19.81 41.84 | …b𝑏bb𝑏bMeasurement likely affected by source confusion or instrumental artefact. | 55.47 69.56 | -351.97 335.52 |
| NGC3379 | 113.38 22.02 | 48.33 33.40 | -20.99 295.23 | -27.63 43.46 | 32.41 181.01 |
| NGC3384 | 112.17 19.28 | 53.66 31.71 | 262.24 249.95 | -56.07 61.97 | -17.58 150.51 |
| NGC3400 | 2.48 8.57 | -19.03 14.43 | 165.24 188.75 | 16.50 51.20 | 157.89 136.21 |
| NGC3412 | 60.58 16.48 | -8.37 26.00 | …b𝑏bb𝑏bMeasurement likely affected by source confusion or instrumental artefact. | -43.08 77.34 | -299.67 166.45 |
| NGC3414 | 36.54 14.76 | 46.61 22.24 | 577.72 246.21 | 377.99 65.90 | 1207.45 132.40 |
| NGC3457 | 21.76 6.84 | 3.63 12.42 | -242.21 316.92 | 282.71 58.22 | -113.19 175.75 |
| NGC3458 | 12.22 8.80 | -24.54 11.20 | …b𝑏bb𝑏bMeasurement likely affected by source confusion or instrumental artefact. | -164.63 61.82 | 46.80 75.84 |
| NGC3489 | 120.94 12.63 | 86.75 21.76 | 1524.15 300.91 | 2476.44 51.32 | 2195.04 110.13 |
| NGC3499 | 17.24 6.26 | 22.20 9.40 | 214.99 235.54 | 102.62 39.49 | 71.53 48.39 |
| NGC3522 | 6.86 5.46 | -16.27 17.15 | -66.55 304.41 | 149.33 65.13 | 75.15 121.77 |
| NGC3530 | 1.46 4.78 | -1.54 8.85 | 171.01 173.75 | 199.24 41.54 | -17.45 60.28 |
| NGC3595 | 14.99 8.34 | 0.10 16.07 | -302.25 409.48 | 461.52 70.59 | 83.62 224.39 |
| NGC3599 | 23.76 11.24 | -29.18 32.74 | -212.26 349.25 | 407.69 83.84 | 507.72 185.78 |
| NGC3605 | 13.94 9.77 | 7.36 18.25 | …b𝑏bb𝑏bMeasurement likely affected by source confusion or instrumental artefact. | …b𝑏bb𝑏bMeasurement likely affected by source confusion or instrumental artefact. | …b𝑏bb𝑏bMeasurement likely affected by source confusion or instrumental artefact. |
| NGC3607 | 96.58 28.11 | 42.52 41.27 | 1970.03 319.66 | 2275.15 93.75 | 3305.25 173.40 |
| NGC3608 | 62.63 17.24 | 24.39 31.76 | 304.65 415.53 | 24.04 116.47 | -162.39 263.76 |
| NGC3610 | 40.04 9.17 | 32.40 15.23 | 241.53 178.56 | 38.58 73.09 | -329.93 137.04 |
| NGC3613 | 34.39 10.93 | 12.75 17.66 | …b𝑏bb𝑏bMeasurement likely affected by source confusion or instrumental artefact. | …b𝑏bb𝑏bMeasurement likely affected by source confusion or instrumental artefact. | -75.51 56.81 |
| NGC3619 | 57.08 13.16 | 44.70 23.90 | 621.67 208.89 | 954.24 45.99 | 319.44 45.81 |
| NGC3626 | 106.73 13.16 | 148.10 21.51 | 1427.62 322.23 | 3614.93 76.39 | 3305.24 195.69 |
| NGC3630 | 29.33 6.13 | 18.21 11.69 | -486.17 385.52 | 70.68 94.08 | -274.36 649.14 |
| NGC3640 | 75.91 15.79 | 39.58 24.68 | 0.00 39.00a𝑎aa𝑎aNot observed with AKARI. When possible, the missing and/or m flux densities are replaced by IRAS and/or m measurements from NED. | 0.00 66.00a𝑎aa𝑎aNot observed with AKARI. When possible, the missing and/or m flux densities are replaced by IRAS and/or m measurements from NED. | …a𝑎aa𝑎aNot observed with AKARI. When possible, the missing and/or m flux densities are replaced by IRAS and/or m measurements from NED. |
| NGC3641 | 12.59 7.15 | -7.33 8.33 | 0.00 41.00a𝑎aa𝑎aNot observed with AKARI. When possible, the missing and/or m flux densities are replaced by IRAS and/or m measurements from NED. | 0.00 145.00a𝑎aa𝑎aNot observed with AKARI. When possible, the missing and/or m flux densities are replaced by IRAS and/or m measurements from NED. | …a𝑎aa𝑎aNot observed with AKARI. When possible, the missing and/or m flux densities are replaced by IRAS and/or m measurements from NED. |
| NGC3648 | -2.12 6.12 | -2.77 11.50 | -248.98 228.09 | 9.24 55.83 | -51.43 92.10 |
| NGC3658 | 26.84 9.49 | 0.20 17.33 | 299.10 270.26 | 276.90 64.64 | 28.78 81.13 |
| NGC3665 | 123.14 15.34 | 105.40 27.61 | 1424.53 269.55 | 3911.87 53.88 | 4241.70 101.93 |
| NGC3674 | 10.61 6.83 | 12.90 10.26 | …b𝑏bb𝑏bMeasurement likely affected by source confusion or instrumental artefact. | -60.53 47.78 | 51.25 67.70 |
| NGC3694 | 41.11 13.05 | 37.53 21.00 | 1136.62 239.63 | 922.90 64.88 | 386.33 139.64 |
| NGC3757 | 12.77 5.86 | -0.20 14.62 | -85.81 220.38 | -48.15 57.15 | 33.19 47.02 |
| NGC3796 | 17.76 8.00 | 2.28 11.15 | 9.40 145.26 | 267.71 54.24 | 213.67 44.29 |
| NGC3838 | 18.92 7.00 | 1.72 9.53 | …b𝑏bb𝑏bMeasurement likely affected by source confusion or instrumental artefact. | 221.68 44.10 | 53.72 96.65 |
| NGC3941 | 104.77 16.53 | 75.55 25.82 | 52.30 253.93 | 275.63 51.25 | 217.30 109.59 |
| NGC3945 | 34.83 15.61 | 49.96 25.73 | 759.65 210.88 | 727.79 48.57 | 602.26 87.67 |
| NGC3998 | 158.19 11.07 | 196.59 19.10 | 540.99 186.84 | 511.96 43.29 | 529.14 71.10 |
| NGC4026 | 102.73 10.62 | 9.56 16.61 | -242.10 289.05 | 24.24 41.85 | …b𝑏bb𝑏bMeasurement likely affected by source confusion or instrumental artefact. |
| NGC4036 | 58.67 13.46 | 58.43 22.67 | 990.20 219.56 | 751.14 47.57 | 192.19 73.94 |
| NGC4078 | 3.59 6.69 | 0.32 10.74 | …b𝑏bb𝑏bMeasurement likely affected by source confusion or instrumental artefact. | 177.87 57.43 | 146.94 123.39 |
| NGC4111 | 110.46 7.43 | 95.14 12.43 | 666.39 227.45 | 1596.75 69.31 | 952.24 101.19 |
| NGC4119 | 55.19 23.24 | 46.25 35.54 | -89.93 325.33 | 640.81 60.49 | 433.68 229.21 |
| NGC4143 | 68.25 11.27 | 29.97 16.41 | 249.16 177.77 | 131.20 52.08 | 227.92 65.53 |
| NGC4150 | 51.67 7.87 | 65.44 14.26 | 1651.55 215.16 | 1306.65 38.94 | 348.75 51.03 |
| NGC4168 | 14.07 15.14 | 45.68 25.48 | -153.50 394.43 | 172.51 79.93 | 714.11 238.30 |
| NGC4179 | 68.80 9.65 | -23.01 23.87 | 3.80 292.46 | -76.40 90.45 | 254.45 286.58 |
| NGC4191 | 13.93 8.99 | -7.07 14.53 | -361.04 874.08 | 75.75 98.01 | …b𝑏bb𝑏bMeasurement likely affected by source confusion or instrumental artefact. |
| NGC4203 | 82.20 18.86 | 72.01 34.46 | 849.43 263.92 | 1346.32 46.51 | 1185.25 73.59 |
| NGC4215 | 47.60 11.47 | -7.70 18.29 | -212.73 235.30 | 4.29 79.54 | -100.01 210.00 |
| NGC4233 | 14.41 9.43 | -0.20 18.41 | 190.00 37.00a𝑎aa𝑎aNot observed with AKARI. When possible, the missing and/or m flux densities are replaced by IRAS and/or m measurements from NED. | 480.00 87.00a𝑎aa𝑎aNot observed with AKARI. When possible, the missing and/or m flux densities are replaced by IRAS and/or m measurements from NED. | 2031.16 258.93 |
| NGC4249 | -1.34 8.28 | -0.09 15.29 | …b𝑏bb𝑏bMeasurement likely affected by source confusion or instrumental artefact. | -10.57 50.61 | -246.35 113.73 |
| NGC4251 | 57.91 9.93 | 14.37 20.35 | …b𝑏bb𝑏bMeasurement likely affected by source confusion or instrumental artefact. | 111.36 50.32 | -35.38 50.96 |
| NGC4255 | 16.49 7.15 | 21.46 14.15 | 300.85 293.77 | 47.75 63.10 | -144.40 206.25 |
| NGC4259 | -5.37 6.45 | 6.47 9.92 | -169.37 307.51 | 224.63 112.37 | -0.17 235.95 |
| NGC4261 | 105.98 21.02 | 66.78 35.63 | 149.26 394.04 | 214.36 92.00 | 696.73 274.96 |
| NGC4262 | 26.97 7.38 | -6.45 12.48 | -323.77 344.51 | 49.32 73.96 | 278.66 230.65 |
| NGC4264 | -1.36 8.91 | 5.19 17.40 | …b𝑏bb𝑏bMeasurement likely affected by source confusion or instrumental artefact. | 190.78 83.39 | 387.30 281.79 |
| NGC4267 | 16.00 17.83 | 63.01 34.64 | 186.13 327.11 | 57.24 89.03 | -293.79 233.19 |
| NGC4268 | 9.83 7.42 | -14.31 22.14 | 3.26 274.87 | 363.61 80.23 | 820.50 260.35 |
| NGC4270 | 15.56 9.50 | -12.06 19.92 | -196.08 233.06 | -55.59 69.06 | -99.62 130.95 |
| NGC4278 | 70.88 12.78 | 53.70 22.41 | 901.94 185.60 | 1180.53 54.73 | 687.50 70.36 |
| NGC4281 | 77.37 12.64 | 52.99 22.06 | -238.97 278.86 | 710.34 94.55 | 438.75 178.24 |
| NGC4283 | 3.52 8.11 | -12.98 20.40 | -97.64 191.36 | 149.70 57.12 | 35.86 88.89 |
| NGC4324 | 72.98 14.69 | 72.39 23.69 | -134.19 602.68 | 371.28 58.70 | 1939.36 133.50 |
| NGC4339 | 40.70 17.95 | 24.42 26.30 | -100.17 744.13 | 184.35 125.31 | -140.08 304.58 |
| NGC4340 | 20.93 16.19 | 2.36 33.60 | -177.61 288.69 | 167.86 62.21 | 5.75 183.17 |
| NGC4342 | 7.35 4.99 | 17.11 10.11 | …b𝑏bb𝑏bMeasurement likely affected by source confusion or instrumental artefact. | -39.71 59.18 | …b𝑏bb𝑏bMeasurement likely affected by source confusion or instrumental artefact. |
| NGC4346 | 19.07 9.05 | 29.31 15.51 | -208.59 251.51 | -39.95 66.84 | …b𝑏bb𝑏bMeasurement likely affected by source confusion or instrumental artefact. |
| NGC4350 | 73.49 8.96 | 44.28 14.84 | 967.73 257.05 | 753.42 52.67 | 599.41 125.48 |
| NGC4365 | 114.88 26.07 | 102.10 41.72 | -390.38 438.28 | -40.15 95.48 | 147.96 205.72 |
| NGC4371 | 53.24 19.77 | 26.15 27.33 | 0.00 47.00a𝑎aa𝑎aNot observed with AKARI. When possible, the missing and/or m flux densities are replaced by IRAS and/or m measurements from NED. | 0.00 157.00a𝑎aa𝑎aNot observed with AKARI. When possible, the missing and/or m flux densities are replaced by IRAS and/or m measurements from NED. | -252.57 268.50 |
| NGC4374 | 146.18 26.27 | 172.25 57.86 | 210.71 664.13 | 957.68 118.95 | 1084.09 203.62 |
| NGC4377 | 18.92 7.69 | -5.00 17.09 | 112.96 273.77 | 400.21 57.06 | 1423.95 209.50 |
| NGC4379 | 10.42 10.33 | 9.21 23.47 | 100.12 361.98 | 390.55 89.13 | -177.04 192.01 |
| NGC4382 | 152.32 36.25 | 131.49 65.11 | -402.94 516.92 | -95.19 115.62 | 129.85 241.12 |
| NGC4387 | 29.46 8.34 | -13.23 18.30 | -116.42 343.65 | 188.58 69.54 | -325.22 216.54 |
| NGC4406 | 133.30 42.59 | 40.16 66.70 | -424.73 766.37 | -175.19 146.50 | …b𝑏bb𝑏bMeasurement likely affected by source confusion or instrumental artefact. |
| NGC4417 | 43.59 10.84 | 34.10 19.74 | -4.33 277.55 | 429.78 82.38 | 147.98 174.78 |
| NGC4425 | 19.34 16.63 | 24.06 25.21 | -493.04 399.97 | -220.22 122.66 | -862.69 327.92 |
| NGC4429 | 152.51 23.54 | 151.71 34.28 | 1873.01 562.37 | 3467.62 111.38 | 4773.09 220.32 |
| NGC4434 | 30.14 8.20 | -18.71 19.08 | -38.95 325.27 | 117.37 81.72 | -65.32 216.26 |
| NGC4435 | 80.42 25.76 | 110.38 37.37 | 1990.00 43.00a𝑎aa𝑎aNot observed with AKARI. When possible, the missing and/or m flux densities are replaced by IRAS and/or m measurements from NED. | 2903.77 113.81 | 4137.15 238.08 |
| NGC4442 | 51.98 14.46 | 10.77 27.39 | -615.07 439.86 | -91.50 72.05 | -572.90 232.99 |
| NGC4452 | 21.14 11.25 | 17.00 16.46 | -581.27 390.31 | …b𝑏bb𝑏bMeasurement likely affected by source confusion or instrumental artefact. | -140.65 122.96 |
| NGC4458 | 14.87 10.52 | -14.78 18.09 | 0.00 34.00a𝑎aa𝑎aNot observed with AKARI. When possible, the missing and/or m flux densities are replaced by IRAS and/or m measurements from NED. | 0.00 142.00a𝑎aa𝑎aNot observed with AKARI. When possible, the missing and/or m flux densities are replaced by IRAS and/or m measurements from NED. | 100.27 260.47 |
| NGC4459 | 113.03 22.75 | 117.21 28.83 | 1870.00 66.00a𝑎aa𝑎aNot observed with AKARI. When possible, the missing and/or m flux densities are replaced by IRAS and/or m measurements from NED. | 4820.00 134.00a𝑎aa𝑎aNot observed with AKARI. When possible, the missing and/or m flux densities are replaced by IRAS and/or m measurements from NED. | 4383.07 348.11 |
| NGC4461 | 21.91 12.97 | -3.00 24.00 | 0.00 17.00a𝑎aa𝑎aNot observed with AKARI. When possible, the missing and/or m flux densities are replaced by IRAS and/or m measurements from NED. | 0.00 85.00a𝑎aa𝑎aNot observed with AKARI. When possible, the missing and/or m flux densities are replaced by IRAS and/or m measurements from NED. | -446.59 388.00 |
| NGC4472 | 241.91 41.93 | 179.83 73.48 | -55.87 412.51 | 35.78 135.63 | 90.24 191.68 |
| NGC4473 | 91.54 13.83 | -2.54 25.28 | …b𝑏bb𝑏bMeasurement likely affected by source confusion or instrumental artefact. | -299.87 177.94 | …b𝑏bb𝑏bMeasurement likely affected by source confusion or instrumental artefact. |
| NGC4474 | 23.85 12.70 | 41.36 21.55 | …b𝑏bb𝑏bMeasurement likely affected by source confusion or instrumental artefact. | -15.77 64.22 | -142.11 159.17 |
| NGC4476 | 18.18 8.20 | 30.69 14.33 | 2078.80 539.68 | 946.12 108.40 | 884.13 173.16 |
| NGC4477 | 37.97 19.35 | 38.76 32.30 | 570.00 51.00a𝑎aa𝑎aNot observed with AKARI. When possible, the missing and/or m flux densities are replaced by IRAS and/or m measurements from NED. | 1410.00 98.00a𝑎aa𝑎aNot observed with AKARI. When possible, the missing and/or m flux densities are replaced by IRAS and/or m measurements from NED. | 838.00 311.98 |
| NGC4478 | 56.41 10.11 | 25.25 19.65 | 302.94 546.84 | -163.28 150.33 | 93.09 114.23 |
| NGC4483 | 12.21 10.00 | 2.83 19.27 | -533.86 302.18 | 322.09 68.73 | 431.49 135.87 |
| NGC4486 | 188.94 34.92 | 152.94 55.81 | 493.03 402.78 | 363.37 97.78 | 295.53 184.34 |
| NGC4486A | 29.46 6.85 | -0.33 12.95 | -139.45 200.96 | 133.35 57.10 | -189.41 108.78 |
| NGC4489 | 18.20 13.29 | 8.89 19.40 | -408.35 418.32 | 147.47 88.68 | -158.61 210.81 |
| NGC4494 | 86.94 22.23 | 32.36 37.42 | -149.45 285.98 | 320.01 66.84 | 28.49 84.76 |
| NGC4503 | 41.26 19.02 | 2.15 29.03 | -18.45 558.24 | -207.32 199.74 | …b𝑏bb𝑏bMeasurement likely affected by source confusion or instrumental artefact. |
| NGC4521 | 21.24 6.93 | 24.03 11.14 | 107.26 210.10 | 422.05 48.64 | 126.09 65.61 |
| NGC4526 | 257.98 22.98 | 236.26 34.27 | 5831.36 651.64 | 9830.22 142.13 | 17367.27 220.50 |
| NGC4528 | 0.09 10.83 | 26.26 15.10 | -110.81 411.30 | 287.82 81.49 | 469.53 186.81 |
| NGC4546 | 96.69 12.58 | -1.18 38.78 | 279.24 377.19 | 517.45 82.54 | 17.78 226.18 |
| NGC4550 | 24.06 11.67 | -8.78 15.37 | -81.48 511.47 | 282.87 96.03 | -996.11 401.41 |
| NGC4551 | -14.20 17.31 | 11.15 18.29 | 329.39 512.85 | -74.65 108.47 | …b𝑏bb𝑏bMeasurement likely affected by source confusion or instrumental artefact. |
| NGC4552 | 107.71 17.95 | -0.02 41.01 | 232.93 336.62 | 367.38 66.98 | 1109.74 197.04 |
| NGC4564 | 60.57 12.41 | 19.63 16.98 | 0.00 60.00a𝑎aa𝑎aNot observed with AKARI. When possible, the missing and/or m flux densities are replaced by IRAS and/or m measurements from NED. | 0.00 190.00a𝑎aa𝑎aNot observed with AKARI. When possible, the missing and/or m flux densities are replaced by IRAS and/or m measurements from NED. | -475.01 170.92 |
| NGC4570 | 31.96 12.45 | 21.90 21.53 | -184.23 528.79 | 250.29 157.37 | 126.29 323.66 |
| NGC4578 | 21.93 15.68 | 24.57 27.69 | …b𝑏bb𝑏bMeasurement likely affected by source confusion or instrumental artefact. | 59.41 88.71 | 64.02 172.67 |
| NGC4596 | 63.86 21.78 | 74.77 33.61 | 1339.50 414.85 | 1277.59 95.16 | 506.42 204.10 |
| NGC4608 | 34.09 15.10 | 43.23 24.55 | -235.42 277.04 | -144.02 70.34 | 6.48 145.94 |
| NGC4612 | 8.32 15.14 | 8.76 21.77 | …b𝑏bb𝑏bMeasurement likely affected by source confusion or instrumental artefact. | 100.31 80.09 | -80.61 59.69 |
| NGC4621 | 64.90 27.12 | 50.73 39.48 | …b𝑏bb𝑏bMeasurement likely affected by source confusion or instrumental artefact. | 646.07 97.82 | 926.39 227.38 |
| NGC4623 | 5.40 13.56 | 16.28 16.23 | …b𝑏bb𝑏bMeasurement likely affected by source confusion or instrumental artefact. | 70.46 69.80 | -180.20 101.99 |
| NGC4624 | 44.06 24.17 | 35.60 37.87 | -106.55 488.77 | -100.16 113.49 | -300.26 239.78 |
| NGC4636 | 141.18 44.90 | 160.18 72.60 | -732.77 692.54 | 669.91 137.24 | 394.31 567.50 |
| NGC4638 | 58.60 8.79 | 17.46 16.28 | 308.55 446.42 | 46.39 114.28 | -15.83 157.12 |
| NGC4643 | 86.87 14.37 | 39.39 28.22 | …b𝑏bb𝑏bMeasurement likely affected by source confusion or instrumental artefact. | 1843.36 72.84 | 2156.65 230.65 |
| NGC4649 | 186.90 34.04 | 40.08 53.25 | …b𝑏bb𝑏bMeasurement likely affected by source confusion or instrumental artefact. | …b𝑏bb𝑏bMeasurement likely affected by source confusion or instrumental artefact. | …b𝑏bb𝑏bMeasurement likely affected by source confusion or instrumental artefact. |
| NGC4660 | 19.31 8.89 | 24.94 13.17 | 0.00 48.00a𝑎aa𝑎aNot observed with AKARI. When possible, the missing and/or m flux densities are replaced by IRAS and/or m measurements from NED. | 0.00 101.00a𝑎aa𝑎aNot observed with AKARI. When possible, the missing and/or m flux densities are replaced by IRAS and/or m measurements from NED. | -49.98 250.14 |
| NGC4684 | 68.80 14.16 | 142.39 24.65 | 852.64 416.86 | 1859.01 89.08 | 1107.51 286.47 |
| NGC4690 | 10.19 9.54 | 10.04 20.83 | 485.11 257.94 | 136.39 70.08 | 322.18 206.45 |
| NGC4694 | 99.02 18.29 | 15.58 22.89 | 1820.17 384.20 | 2533.78 67.90 | 2177.04 304.40 |
| NGC4697 | 88.96 32.32 | 106.54 50.51 | 460.00 23.00a𝑎aa𝑎aNot observed with AKARI. When possible, the missing and/or m flux densities are replaced by IRAS and/or m measurements from NED. | 1240.00 76.00a𝑎aa𝑎aNot observed with AKARI. When possible, the missing and/or m flux densities are replaced by IRAS and/or m measurements from NED. | …a𝑎aa𝑎aNot observed with AKARI. When possible, the missing and/or m flux densities are replaced by IRAS and/or m measurements from NED. |
| NGC4710 | 182.15 15.42 | 231.89 25.86 | 6201.75 424.24 | 9966.46 111.55 | 13399.18 166.79 |
| NGC4733 | 2.18 20.37 | 33.22 30.51 | …b𝑏bb𝑏bMeasurement likely affected by source confusion or instrumental artefact. | -0.67 54.49 | -40.62 121.26 |
| NGC4753 | 203.52 26.76 | 207.74 55.62 | 2570.00 59.00a𝑎aa𝑎aNot observed with AKARI. When possible, the missing and/or m flux densities are replaced by IRAS and/or m measurements from NED. | 9010.00 199.00a𝑎aa𝑎aNot observed with AKARI. When possible, the missing and/or m flux densities are replaced by IRAS and/or m measurements from NED. | …a𝑎aa𝑎aNot observed with AKARI. When possible, the missing and/or m flux densities are replaced by IRAS and/or m measurements from NED. |
| NGC4754 | 95.93 19.27 | -2.14 32.75 | …b𝑏bb𝑏bMeasurement likely affected by source confusion or instrumental artefact. | -31.45 62.43 | …b𝑏bb𝑏bMeasurement likely affected by source confusion or instrumental artefact. |
| NGC4762 | 78.81 29.44 | 47.94 43.99 | …b𝑏bb𝑏bMeasurement likely affected by source confusion or instrumental artefact. | -39.04 74.47 | -67.60 114.70 |
| NGC4803 | 5.36 5.56 | 2.39 11.07 | 478.41 252.15 | 154.26 51.59 | 300.41 163.57 |
| NGC5103 | 3.47 7.63 | -13.38 21.17 | -247.56 161.41 | 6.83 41.27 | 48.20 72.68 |
| NGC5173 | 52.33 12.76 | 15.42 10.61 | 354.56 233.77 | 394.61 50.30 | 275.97 94.04 |
| NGC5198 | 33.05 11.55 | 24.53 17.27 | 161.88 219.07 | -56.73 55.97 | -136.02 84.69 |
| NGC5273 | 73.00 23.46 | 20.74 33.49 | 378.69 355.52 | 995.61 72.55 | 285.04 138.58 |
| NGC5308 | 47.24 7.89 | 12.72 10.76 | -48.60 135.83 | 150.77 42.65 | -21.90 81.27 |
| NGC5322 | 46.06 21.59 | 37.92 34.19 | 1140.44 232.14 | 692.98 50.26 | 388.85 84.81 |
| NGC5342 | 7.68 4.86 | 0.02 10.10 | -50.72 151.49 | -80.12 65.28 | …b𝑏bb𝑏bMeasurement likely affected by source confusion or instrumental artefact. |
| NGC5353 | 40.17 11.97 | 33.71 21.09 | 434.73 349.67 | 898.18 76.47 | 734.66 106.89 |
| NGC5355 | 12.21 6.62 | -21.36 22.15 | …b𝑏bb𝑏bMeasurement likely affected by source confusion or instrumental artefact. | -6.63 55.01 | 174.74 116.72 |
| NGC5358 | 2.82 7.67 | -9.05 13.51 | …b𝑏bb𝑏bMeasurement likely affected by source confusion or instrumental artefact. | 224.50 59.60 | -44.54 85.97 |
| NGC5379 | 15.28 9.59 | 1.62 17.18 | 301.90 407.09 | 208.95 73.91 | 294.10 127.16 |
| NGC5422 | 16.62 8.12 | 28.72 16.12 | -288.41 191.45 | 60.69 44.72 | 390.89 90.10 |
| NGC5473 | 7.35 11.50 | 21.20 14.44 | …b𝑏bb𝑏bMeasurement likely affected by source confusion or instrumental artefact. | 99.94 46.76 | 250.44 92.66 |
| NGC5475 | 16.62 8.49 | 16.58 12.57 | -197.43 120.18 | 83.20 39.95 | 302.00 80.72 |
| NGC5481 | 23.64 11.53 | 7.11 15.38 | …b𝑏bb𝑏bMeasurement likely affected by source confusion or instrumental artefact. | …b𝑏bb𝑏bMeasurement likely affected by source confusion or instrumental artefact. | …b𝑏bb𝑏bMeasurement likely affected by source confusion or instrumental artefact. |
| NGC5485 | 52.86 13.13 | -7.30 25.52 | 20.03 191.84 | 532.89 45.33 | 314.45 58.25 |
| NGC5493 | 22.71 8.18 | 18.27 13.11 | …b𝑏bb𝑏bMeasurement likely affected by source confusion or instrumental artefact. | 106.42 91.99 | -219.93 204.90 |
| NGC5500 | 3.18 8.75 | -7.24 14.02 | …b𝑏bb𝑏bMeasurement likely affected by source confusion or instrumental artefact. | -7.92 32.22 | 42.82 72.80 |
| NGC5507 | 26.96 8.02 | -35.56 19.09 | …b𝑏bb𝑏bMeasurement likely affected by source confusion or instrumental artefact. | -61.91 52.65 | …b𝑏bb𝑏bMeasurement likely affected by source confusion or instrumental artefact. |
| NGC5557 | 41.09 17.19 | 36.40 20.46 | …b𝑏bb𝑏bMeasurement likely affected by source confusion or instrumental artefact. | -51.54 36.16 | -88.11 32.44 |
| NGC5574 | 16.48 10.05 | 23.60 14.12 | -54.16 205.81 | -131.17 60.17 | 142.58 154.36 |
| NGC5576 | 27.99 14.05 | 8.18 21.79 | -277.59 257.24 | 114.46 55.48 | 284.84 162.34 |
| NGC5582 | 22.45 11.44 | 13.43 15.49 | -182.72 210.41 | 63.70 46.92 | -12.90 119.25 |
| NGC5611 | -14.97 6.31 | -0.04 9.48 | 125.85 161.71 | 69.57 40.86 | 75.65 58.20 |
| NGC5631 | 34.83 9.27 | 27.41 14.23 | 664.72 157.96 | 450.02 44.79 | 583.97 90.38 |
| NGC5638 | 19.56 14.02 | 43.75 23.75 | -119.06 243.23 | 123.18 60.60 | 425.75 112.82 |
| NGC5687 | 8.58 11.42 | 6.48 19.53 | 112.92 188.29 | -36.27 63.11 | -78.68 84.16 |
| NGC5770 | 20.06 9.83 | -1.42 16.23 | -216.51 220.83 | 8.83 42.14 | -167.82 81.32 |
| NGC5813 | 26.36 24.20 | -38.93 46.55 | -341.86 292.25 | 303.15 105.28 | 527.34 391.56 |
| NGC5831 | 10.24 12.77 | -0.70 23.52 | 216.68 284.05 | 130.87 61.23 | 534.75 180.20 |
| NGC5838 | 94.72 14.23 | 74.35 21.71 | 286.10 396.65 | 1456.09 57.23 | 1454.12 150.54 |
| NGC5839 | 29.55 9.96 | -0.24 15.49 | 70.09 212.18 | 89.23 52.56 | 110.80 131.97 |
| NGC5845 | 31.72 4.92 | 18.33 9.29 | -105.88 193.96 | -35.86 58.01 | 162.42 209.18 |
| NGC5846 | 61.83 24.82 | 22.87 41.81 | …b𝑏bb𝑏bMeasurement likely affected by source confusion or instrumental artefact. | 263.42 101.10 | 279.20 281.01 |
| NGC5854 | 28.23 10.67 | 28.17 17.92 | -280.27 321.48 | 150.61 83.17 | 487.45 166.18 |
| NGC5864 | -1.53 13.82 | 12.23 19.73 | -255.83 284.09 | -71.18 89.99 | 19.17 133.75 |
| NGC5866 | 247.44 15.23 | 220.79 18.70 | 4573.14 231.09 | 9188.32 63.58 | 16097.43 97.72 |
| NGC5869 | 33.70 9.36 | -1.64 20.76 | …b𝑏bb𝑏bMeasurement likely affected by source confusion or instrumental artefact. | -26.85 55.05 | -530.31 276.70 |
| NGC6010 | 16.40 8.08 | 13.35 12.59 | -498.45 310.18 | -126.90 72.46 | 121.03 234.77 |
| NGC6014 | 32.86 11.84 | 86.45 21.39 | 1150.65 214.66 | 1510.87 55.20 | 1860.82 131.97 |
| NGC6017 | 20.01 5.73 | 24.47 8.95 | -1.68 257.38 | 205.26 74.45 | 923.82 166.59 |
| NGC6149 | 14.93 5.97 | -9.64 16.95 | -19.44 173.33 | 348.69 49.72 | 117.30 143.58 |
| NGC6278 | 26.75 9.29 | 6.97 15.92 | …b𝑏bb𝑏bMeasurement likely affected by source confusion or instrumental artefact. | 297.77 53.72 | 377.40 126.89 |
| NGC6547 | 13.14 6.92 | -18.76 21.64 | -241.07 301.53 | 228.20 76.26 | -152.64 261.41 |
| NGC6548 | 10.23 13.42 | 32.97 20.56 | -61.13 154.50 | -46.67 78.66 | -162.35 206.26 |
| NGC6703 | 49.16 8.75 | -6.75 16.33 | -31.14 161.19 | 193.97 52.73 | -840.04 469.52 |
| NGC6798 | 13.11 6.40 | 4.92 11.57 | -187.04 109.85 | 35.84 57.60 | 50.47 281.29 |
| NGC7280 | 23.13 12.90 | 15.20 17.56 | 82.76 190.65 | 149.60 64.97 | 144.04 81.36 |
| NGC7332 | 21.68 10.26 | 20.75 14.83 | 257.81 152.79 | 55.37 82.16 | 310.47 74.44 |
| NGC7454 | 0.82 13.10 | 3.82 23.14 | …b𝑏bb𝑏bMeasurement likely affected by source confusion or instrumental artefact. | 97.14 57.51 | 66.64 176.45 |
| NGC7457 | 54.97 18.49 | 20.51 32.74 | -245.86 236.09 | 32.91 45.43 | 94.83 121.33 |
| NGC7465 | 184.93 6.03 | 243.18 9.17 | 2076.94 196.93 | 6169.73 65.99 | 6094.62 194.56 |
| NGC7693 | -5.90 7.65 | -13.63 22.58 | …b𝑏bb𝑏bMeasurement likely affected by source confusion or instrumental artefact. | 151.03 63.74 | 387.38 278.60 |
| NGC7710 | 5.85 5.12 | -11.45 11.78 | -74.10 283.14 | 108.80 68.36 | 580.37 281.26 |
| PGC016060 | 19.29 9.17 | 13.90 9.93 | -55.66 308.03 | 1064.04 69.06 | 982.56 248.02 |
| PGC028887 | 8.56 8.68 | -8.96 15.90 | -332.74 265.98 | 213.40 56.91 | 264.66 253.68 |
| PGC029321 | 63.74 5.01 | 227.68 10.09 | 1083.73 307.99 | 1097.12 65.28 | 1156.41 238.88 |
| PGC035754 | 4.19 3.95 | -6.10 10.61 | …b𝑏bb𝑏bMeasurement likely affected by source confusion or instrumental artefact. | -20.85 41.12 | -33.91 79.34 |
| PGC042549 | -2.21 7.01 | -29.53 24.42 | …a𝑎aa𝑎aNot observed with AKARI. When possible, the missing and/or m flux densities are replaced by IRAS and/or m measurements from NED. | …a𝑎aa𝑎aNot observed with AKARI. When possible, the missing and/or m flux densities are replaced by IRAS and/or m measurements from NED. | …a𝑎aa𝑎aNot observed with AKARI. When possible, the missing and/or m flux densities are replaced by IRAS and/or m measurements from NED. |
| PGC044433 | 2.41 6.00 | -1.38 10.35 | -236.57 292.85 | -37.56 73.37 | 39.97 190.85 |
| PGC050395 | 8.44 5.40 | -4.19 11.49 | …b𝑏bb𝑏bMeasurement likely affected by source confusion or instrumental artefact. | 6.84 45.90 | 97.04 64.02 |
| PGC051753 | 2.14 5.70 | -9.57 9.72 | -208.24 240.44 | 30.94 61.57 | 49.97 100.88 |
| PGC054452 | 12.23 7.99 | -0.34 12.43 | 71.71 216.15 | 255.98 63.11 | 22.32 59.05 |
| PGC056772 | 21.14 7.11 | 71.15 9.05 | 1489.64 246.96 | 1246.73 58.33 | 804.77 190.37 |
| PGC058114 | 106.79 8.09 | 305.10 10.59 | 2455.07 229.21 | 4007.11 64.68 | 2999.71 258.96 |
| PGC061468 | 23.62 6.70 | 7.49 14.56 | 249.49 230.55 | 292.99 56.56 | 607.21 184.07 |
| PGC071531 | 1.01 5.40 | -0.38 8.13 | -331.86 230.12 | -87.59 77.01 | -100.15 245.86 |
| PGC170172 | -18.63 9.12 | -6.40 14.42 | -391.44 392.59 | -174.39 100.36 | -122.34 249.03 |
| UGC03960 | 13.43 9.07 | -17.13 15.85 | 150.69 355.43 | 134.69 73.76 | 585.08 287.11 |
| UGC04551 | 18.19 7.09 | -20.98 15.97 | -216.83 229.21 | 63.44 53.40 | 302.48 136.38 |
| UGC05408 | …a𝑎aa𝑎aNot observed with AKARI. When possible, the missing and/or m flux densities are replaced by IRAS and/or m measurements from NED. | 108.44 11.86 | 957.89 233.95 | 1244.20 50.19 | 656.04 89.95 |
| UGC06062 | 10.90 6.59 | 11.28 11.08 | -282.66 305.20 | -1.47 58.69 | -419.98 151.66 |
| UGC06176 | 68.53 6.14 | 118.46 10.68 | 1462.14 368.35 | 1947.63 76.50 | 1454.00 169.94 |
| UGC08876 | 2.75 4.84 | 3.65 10.24 | -141.39 231.93 | 113.92 58.65 | 328.51 125.43 |
| UGC09519 | 27.78 5.87 | 28.14 7.75 | 438.62 169.53 | 583.64 29.93 | 124.76 47.40 |
2]
| Galaxy | |||
|---|---|---|---|
| () | () | () | |
| IC0560 | 2.88 1.09 | 2.53 0.96 | 9.77 3.31 |
| IC0598 | 1.79 1.09 | 1.82 0.78 | 11.94 3.22 |
| IC0676 | 44.56 5.63 | 91.41 10.81 | 77.84 13.03 |
| IC0719 | 32.99 4.25 | 14.69 4.17 | 71.24 12.51 |
| IC0782 | 0.11 0.41 | 0.26 0.50 | 13.65 4.53 |
| IC1024 | 48.60 5.25 | 32.64 4.10 | 152.36 22.71 |
| IC3631 | 1.07 0.80 | 1.40 0.85 | 0.00 5.04 |
| NGC0448 | 2.81 1.30 | 0.52 0.59 | 0.34 2.61 |
| NGC0474 | 0.00 2.26 | 1.25 0.78 | 1.58 4.16 |
| NGC0502 | 0.00 0.78 | 0.25 0.27 | 0.33 3.63 |
| NGC0509 | 0.86 0.63 | 1.16 0.53 | 0.00 2.42 |
| NGC0516 | 0.74 0.72 | 0.13 0.44 | 11.01 4.40 |
| NGC0524 | 3.33 4.89 | 9.06 3.41 | 47.74 9.13 |
| NGC0525 | 0.00 0.32 | 0.49 0.30 | 0.00 3.74 |
| NGC0661 | 1.38 1.61 | 0.85 0.64 | 9.69 3.89 |
| NGC0680 | 0.00 2.76 | 2.57 1.02 | 12.75 5.19 |
| NGC1023 | 0.00 1.60 | 2.60 0.95 | 0.07 0.31 |
| NGC1222 | 192.07 19.37 | 462.57 48.06 | 640.00 96.96 |
| NGC1248 | 1.27 1.18 | 0.99 0.60 | 4.08 2.94 |
| NGC1266 | 34.99 5.64 | 181.48 20.38 | 556.85 81.44 |
| NGC1289 | 2.27 2.02 | 1.42 0.91 | 45.43 9.67 |
| NGC1665 | 0.73 1.88 | 0.31 1.01 | 0.00 5.51 |
| NGC2549 | 1.40 0.64 | 0.82 0.36 | 0.00 0.43 |
| NGC2577 | 2.17 2.17 | 10.39 3.91 | 88.74 48.77 |
| NGC2592 | 1.04 1.12 | 0.67 0.44 | 0.00 2.27 |
| NGC2679 | 0.58 1.07 | 1.87 0.80 | 7.97 2.71 |
| NGC2685 | 6.53 1.50 | 18.54 5.32 | 17.85 8.35 |
| NGC2699 | 1.43 1.01 | 0.39 0.31 | 1.92 1.73 |
| NGC2764 | 155.91 17.86 | 82.82 12.23 | 389.60 55.73 |
| NGC2768 | 3.76 5.73 | 3.80 1.87 | 9.32 2.67 |
| NGC2824 | 22.89 5.22 | 17.47 3.42 | 98.87 17.90 |
| NGC2852 | 0.00 0.49 | 0.30 0.27 | 0.89 1.83 |
| NGC2859 | 8.46 3.18 | 1.71 1.20 | 18.21 3.62 |
| NGC2880 | 0.83 1.05 | 0.35 0.39 | 5.55 1.67 |
| NGC2950 | 1.91 0.95 | 1.00 0.55 | 0.72 0.35 |
| NGC2962 | 4.26 3.80 | 11.42 4.79 | 51.00 12.27 |
| NGC3032 | 15.85 3.19 | 12.66 1.88 | 51.51 8.61 |
| NGC3073 | 4.56 1.85 | 1.83 0.71 | 1.87 2.28 |
| NGC3098 | 1.31 0.97 | 0.69 0.52 | 0.00 1.58 |
| NGC3156 | 2.68 1.13 | 1.75 0.74 | 10.41 2.52 |
| NGC3182 | 11.51 3.83 | 6.10 1.84 | 18.99 4.21 |
| NGC3193 | 6.95 4.70 | 1.77 1.44 | 1.36 2.96 |
| NGC3230 | 6.10 4.09 | 1.93 1.62 | 10.64 4.46 |
| NGC3245 | 4.10 2.71 | 13.16 2.21 | 45.16 7.16 |
| NGC3248 | 0.69 0.74 | 0.00 0.23 | 0.00 1.49 |
| NGC3301 | 6.12 1.99 | 19.89 6.36 | 24.82 8.33 |
| NGC3377 | 0.79 0.72 | 0.85 0.40 | 0.14 0.35 |
| NGC3379 | 0.00 1.18 | 1.27 0.67 | 0.00 0.20 |
| NGC3384 | 0.91 1.17 | 1.06 0.56 | 0.00 0.31 |
| NGC3400 | 0.26 0.43 | 0.43 0.30 | 0.86 1.24 |
| NGC3412 | 0.88 0.71 | 0.25 0.28 | 0.00 0.37 |
| NGC3414 | 4.04 3.11 | 20.00 5.84 | 18.04 9.00 |
| NGC3457 | 1.16 0.57 | 0.33 0.20 | 3.54 1.25 |
| NGC3489 | 4.59 1.10 | 3.80 1.05 | 14.13 2.31 |
| NGC3499 | 3.59 1.14 | 0.82 0.35 | 2.69 1.05 |
| NGC3522 | 0.00 0.23 | 0.00 0.02 | 3.52 1.70 |
| NGC3530 | 0.03 0.42 | 0.38 0.31 | 4.07 1.70 |
| NGC3595 | 1.13 1.50 | 0.29 0.49 | 18.66 5.20 |
| NGC3599 | 2.56 1.13 | 2.31 0.88 | 6.44 1.79 |
| NGC3607 | 7.84 6.23 | 7.17 2.75 | 53.58 8.47 |
| NGC3608 | 3.27 2.14 | 1.29 0.85 | 0.01 2.23 |
| NGC3610 | 1.87 1.74 | 2.17 0.83 | 0.10 1.25 |
| NGC3613 | 2.35 3.16 | 0.86 1.19 | 0.00 2.29 |
| NGC3619 | 14.26 4.30 | 4.39 1.67 | 35.23 6.26 |
| NGC3626 | 15.81 2.97 | 16.34 3.05 | 52.54 8.79 |
| NGC3630 | 1.98 1.18 | 0.68 0.47 | 1.26 2.46 |
| NGC3640 | 8.56 4.57 | 5.05 2.34 | 0.00 1.60 |
| NGC3648 | 0.04 1.31 | 0.99 0.58 | 0.00 2.05 |
| NGC3658 | 4.90 2.47 | 2.69 1.18 | 6.75 2.64 |
| NGC3665 | 45.06 9.88 | 24.41 6.35 | 177.61 27.85 |
| NGC3674 | 0.87 1.35 | 0.00 0.47 | 0.00 1.91 |
| NGC3694 | 9.91 3.25 | 5.69 2.04 | 71.68 11.96 |
| NGC3757 | 0.32 0.49 | 0.08 0.19 | 0.00 0.81 |
| NGC3796 | 0.55 0.46 | 1.30 0.55 | 4.88 1.32 |
| NGC3838 | 0.69 0.72 | 0.29 0.25 | 4.03 1.23 |
| NGC3941 | 2.86 1.09 | 1.35 0.51 | 1.46 0.40 |
| NGC3945 | 0.98 3.45 | 18.40 6.56 | 11.99 3.72 |
| NGC3998 | 7.85 1.70 | 6.10 0.96 | 4.25 0.80 |
| NGC4026 | 3.21 0.97 | 0.52 0.47 | 0.12 0.31 |
| NGC4036 | 4.87 3.82 | 4.54 1.73 | 33.86 5.79 |
| NGC4078 | 1.55 1.50 | 1.13 0.70 | 10.43 3.73 |
| NGC4111 | 6.16 1.27 | 4.57 0.91 | 12.08 2.19 |
| NGC4119 | 4.48 1.74 | 2.84 1.03 | 6.40 1.46 |
| NGC4143 | 3.31 1.23 | 1.77 0.68 | 1.43 0.54 |
| NGC4150 | 3.27 0.78 | 2.05 0.47 | 13.65 2.10 |
| NGC4168 | 1.35 2.93 | 2.28 1.33 | 7.39 3.41 |
| NGC4179 | 3.05 1.14 | 0.00 0.37 | 0.00 1.00 |
| NGC4191 | 5.54 2.60 | 1.46 0.87 | 4.62 6.40 |
| NGC4203 | 4.05 1.88 | 5.74 1.97 | 11.37 2.14 |
| NGC4215 | 3.64 2.02 | 1.14 0.86 | 0.00 3.08 |
| NGC4233 | 3.21 3.12 | 12.77 5.08 | 28.74 12.63 |
| NGC4249 | 0.16 0.54 | 0.05 0.42 | 0.00 3.05 |
| NGC4251 | 2.88 1.68 | 1.97 0.92 | 0.46 0.59 |
| NGC4255 | 1.53 1.25 | 0.17 0.49 | 1.55 2.50 |
| NGC4259 | 0.00 0.35 | 0.17 0.10 | 9.49 6.18 |
| NGC4261 | 16.39 7.92 | 11.78 4.44 | 8.63 3.93 |
| NGC4262 | 0.43 0.63 | 0.34 0.32 | 0.56 0.71 |
| NGC4264 | 0.62 1.25 | 0.88 0.58 | 12.00 5.24 |
| NGC4267 | 0.00 1.10 | 0.79 0.47 | 0.24 0.89 |
| NGC4268 | 0.00 0.96 | 2.75 1.82 | 23.01 6.40 |
| NGC4270 | 2.10 2.35 | 0.68 0.96 | 0.00 3.23 |
| NGC4278 | 1.33 1.59 | 8.69 3.03 | 9.89 2.19 |
| NGC4281 | 12.35 3.56 | 6.60 2.32 | 13.80 3.55 |
| NGC4283 | 0.14 0.42 | 0.44 0.20 | 1.01 0.51 |
| NGC4324 | 6.65 1.67 | 2.49 0.82 | 15.54 3.66 |
| NGC4339 | 0.42 0.68 | 0.48 0.39 | 1.41 1.29 |
| NGC4340 | 0.78 1.21 | 0.61 0.48 | 1.96 0.93 |
| NGC4342 | 0.00 0.40 | 0.14 0.11 | 0.00 0.68 |
| NGC4346 | 0.00 0.64 | 0.81 0.32 | 0.00 0.54 |
| NGC4350 | 3.64 1.10 | 5.37 1.99 | 6.65 1.51 |
| NGC4365 | 2.65 5.80 | 5.65 2.57 | 0.00 2.00 |
| NGC4371 | 1.17 1.55 | 1.37 0.69 | 0.00 1.15 |
| NGC4374 | 0.00 4.59 | 6.49 2.15 | 13.86 3.04 |
| NGC4377 | 0.00 0.38 | 0.93 0.69 | 11.17 2.63 |
| NGC4379 | 0.16 0.54 | 0.19 0.19 | 2.65 1.07 |
| NGC4382 | 0.28 5.50 | 7.17 2.95 | 0.00 1.44 |
| NGC4406 | 0.00 4.98 | 3.07 1.86 | 0.00 1.79 |
| NGC4417 | 1.38 0.93 | 1.05 0.47 | 3.58 1.07 |
| NGC4425 | 0.38 0.53 | 0.15 0.22 | 0.00 1.44 |
| NGC4429 | 8.96 3.41 | 14.43 4.10 | 40.25 7.28 |
| NGC4434 | 1.11 0.79 | 0.27 0.30 | 1.90 1.66 |
| NGC4435 | 4.85 2.81 | 8.51 2.49 | 42.64 8.13 |
| NGC4458 | 0.16 0.35 | 0.08 0.18 | 0.06 0.85 |
| NGC4459 | 7.08 2.93 | 6.84 1.74 | 49.73 14.73 |
| NGC4461 | 0.10 1.08 | 0.50 0.38 | 0.00 0.50 |
| NGC4472 | 0.00 6.54 | 9.14 3.79 | 0.01 1.38 |
| NGC4474 | 0.69 0.65 | 0.49 0.26 | 0.00 0.62 |
| NGC4476 | 1.96 1.06 | 1.68 0.49 | 17.02 3.22 |
| NGC4477 | 0.00 2.02 | 2.68 1.06 | 13.30 4.33 |
| NGC4478 | 1.71 0.87 | 0.77 0.42 | 0.00 1.16 |
| NGC4483 | 0.22 0.39 | 0.38 0.41 | 4.17 1.15 |
| NGC4486 | 0.00 5.49 | 14.13 4.31 | 3.48 1.37 |
| NGC4489 | 0.14 0.30 | 0.13 0.13 | 0.92 0.86 |
| NGC4494 | 2.08 2.54 | 2.20 1.03 | 1.71 0.73 |
| NGC4503 | 0.80 1.30 | 0.83 0.50 | 0.00 2.30 |
| NGC4521 | 5.78 3.21 | 5.27 1.89 | 17.11 4.35 |
| NGC4526 | 17.10 4.43 | 13.40 2.64 | 124.33 18.35 |
| NGC4528 | 0.00 0.46 | 0.36 0.25 | 3.12 0.99 |
| NGC4546 | 3.25 1.22 | 1.79 0.79 | 2.98 0.89 |
| NGC4550 | 0.71 0.65 | 0.38 0.28 | 2.40 1.10 |
| NGC4551 | 0.01 0.53 | 0.27 0.22 | 0.00 1.19 |
| NGC4552 | 1.27 2.26 | 5.23 2.53 | 3.29 1.14 |
| NGC4564 | 1.74 1.06 | 0.67 0.48 | 0.00 1.19 |
| NGC4570 | 0.00 1.38 | 1.63 0.87 | 2.52 1.80 |
| NGC4578 | 0.40 0.81 | 0.98 0.55 | 0.61 0.89 |
| NGC4596 | 3.55 2.34 | 3.96 2.21 | 18.67 3.62 |
| NGC4608 | 0.76 1.01 | 0.45 0.44 | 0.00 0.77 |
| NGC4612 | 0.26 0.77 | 0.67 0.36 | 0.00 0.63 |
| NGC4621 | 0.00 2.40 | 1.51 0.73 | 6.64 1.53 |
| NGC4623 | 0.26 0.41 | 0.88 0.39 | 0.15 0.80 |
| NGC4624 | 1.68 2.41 | 1.64 1.11 | 0.00 1.22 |
| NGC4636 | 2.29 3.28 | 3.67 1.60 | 4.98 1.56 |
| NGC4638 | 2.45 1.02 | 0.46 0.59 | 0.36 1.19 |
| NGC4643 | 5.09 2.04 | 14.83 5.52 | 18.26 4.32 |
| NGC4660 | 0.00 0.70 | 0.95 0.36 | 0.00 0.70 |
| NGC4684 | 3.69 1.05 | 11.26 2.08 | 10.83 2.24 |
| NGC4690 | 0.43 1.06 | 0.96 0.68 | 11.07 4.87 |
| NGC4694 | 10.91 2.22 | 16.53 6.01 | 25.37 5.26 |
| NGC4710 | 18.91 3.10 | 26.39 4.21 | 120.70 17.64 |
| NGC4733 | 0.16 0.38 | 0.27 0.18 | 0.00 0.44 |
| NGC4753 | 27.18 8.51 | 19.43 4.91 | 167.56 60.22 |
| NGC4754 | 2.95 1.77 | 1.34 0.81 | 0.00 0.69 |
| NGC4762 | 4.87 4.46 | 2.18 1.86 | 0.00 1.37 |
| NGC4803 | 0.05 0.52 | 0.00 0.42 | 11.29 3.77 |
| NGC5103 | 0.30 0.67 | 0.33 0.31 | 0.22 0.83 |
| NGC5173 | 17.11 4.42 | 4.73 1.81 | 22.94 5.00 |
| NGC5198 | 3.32 3.11 | 2.00 1.20 | 0.00 3.31 |
| NGC5273 | 4.61 1.58 | 4.24 1.46 | 6.54 1.55 |
| NGC5308 | 5.87 2.80 | 1.58 1.27 | 3.89 1.82 |
| NGC5322 | 0.00 7.58 | 45.42 15.54 | 17.11 7.98 |
| NGC5353 | 2.28 6.65 | 24.23 9.08 | 40.04 9.01 |
| NGC5355 | 3.14 1.40 | 1.23 0.59 | 0.84 2.98 |
| NGC5358 | 0.00 0.36 | 0.19 0.30 | 6.83 3.46 |
| NGC5379 | 7.41 2.62 | 6.87 2.42 | 8.08 2.94 |
| NGC5422 | 1.49 2.07 | 1.68 0.87 | 2.56 1.80 |
| NGC5473 | 0.30 3.81 | 3.35 1.38 | 5.06 2.24 |
| NGC5475 | 2.08 1.37 | 1.35 0.59 | 4.05 1.75 |
| NGC5485 | 6.88 2.71 | 3.36 1.63 | 11.03 2.44 |
| NGC5493 | 4.20 4.41 | 3.66 1.77 | 3.54 5.54 |
| NGC5500 | 0.00 0.36 | 0.34 0.20 | 0.00 1.25 |
| NGC5557 | 8.30 6.82 | 3.89 2.23 | 0.00 1.96 |
| NGC5574 | 1.19 0.82 | 0.87 0.38 | 0.00 1.37 |
| NGC5576 | 0.11 2.73 | 1.83 0.99 | 2.93 1.49 |
| NGC5582 | 0.61 1.31 | 0.51 0.39 | 1.52 1.45 |
| NGC5631 | 6.55 2.75 | 26.90 7.77 | 5.22 4.59 |
| NGC5638 | 0.54 2.14 | 1.80 0.86 | 3.66 1.73 |
| NGC5687 | 0.37 1.34 | 0.98 0.55 | 0.00 1.62 |
| NGC5770 | 0.64 0.59 | 0.29 0.21 | 0.00 0.57 |
| NGC5813 | 0.00 6.44 | 4.40 2.42 | 11.24 4.77 |
| NGC5831 | 0.26 2.04 | 1.57 0.76 | 4.30 1.90 |
| NGC5838 | 9.80 3.18 | 5.55 1.75 | 28.46 5.48 |
| NGC5839 | 0.97 0.78 | 0.42 0.27 | 1.86 1.05 |
| NGC5845 | 3.22 1.11 | 0.88 0.42 | 0.00 1.63 |
| NGC5846 | 0.00 5.83 | 4.16 2.15 | 6.22 2.64 |
| NGC5854 | 1.94 1.59 | 1.82 0.77 | 4.68 2.43 |
| NGC5864 | 0.35 2.10 | 1.69 0.85 | 0.00 2.64 |
| NGC5866 | 16.42 3.10 | 7.99 1.28 | 89.87 12.55 |
| NGC5869 | 1.35 1.30 | 0.94 0.52 | 0.00 1.43 |
| NGC6010 | 1.71 1.91 | 1.65 0.94 | 0.00 2.87 |
| NGC6014 | 21.27 6.08 | 54.19 11.78 | 82.08 14.54 |
| NGC6017 | 5.90 1.76 | 3.05 0.98 | 7.56 2.93 |
| NGC6149 | 2.40 1.25 | 1.39 0.77 | 16.22 4.27 |
| NGC6278 | 4.58 3.59 | 3.69 1.64 | 23.46 5.85 |
| NGC6547 | 2.50 2.25 | 0.82 0.87 | 12.49 5.86 |
| NGC6548 | 1.33 1.71 | 1.60 0.74 | 0.00 1.54 |
| NGC6703 | 4.57 2.21 | 1.75 1.01 | 4.75 1.81 |
| NGC6798 | 6.42 3.33 | 3.95 1.58 | 0.49 3.28 |
| NGC7280 | 3.01 1.60 | 1.35 0.66 | 3.41 1.40 |
| NGC7332 | 0.00 1.96 | 2.86 1.08 | 2.38 1.54 |
| NGC7457 | 0.95 0.68 | 0.37 0.26 | 0.22 0.30 |
| NGC7465 | 73.39 7.89 | 48.16 5.84 | 195.90 28.98 |
| NGC7693 | 0.16 0.35 | 0.00 0.32 | 8.48 3.64 |
| NGC7710 | 0.54 0.54 | 0.24 0.37 | 5.78 3.41 |
| PGC016060 | 13.20 4.09 | 7.41 2.60 | 54.90 11.85 |
| PGC028887 | 0.00 0.38 | 0.00 0.49 | 14.38 4.85 |
| PGC035754 | 0.04 0.37 | 0.00 0.30 | 0.00 2.35 |
| PGC044433 | 0.01 0.50 | 0.00 0.52 | 0.00 4.63 |
| PGC050395 | 0.00 0.35 | 0.01 0.04 | 1.69 2.32 |
| PGC051753 | 0.08 0.40 | 0.06 0.31 | 1.90 3.26 |
| PGC054452 | 0.12 0.30 | 0.24 0.23 | 3.83 1.75 |
| PGC056772 | 11.26 3.96 | 28.14 4.33 | 94.24 15.23 |
| PGC058114 | 27.13 3.58 | 42.06 4.58 | 96.42 14.43 |
| PGC061468 | 6.47 1.74 | 6.21 2.28 | 17.11 4.58 |
| PGC071531 | 0.02 0.27 | 0.00 0.03 | 0.00 2.90 |
| UGC03960 | 0.00 0.33 | 0.20 0.33 | 7.05 3.56 |
| UGC04551 | 0.24 0.84 | 0.00 0.36 | 2.42 1.74 |
| UGC05408 | 23.70 13.01 | 57.23 8.30 | 110.84 18.68 |
| UGC06062 | 1.92 1.33 | 1.38 0.70 | 0.00 3.59 |
| UGC06176 | 49.25 6.57 | 75.38 10.55 | 132.13 23.06 |
| UGC08876 | 0.20 0.61 | 0.00 0.33 | 6.08 2.89 |
| UGC09519 | 8.69 1.96 | 3.54 0.94 | 13.75 2.78 |