Photoluminescence excitation spectroscopy of SiV- and GeV- color center in diamond
Abstract
Color centers in diamond are important quantum emitters for a broad range of applications ranging from quantum sensing to quantum optics. Understanding the internal energy level structure is of fundamental importance for future applications. We experimentally investigate the level structure of an ensemble of few negatively charged silicon-vacancy (SiV-) and germanium-vacancy (GeV-) centers in bulk diamond at room temperature by photoluminescence (PL) and excitation (PLE) spectroscopy over a broad wavelength range from to and perform power-dependent saturation measurements. For SiV- our experimental results confirm the presence of a higher energy transition at . By comparison with detailed theoretical simulations of the imaginary dielectric function we interpret the transition as a dipole-allowed transition from -state to -state where the corresponding -level lies deeply inside the diamond valence band. Therefore, the transition is broadened by the diamond band. At higher excitation power of we indicate signs of a parity-conserving transition at supported by saturation measurements. For GeV- we demonstrate that the PLE spectrum is in good agreement with the mirror image of the PL spectrum of the zero-phonon line (ZPL). Experimentally we do not observe a higher lying energy level up to a transition wavelength of . The observed PL spectra are identical, independent of excitation wavelength, suggesting a rapid decay to excited state and followed by optical transition to ground state. Our investigations convey important insights for future quantum optics and quantum sensing experiments based on SiV--center and GeV--center in diamond.
1 Introduction
Color centers in diamond are used in a large set of applications including luminescent markers [1], magnetic field sensing with high spatial resolution [2] or as single photon emitter in quantum optics applications [3, 4]. Diamond is of particular interest since it can accommodate a large number of different color centers giving access to a large spectral range and variety of different spin and optical properties. The negatively charged nitrogen-vacancy center (NV-) is the most studied color center with a unique set of properties and applications [5]. However, the search for new color centers is of great importance not only to extend the spectral range but also to find color centers with improved spin and, in particular, optical properties. Emission of single photons has been demonstrated with Cr-based color centers [6] and Ni-based centers (NE8) [7], but engineering of them is difficult.
Recently the SiV- center has drawn great attention due to its unique set of optical properties [8] demonstrating a comparably large Debye-Waller (DW) factor of , single photon emission with good polarization contrast [9], a very small inhomogeneous line broadening of only a few transition linewidth and a large spectral stability enabling a spectral overlap of up to and lifetime-limited linewidth at resonant excitation [10]. These developments enabled the demonstration of indistinguishable, single photon emission employing Hong-Ou-Mandel interference without the need of electric field tuning of the transition frequency [11]. The symmetry of the SiV- center plays a crucial role for the spectral stability, leading to a very small sensitivity to electric fields and, correspondingly, a small spectral diffusion and narrow inhomogeneous distribution of transition frequencies.
The GeV- center was proposed to offer a very similar structure to that of SiV- [12]. Very recently Ge-related color centers were reported in high-pressure-high-temperature (HPHT) synthesized diamond crystals [13, 14] experimentally demonstrating zero-phonon line (ZPL) emission at with a full width at half maximum (FWHM) of at room temperature. From DFT calculations the electron excitation energy for the GeV- center was calculated to be . Single photon emission at was demonstrated for GeV- centers produced from ion implantation [15].
A key requirement for future applications is the understanding of the internal energy level structure with its excitation and luminescence properties. While for GeV- the energy level structure, in particular, of higher-lying states has so far barely been studied, first measurements with SiV centers have been reported in 2000 [16] recording photoluminescence excitation (PLE) spectra over a large excitation wavelength range from to employing a halogen lamp in combination with double monochromator therefore measuring with low spectral power density of the excitation light.
In this paper we investigate PLE spectroscopy for both, an ensemble of few SiV- centers and an ensemble of few GeV- centers in bulk diamond at room temperature. We measure PLE spectra over an excitation wavelength range from to and examine the power-dependent saturation for each measurement. We compare our experimental results with theoretical simulations of the imaginary dielectric function and develop a consistent physical picture.
2 Methods
Our experiments are performed using a custom-built confocal microscope with a high NA air objective (NA = ). As a tunable laserlight source, a continuous-wave (cw) optical-parametric oscillator (OPO) with second-harmonic-generation unit (SHG) is employed (C-WAVE from Hübner). The system covers the wavelength ranges (OPO) and (SHG) with output powers in the range of several hundred milliwatts. The linewidth of the cw output beam is below and the frequency can be swept mode-hop free over . The excitation power in the sample plane reaches up to . The photoluminescence (PL) of the different color centers is cleaned up using several spectral filters in the detection path and measured either using a single-photon counting module (SPCM) or a spectrometer with a 150 groves/mm grating. The samples are mounted on a two axis piezo nanopositioning stage enabling mapping with scan ranges of up to .
We apply ab initio theoretical modeling, in order to characterize the optical properties of the negatively charged SiV and GeV defects and compare them with the experimental observations. We employ spin-polarized density functional theory (DFT) plane-wave supercell calculations as implemented in the vasp code [17, 18]. We employ projector augmented-wave[19] (PAW) method to treat the ions with plane wave cutoff for the pseudo wavefunctions, and relax the geometries until the forces acting on the ions fall below . A small-core projector for the Ge ion is applied in the calculations. We use different techniques in order to calculate the optical spectrum of the defects. The excitation energies are calculated within the range separated hybrid density functional HSE06 [20, 21] with applying the constraint DFT method [22, 23]. We employ simple cubic 512-atom diamond supercell with -point sampling of the Brillouin zone in these calculations. The band to defect level optical transitions are estimated within DFT as more sophisticated methods such as Bethe-Salpeter equation are computationally intractable. The considered defects have quasi symmetry with spin state with a quasi-degenerate half-occupied in-gap defect level in the spin minority channel. This is a complicated situation where the band to defect level optical transition cannot be readily calculated by using high number of k-points in the Brillouin zone, as the dispersion of the defect levels in the gap would result in false occupation of the in-gap states that leads to artificial optical transitions. Instead, we increase the size of the supercell with keeping the -point sampling of the Brillouin-zone. We apply cubic diamond supercells up to 4096-atom in the calculation of absorption spectrum which is taken from the trace of the imaginary part of the dielectric function [24]. This type of calculations are extremely demanding even at simple Kohn-Sham DFT level. Thus, we apply the computationally less expensive PBE [25] functional in these calculations. In our experience, the PBE and HSE06 Kohn-Sham wavefunctions are very similar for these defects, thus the transition dipole moments are well approximated by PBE calculations. We note that 4096-atom supercell is still not entirely convergent, nevertheless, it provides a semi-quantitative estimate.
3 Investigation of ensemble of few SiV- center
An ensemble of few SiV- centers was studied in a diamond plate obtained by laser-slicing and polishing of a HPHT-grown type-IIa crystal. High-purity, 12C-enriched (), homoepitaxial diamond film was deposited using a microwave plasma-assisted chemical-vapor-deposition (MPCVD) apparatus [26]. The total gas pressure, microwave power, methane concentration ratio (/total flow), oxygen concentration ratio (/total flow), growth duration and substrate temperature employed were , , , , , and , respectively. The 8N-grade 12C-enriched () methane was used as a source gas. After the growth of non-doped layer, Si-doped layer was overgrown for by placing a SiC plate near the substrate resulting in a thickness of .[9, 26].
SiV- and NV- center are formed at a few microns below the diamond surface. When using a longpass filter in the detection path we reach count rates between and for several SiV- ensembles with of excitation power at the microscope objective, corresponding to around 10 SiV- centers in the detection volume. When using a bandpass filter we obtain between and for the same spots. In the following we present measurement data for two different SiV- ensembles.
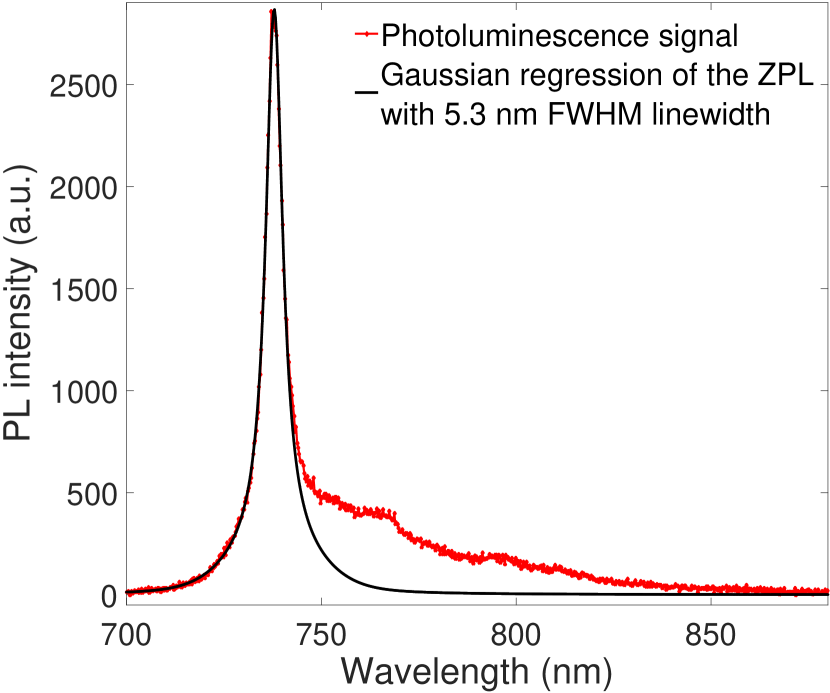
The fluorescent spots are first examined using spectrometer measurements. A photoluminescence spectrum of the first spot taken at an excitation power of at wavelength of laserlight is shown in figure 1(a). We use a longpass filter to cut out the laser emission. Typical emission characteristics of the SiV- color center at room temperature with a strong ZPL emission at and a phonon sideband, which extends to is observed. The Debye-Waller (DW) factor, defined as the fraction of fluorescence emitted into the ZPL compared to the total emission of the defect center is calculated, by using a Gaussian regression with FWHM linewidth for the ZPL emission. As an outcome we find the DW factor to be which is comparable to earlier reports on the optical properties of the SiV- center [27]. No significant contribution from other optically-active defect centers within the detection volume of our confocal microscope and within the recorded spectral window are observed.
Next, we perform PLE measurements by recording the emitted photons employing single photon counting modules and a bandpass filter in the detection path while tuning the excitation wavelength over a wide range from to and keeping the excitation power constant.
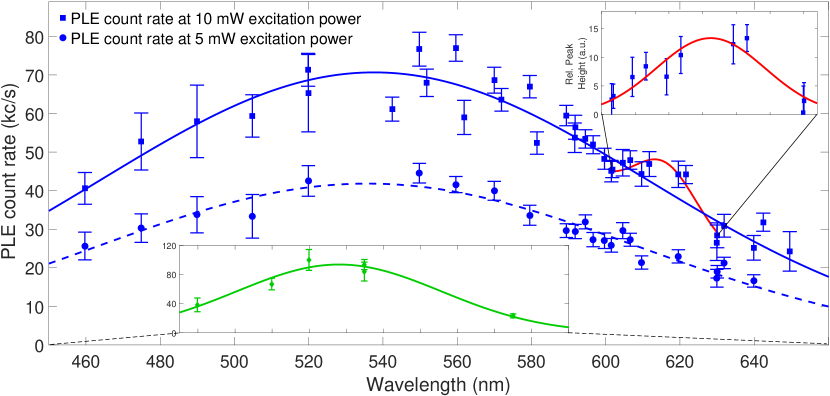
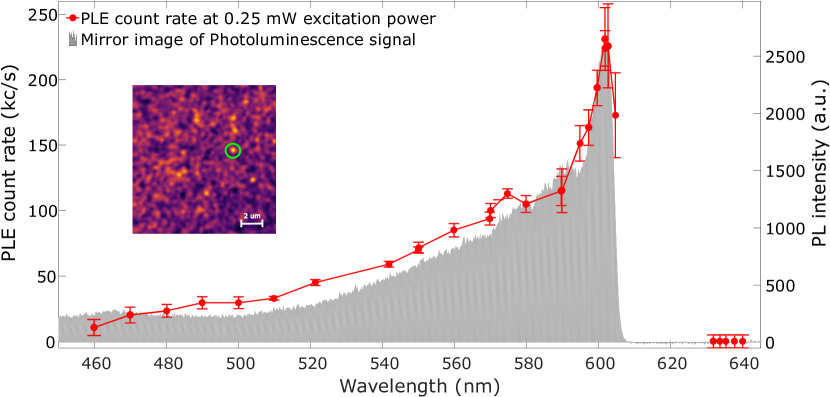
The resulting PLE spectra for two different excitation powers of and are shown in figure 1(b), as well as a second data set for a different ensemble at excitation power in the inset. Both ensembles show similar PLE characteristics with a very broad PLE signal distributed over the entire measured wavelength range. We fit a Gaussian lineshape to the measured data inferring the excitation maximum at around , with a FWHM linewidth of for the first ensemble and for the second ensemble. By comparison with theory we attribute the broad PLE resonance to a dipole-allowed transition from to as elaborated in detail in section 5. Furthermore, we take PL spectra at most of the measured excitation wavelengths and do not observe a significant change in the fluorescence spectrum. Independent on excitation wavelength there is always a rapid decay process present leading to a fast decay, fast compared to the optical lifetime of the -state, into the -state and a subsequent optical transition into the ground state with the characteristic ZPL emission at .
So far, excitation power is kept constant to obtain the wavelength-dependent PLE spectra. Next we study the excitation wavelength-dependent saturation behavior of the SiV- ensembles.
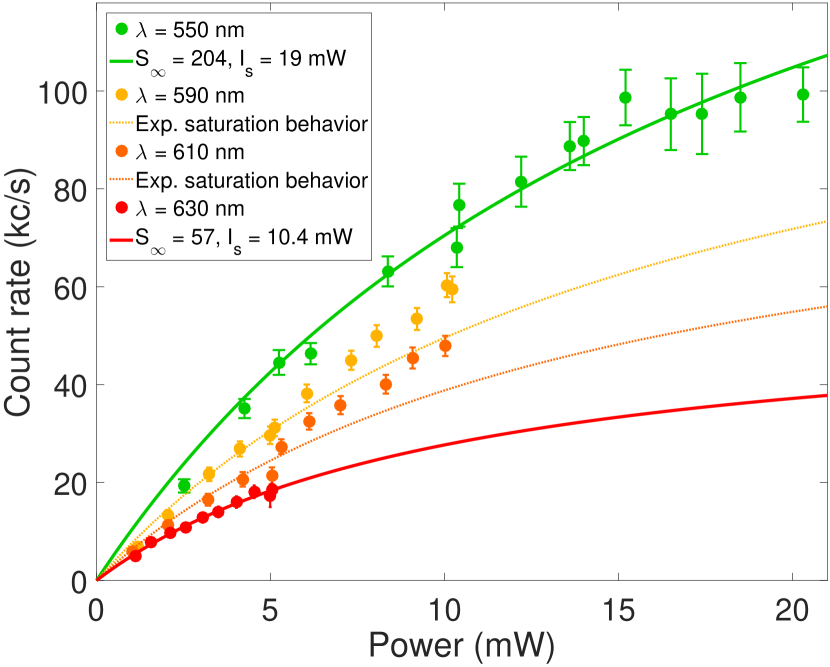
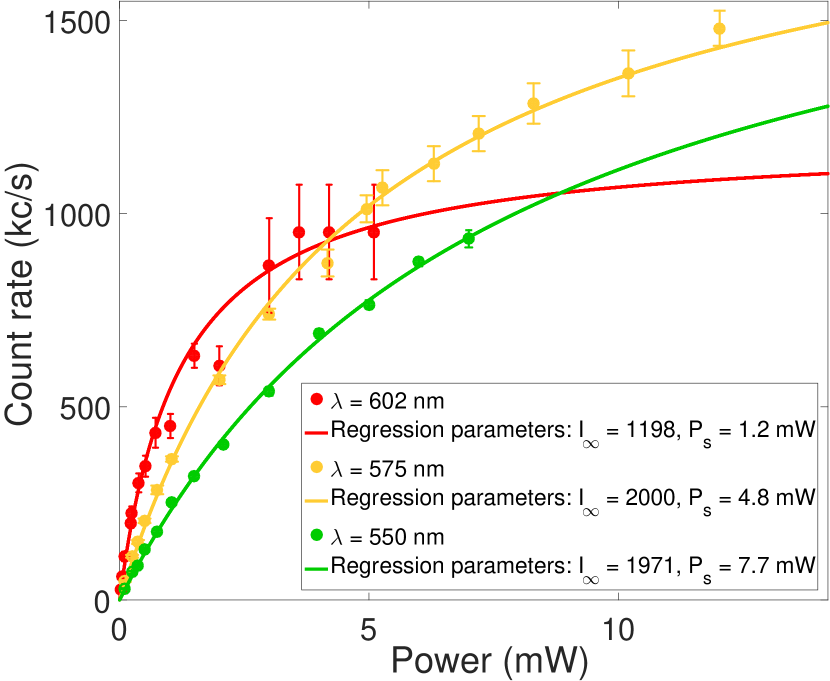
Figure 1(c) shows the measurement data at four different excitation wavelengths in the range between and .
Close to the maximum of the measured wavelength-dependent PLE curve at we observe saturation behavior that we can fit with simplified model of the saturation law
| (1) |
where is the saturation count rate and the saturation power. Exciting at (green data in figure 1(c)) we obtain a saturation count rate of and a saturation power of (green curve).
We conclude that we are exciting an optical allowed transition with a transition resonance at . At constant excitation power the PLE count rate decreases with increasing detuning from resonance. For higher excitation wavelengths between (red data in figure 1(c)) and we observe saturation behavior in agreement with the saturation law (1) but with significantly reduced saturation count rate of and saturation power of (red curve). However, for excitation wavelengths of and (yellow and orange data in figure 1(c)) we observe a significant change in the saturation behavior. For illustration we plot results from saturation law (1) as guide to the eye. Significant deviation from the saturation law is observed with increasing discrepancy for increasing excitation power. No sign of saturation is visible for excitation powers up to . Furthermore, we observe a signature of a spectral feature at excitation power of , marked as red solid line in the PLE spectrum of figure 1(b). We fit the additional peak in the PLE spectrum with a Gaussian regression after subtracting the background caused by the broad resonance resulting in a peak position at and a peak width of .
We interpret our experimental findings as the onset of driven parity-conserving transition at a peak position of . So far, we have mapped optical transitions which are parity-altering via single photon excitation. However, with increasing excitation power we hypothesize to start to probe also parity-conserving transitions, probably via two-photon excitation as it has been reported recently in reference [28]. Our excitation laser system is simultaneously tuned between and by tuning the OPO and, at the same time, frequency-doubled light is generated in the visible range between and via second harmonic generation. For our measurement at excitation power and with excitation wavelength of we extrapolated that of light is present in front of the objective which could be sufficient to probe the onset of parity-conserving transitions via two-photon excitation.
According to our theory, the lowest energy parity-conserving excited state can be described by promoting an electron from the valence band edge to the defect level. The valence band edge will split in the presence of the defect to and bands in the -point of the Brillouin-zone, so they correspond to gerade bands. The corresponding excitation energy is smaller than the excitation energies related to the bands because the bands lie deeper in the valence band.
Our observed signature at is in good agreement with recent results obtained from two-photon excited fluorescence spectra reported in reference [28] where the parity-conserving optical transitions are probed via two-photon excitation. The threshold of two-photon absorption can map the ionization energy minus the binding energy of the exciton to the SiV- defect (gerade-to-gerade transition) whereas single-photon excitation can predominantly excite higher energy states.
Furthermore, we want to note that the observed spectral feature happens very close to the expected SiV2- charge transition which is estimated to be resonant at around () (see [29] and section 5). For in-depth interpretation of the ionization process further investigations at higher excitation powers and with single-shot charge state detection are necessary [30].
(a)
(c)
(b)
4 Investigation of ensemble of few GeV- center
In order to study optical properties of the negatively charged germanium-vacancy center we investigate a high-density GeV sample fabricated by ion implantation with a implantation dose of and subsequent anneal at C in a IIa-type diamond substrate. Around below the surface a bright layer is formed showing typical GeV- emission characteristics. Several bright spots can be identified as GeV- ensembles with up to ten particles within the detection volume. We measure a maximum of for GeV- ensemble marked in figure 2(d) with an excitation power of at the microscope objective and excitation wavelength. In the detection path we use a longpass filter. Due to the high density of GeV- centers in the sample we obtain a background fluorescence of with a sample background also showing GeV- spectra.
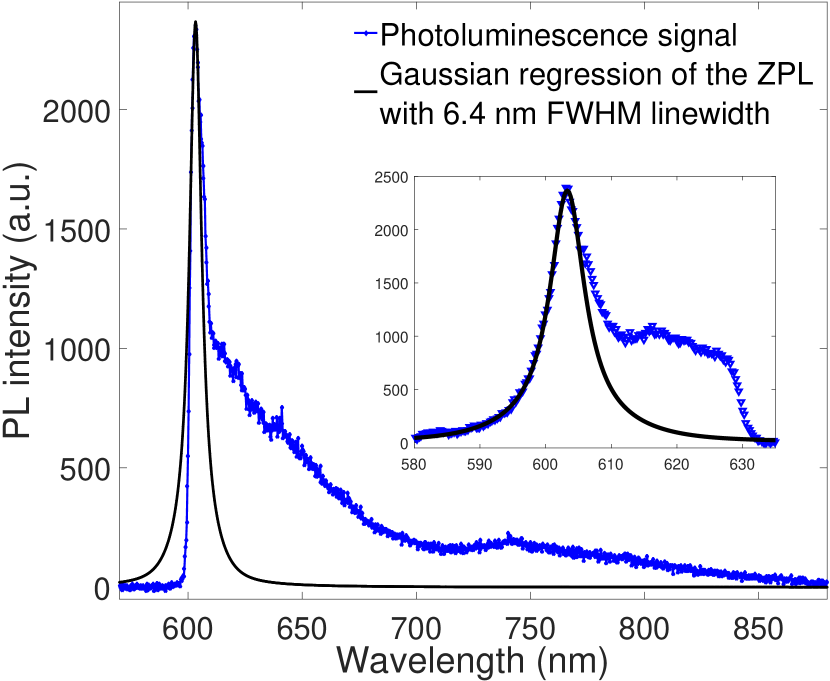
Figure 2(a) shows the PL spectrum of the observed GeV- ensemble recorded with the spectrometer. The ZPL at is visible but partially suppressed by the filter cutoff at . By using a bandpass filter in the detection path we can map the whole ZPL and fit it with a Gaussian lineshape with a FWHM of to calculate DW factor of (see inset in figure 2(a)).
PLE measurements of the GeV- ensemble with an excitation power of in the wavelength range from to are shown in figure 2(b). We use longpass filter for excitation wavelengths below and longpass filter for excitation wavelengths between and leading there to larger error bars due to reduced count rates. The overall PLE count rates are renormalized taking fractional filter transmission into account.
The maximum excitation with a count rate of can be obtained for resonantly driving the ZPL at . In the wavelength range between and the PLE spectrum is in good agreement with the mirror image of the photoluminescence spectrum flipped at precisely the central ZPL emission frequency (shown in figure 2(b) as the grey shaded plot). On the blue wavelength side we see a decay of the excitation probability, which drops almost to zero at . For excitation wavelengths between and no excitation of the GeV- ensemble is possible. In analogy to the measurements on the SiV- ensembles we do not observe significant change of the PL spectrum over the whole excitation wavelength range.
To investigate the excitation power-dependence of the fluorescence of the GeV- ensemble we present measurement data of the fluorescence count rate as a function of excitation power for three different excitation wavelengths in figure 2(c). The saturation behavior over the whole excitation wavelength range is in good agreement with above mentioned model of the saturation law. Using equation (1) we calculate saturation curves for the three data sets in figure 2(c). As a result we get a saturation count rate of at and almost twice as high saturation count rates for excitation via sideband ( and ). We justify the increased saturation count rate with a reduced population in the groundstate for strong off-resonant excitation while the population in the groundstate remains for strong resonant excitation. The reduced excitation probability for sideband excitation is demonstrated by the increase of the saturation power at () excitation by a factor of four (six).
It is important to note that the charge transition level is at around according to our calculations. This means that PLE measurements on the second band should compete with the ionization process, but in the case of GeV- this competition is less severe than that for SiV-.
(a)
(c)
(b)
5 Electronic level structure of the SiV- and GeV- color center
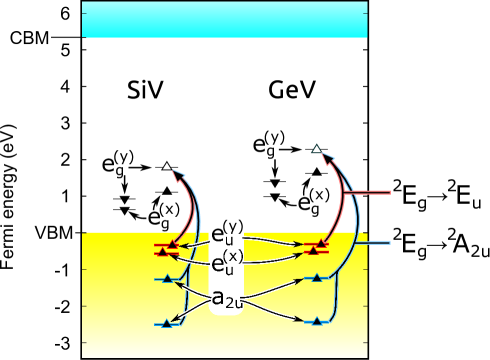
Finally, we develop a consistent physical model of the electronic level structure of the SiV- and GeV- center. Figure 3(a) depicts the electronic structure for the ground state of SiV- and GeV-. One can see that the electronic structure of the two defects are very similar except that the in-gap level lies about higher for GeV- than that for SiV-. In our calculations we allow a small static distortion to symmetry. This results in a small splitting of the degenerate and states. We disregard spin-orbit coupling in simulations due to different energy scale with respect to optical transition energy. The states are closely resonant with the valence band maximum (VBM). We already showed in our previous publication for SiV- by constraint DFT calculation [29] that if a hole is induced for this state then it becomes localized. Thus, the transition to the first excited state () results in a sharp zero-phonon line (ZPL) transition. The participation of the phonons in this process can be calculated for this transition by using different level of approximations in the electron-phonon coupling [31]. We find that the same effect holds for the first excited state of GeV- just its ZPL energy lies about higher.
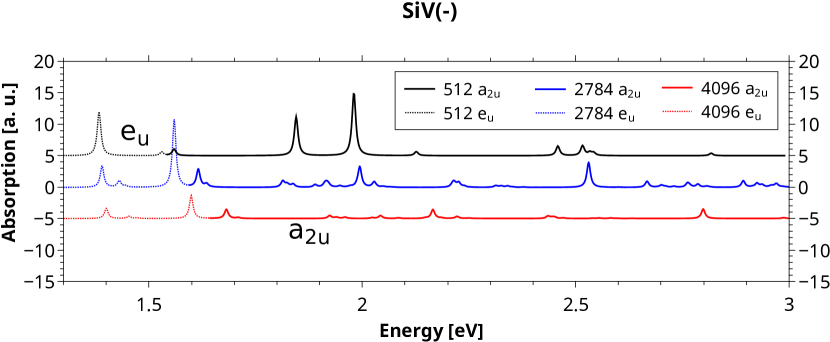
We find that a broad band is developed below the level. The defect level is strongly mixed with the diamond bands that creates this broad band. This band emerges about below VBM, and is about broad. If we promote an electron from any of these states to the in-gap state then the resulted hole will never be localized. This means that the absorption spectrum arising from these band will be broad even when just pure electronic transitions are considered. We find the optically forbidden band at least deeper in energy in the valence band than the band. Since the optical transition is optically allowed we calculated the absorption spectrum at the ground state geometry at DFT PBE level in a large 4096-atom supercell but using the HSE06 Kohn-Sham energies in the estimate of the optical transition energies. In this context we measure the excitation energies coming from the band from the level as a reference that we associate with the ZPL energy. This means that we implicitly assume a similar Stokes-shift in the transition as that in the transition. We found that the integrated absorption of the transitions is almost equal to that of the transition.
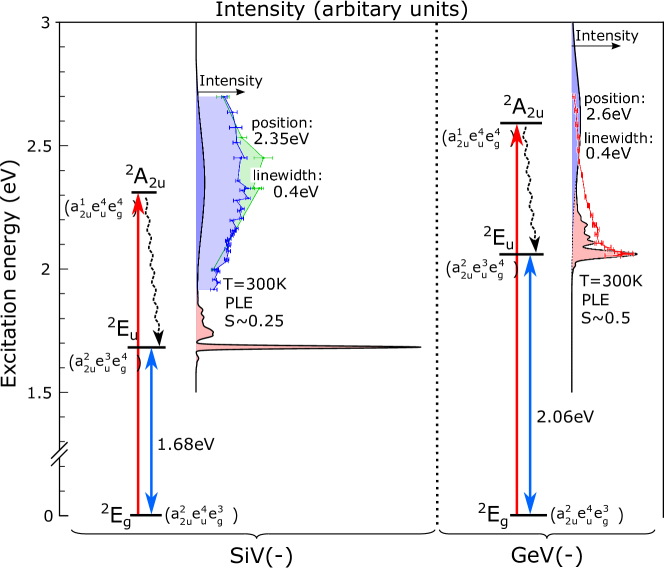
Having all of these data in our hand, a simulated absorption spectrum is generated shown in Figure 3(b). The calculated HSE06 ZPL energies of the transition are and for the SiV- and GeV- defects, respectively, to be compared to the experimental values at and , respectively. The ZPL energy is aligned to the experimental value for the considered defects in Figure 3(b), for the sake of clarity and direct comparison with the experimental data. The second band in the absorption spectrum that we associate with the optical transition from the band is generated as follows. We assume that the 4096-atom supercell calculation is still not fully convergent to describe the mixture of band with the diamond bands, so the calculated spectrum is still too discrete (see Supplementary Materials). Therefore, we calculate the averaged value of the band as and its standard deviation as from the 4096-atom supercell. The is the trace of the frequency dependent dielectric matrix with optical transitions only for band. Similarly we calculate the averaged position of the band, then add the energy difference between the and into the experimental ZPL energy of the transition. Then for the sake of simplicity we plot a Gaussian function with standard deviation at the given position. The total integrated absorption of the Gaussian function follows the total integrated absorption associated with transitions as obtained in the 4096-atom calculation. The results of this fitting procedure provide the central position (highest intensity) of the second band in the absorption, and the broadening. We find that the central position of the second band in the absorption spectrum is at and for SiV- and GeV- defects, respectively. The calculated value for SiV- agree nicely with the experimental data. However, the calculated broadening of the second band is larger than that in the experiment. We argue that the broadening of the second band in the absorption is overestimated because the electron-hole interaction was not taken into account in our method that should somewhat localize the band. Nevertheless, our calculations prove that allowed optical transitions should occur in the energy region where the second band in the PLE spectrum was observed. For GeV- defect the calculated absorption spectrum is a bit more complex. The phonon sideband of the usual transition overlaps almost completely with the very broad and low intensity -band to optical transitions, therefore, it is much more difficult to observe the presence of this second band. Nevertheless, the calculated broadening of the second band is still somewhat overestimated due to the neglect of electron-hole interaction in the calculated spectrum that results in some probability of optical transition at shorter wavelengths than that was observed experimentally. We further note that the polarization of the second band in the PLE spectrum [9] agrees well with our model as optical transitions are only allowed by photons polarized perpendicular to the symmetry axis of the defect.
(a)
(b)
6 Conclusion
Our experimental investigation on the excitation of an ensemble of SiV- centers and the direct comparison with theoretical modeling of the imaginary dielectric function suggest a dipole-allowed transition resonant at from -state to -state where the corresponding -level lies deeply inside the diamond valence band leading to broadening of the transition with FWHM of . We observe a change of saturation behavior in the wavelength range between and . Together with a spectral peak at with a FWHM of arising at higher excitation power of we interpret our data as probing of a parity-conserving transition from the valence band edge, split in the presence of the defect to and bands in the -point of the Brillouin-zone, corresponding to gerade bands. We further note that the change in saturation behavior happens close to the SiV2- charge transition at around , which was proposed in [29].
For an ensemble of GeV- centers we find the PLE spectrum in good agreement with the mirror image of the photoluminescence spectrum. Theoretically we propose a similar electronic level structure for GeV- as compared to SiV-, resulting in a second excited state at . Experimentally we do not confirm the presence of this state due to the low intensity and large width of the -band, which overlaps with the phonon sideband of the transition. PLE measurements at low temperature could help to get better resolved PLE spectra for GeV- as has recently been reported in [32] between and . Extending the measurements to shorter wavelength could shed light on the existence of a weak maximum around the calculated due to transition.
An alternative interpretation of the electronic level structure of the two centers is based on a forbidden transition with phonon-allowed band to the -state as proposed in [9]. Our DFT results rather imply that broadening of the second band in the PLE spectrum is due to the optically active bands, and no sharp optical signals are expected from band to in-gap level type of photo-excitation. The level is supposed to lie above the level and thus the spectroscopic feature closest in energy to the ZPL would be more likely due to
7 Supplementary Material
We provide additional information about the calculated optical spectrum that is plotted in figure 3(b) of the main text. The calculations involve large supercell modeling and consideration about the limitation of the applied Kohn-Sham DFT functional. The corresponding raw data and optical spectra are shown in figure 7, and the ab-initio derivation of the corresponding parameters applied in producing figure 3(b) are described in the corresponding figure caption.
(a)
(b)
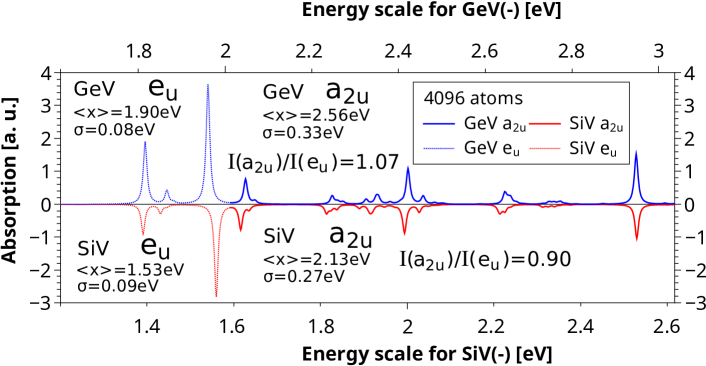
(b) Imaginary part of the dielectric function for the SiV- and GeV- systems. The spectra were calculated in 4096-atom supercell within PBE DFT approach without excitonic effects. By aligning the energy scale of the calculated optical transition energies of the two defects one can see the similarity of the two systems. We define the peak position by calculating the first moment and the standard deviation of the optical spectrum for each hole, separately. The value of the first moment provides the peak position. First, we calculated this for the hole bands. The resultant for this optical transition of the SiV- defect is overestimated because of the afore-mentioned approximations in the calculation. After getting the calculated energy position of the transitions we shifted the energy scale to match the calculated peak with the experimental zero-phonon-line for each defect, that are, for SiV-, and for GeV-, respectively. These results in and rigid shifts for these defects, respectively. By applying these energy shifts also to the calculated peak positions of the spectra one yields and for SiV- and GeV- defects, respectively. These data are depicted in Fig. 3 of the main text. The calculated of these spectra are used to estimate the width of the optical spectrum associated with the hole which is an overestimation due to the neglect of excitonic effects in the calculations.
Acknowledgements
We thank Dr. Hitoshi Sumiya (Sumitomo Electric Industries, Ltd.) for providing the HPHT crystal for the SiV sample. This work was supported by PRESTO, JST (Grant Number JPMJPR16P2) and CREST, JST and in part by Japan Society for the Promotion of Science KAKENHI (No.26246001 and No. 15H03980). We further thank Lachlan Rogers for fruitful discussions. Experiments performed for this work were operated using the Qudi software suite. SH and AK acknowledge support of IQST. AK and AD acknowledge support of the Carl-Zeiss Foundation. AK acknowledges support of the Wissenschaftler-Rückkehrprogramm GSO/CZS and DFG. FJ acknowledges support of the DFG, BMBF, VW Stiftung and EU (ERC, DIADEMS). AG acknowledge EU DIADEMS funding.
References
References
- [1] I. Aharonovich, A. D. Greentree, and S. Prawer. Diamond photonics. Nature Photonics, 5:397–405, 2011.
- [2] G. Balasubramanian, P. Neumann, D. Twitchen, M. Markham, R. Kolesov, N. Mizuochi, J. Isoya, J. Achard, J. Beck, J. Tissler, V. Jacques, P. R. Hemmer, F. Jelezko, and J. Wrachtrup. Ultralong spin coherence time in isotopically engineered diamond. Nature Materials, 8:383–387, 2009.
- [3] E. Togan, Y. Chu, A. S. Trifonov, L. Jiang, J. Maze, L. Childress, M. V. G. Dutt, A. S. Sorensen, P. R. Hemmer, A.S. Zibrov, and M. D. Lukin. Quantum entanglement between an optical photon and a solid-state spin qubit. Nature, 466:730–734, 2010.
- [4] H. Bernien, B. Hensen, W. Pfaff, G. Koolstra, M. S. Blok, L. Robledo, T. H. Taminiau, M. Markham, D. J. Twitchen, L. Childress, and R. Hanson. Heralded entanglement between solid-state qubits separated by three metres. Nature, 497:86–90, 2013.
- [5] F. Jelezko and J. Wrachtrup. Single defect centres in diamond: A review. Physica Status Solidi (a), 203(13):3207–3225, 2006.
- [6] I. Aharonovich, S. Castelletto, B. C. Johnson, J. C. McCallum, D. A. Simpson, A. D. Greentree, and S. Prawer. Chromium single-photon emitters in diamond fabricated by ion implantation. Physical Review B, 81:121201, 2010.
- [7] T. Gaebel, I. Popa, A. Gruber, M. Domhan, F. Jelezko, and J. Wachtrup. Stable single-photon source in the near infrared. New Journal of Physics, 6, 2004.
- [8] T. Müller, C. Hepp, B. Pingault, E. Neu, S. Gsell, M. Schreck, H. Sternschulte, D. Steinmüller-Nethl, C. Becher, and M. Atatüre. Optical signatures of silicon-vacancy spins in diamond. Nature Communications, 5, February 2014.
- [9] L. J. Rogers, K. D. Jahnke, M. W. Doherty, A. Dietrich, L. P. McGuinness, C. Müller, T. Teraji, H. Sumiya, J. Isoya, N. B. Manson, and F. Jelezko. Electronic structure of the negatively charged silicon-vacancy center in diamond. Physical Review B, 89(23):235101, June 2014.
- [10] L. J. Rogers, K. D. Jahnke, T. Teraji, L. Marseglia, C. Müller, B. Naydenov, H. Schauffert, C. Kranz, J. Isoya, L. P. McGuinness, and F. Jelezko. Multiple intrinsically identical single-photon emitters in the solid state. Nature Communications, 5:4739, August 2014.
- [11] A. Sipahigil, K. D. Jahnke, L. J. Rogers, T. Teraji, J. Isoya, A. S. Zibrov, F. Jelezko, and M. D. Lukin. Indistinguishable photons from separated silicon-vacancy centers in diamond. Physical Review Letters, 113(11):113602, September 2014.
- [12] J. P. Goss, P. R. Briddon, M. J. Rayson, S. J. Sque, and R. Jones. Vacancy-impurity complexes and limitations for implantation doping of diamond. Physical Review B, 72:035214, 2005.
- [13] E. A. Ekimov, S. G. Lyapin, K. N. Boldyrev, M. V. Kondrin, R. Khmelnitskiy, V. A. Gavva, T. V. Kotereva, and M. N. Popova. Germanium–vacancy color center in isotopically enriched diamonds synthesized at high pressures. JETP Letters, 102(11):701–706, 2015.
- [14] Y. N. Palyanov, I. N. Kupriyanov, Y. M. Borzdov, and N. V. Surovtsev. Germanium: a new catalyst for diamond synthesis and a new optically active impurity in diamond. Scientific Reports, 5(14789), 2015.
- [15] T. Iwasaki, F. Ishibashi, Y. Miyamoto, Y. Doi, S. Kobayashi, T. Miyazaki, K. Tahara, K. D. Jahnke, L. J. Rogers, B. Naydenov, F. Jelezko, S. Yamasaki, S. Nagamachi, T. Inubushi, N. Mizuochi, and M. Hatano. Germanium-vacancy single color centers in diamond. Scientific Reports, 5(12882), 2015.
- [16] K. Iakoubovskii, G. J. Adriaenssens, and M. Nesladek. Photochromism of vacancy-related centres in diamond. Journal of Physics: Condensed Matter, 12:189–199, 2000.
- [17] G. Kresse and J. Hafner. Ab initio molecular-dynamics simulation of the liquid-metal–amorphous-semiconductor transition in germanium. Physical Review B, 49:14251–14269, May 1994.
- [18] G. Kresse and J. Furthmüller. Efficient iterative schemes for ab initio total-energy calculations using a plane-wave basis set. Physical Review B, 54:11169–11186, October 1996.
- [19] P. E. Blöchl. Projector augmented-wave method. Physical Review B, 50:17953–17979, December 1994.
- [20] J. Heyd, G. E. Scuseria, and M. Ernzerhof. Hybrid functionals based on a screened coulomb potential. The Journal of Chemical Physics, 118(18):8207–8215, 2003.
- [21] A. V. Krukau, O. A. Vydrov, A. F. Izmaylov, and G. E. Scuseria. Influence of the exchange screening parameter on the performance of screened hybrid functionals. The Journal of Chemical Physics, 125(22):224106, 2006.
- [22] A. Gali, E. Janzén, P. Deák, G. Kresse, and E. Kaxiras. Theory of spin-conserving excitation of the center in diamond. Physical Review Letters, 103:186404, October 2009.
- [23] P. Deák, B. Aradi, T. Frauenheim, E. Janzén, and A. Gali. Accurate defect levels obtained from the hse06 range-separated hybrid functional. Physical Review B, 81:153203, April 2010.
- [24] M. Gajdoš, K. Hummer, G. Kresse, J. Furthmüller, and F. Bechstedt. Linear optical properties in the projector-augmented wave methodology. Physical Review B, 73:045112, January 2006.
- [25] J. P. Perdew, K. Burke, and M. Ernzerhof. Generalized gradient approximation made simple. Physical Review Letters, 77(18):3865, 1996.
- [26] T. Teraji, T. Yamamoto, K. Watanabe, Y. Koide, J. Isoya, S. Onoda, T. Ohshima, L. J. Rogers, F. Jelezko, P. Neumann, J. Wrachtrup, and S. Koizumi. Homoepitaxial diamond film growth: High purity, high crystalline quality, isotopic enrichment, and single color center formation. Physica Status Solidi (a), 202:2365–2384, 2015.
- [27] A. Dietrich, K. D. Jahnke, J. M. Binder, T. Teraji, J. Isoya, L. J. Rogers, and F. Jelezko. Isotopically varying spectral features of silicon vacancy in diamond. New Journal of Physics, 16, 2014.
- [28] J. M. Higbie, J. D. Perreault, V. M. Acosta, C. Belthangady, P. Lebel, M. H. Kim, K. Nguyen, V. Demas, V. Bajaj, and C. Santori. Multiphoton-excited fluorescence of silicon-vacancy color centers in diamond. arXiv:1704.01493, 2017.
- [29] A. Gali and J. R. Maze. Ab initio study of the split silicon-vacancy defect in diamond: Electronic structure and related properties. Physical Review B, 88:235205, 2013.
- [30] N. Aslam, G. Waldherr, P. Neumann, F. Jelezko, and J. Wrachtrupp. Photo-induced ionization dynamics of the nitrogen vacancy defect in diamond investigated by single-shot charge state detection. New Journal of Physics, 202, 2013.
- [31] E. Londero, G. Thiering, M. Bijeikytė, J. R. Maze, A. Alkauskas, and A. Gali. Ab initio study on the herzberg-teller effect in the optical excitation spectrum of silicon-vacancy center in diamond. arXiv:1605.02955, 2016.
- [32] E. A. Ekimov, V. S. Krivobok, S. G. Lyapin, P. S. Sherin, V. A. Gavva, and M. V. Kondrin. Anharmonicity effects in impurity-vacancy centers in diamond revealed by isotopic shifts an optical measurements. Physical Review B, 95, 2017.