Modelling the Type Ic SN 2004aw: a Moderately Energetic Explosion of a Massive C+O Star without a GRB
Abstract
An analysis of the Type Ic supernova (SN) 2004aw is performed by means of models of the photospheric and nebular spectra and of the bolometric light curve. SN 2004aw is shown not to be “broad-lined”, contrary to previous claims, but rather a “fast-lined” SN Ic. The spectral resemblance to the narrow-lined Type Ic SN 1994I, combined with the strong nebular [O i] emission and the broad light curve, point to a moderately energetic explosion of a massive C+O star. The ejected 56Ni mass is M⊙. The ejecta mass as constrained by the models is M⊙, while the kinetic energy is estimated as ergs. The ratio /, the specific energy which influences the shape of the spectrum, is therefore . The corresponding zero-age main-sequence mass of the progenitor star may have been M⊙. Tests show that a flatter outer density structure may have caused a broad-lined spectrum at epochs before those observed without affecting the later epochs when data are available, implying that our estimate of is a lower limit. SN 2004aw may have been powered by either a collapsar or a magnetar, both of which have been proposed for gamma-ray burst-supernovae. Evidence for this is seen in the innermost layers, which appear to be highly aspherical as suggested by the nebular line profiles. However, any engine was not extremely powerful, as the outer ejecta are more consistent with a spherical explosion and no gamma-ray burst was detected in coincidence with SN 2004aw.
keywords:
radiative transfer – line: formation — line: identification — supernovae: general — supernovae: individual: SN 2004aw) — gamma ray bursts: general1 Introduction
Type Ic supernovae (SNe) are H-/He-poor core-collapse supernovae Clocchiatti & Wheeler (1997); Filippenko (1997); Matheson et al. (2001); Modjaz et al. (2016). Significant diversity can be found among the He-poor SNe whose data have been published (Bianco et al., 2014; Taddia et al., 2015; Lyman et al., 2016; Prentice et al., 2016). For example, models of the gamma-ray burst (GRB) SN 1998bw (Iwamoto et al., 1998) indicate that it ejected M⊙ of material with kinetic energy erg, and synthesised M⊙ of 56Ni, which powered the light curve. These results suggested a progenitor of M⊙. In contrast, SN 1994I (Richmond et al., 1996) was less luminous and energetic. Radiation transport models (Sauer et al., 2006) show that it ejected only M⊙ of material with erg. Both the and the mass of 56Ni synthesised by SN 1994I ( M⊙) are similar to ordinary SNe IIP, which suggests a progenitor mass of M⊙. A star of this mass must undergo severe envelope stripping to result in anything other than a SN IIP. Hachinger et al. (2012) showed that small amounts of He and H are sufficient to transform a spectrum from H-/He-poor to H-poor/He-rich and from H-poor/He-rich to H-/He-rich, respectivel. How this mass loss occurs is not fully understood, but strong binary interaction is considered to be the most likely way to strip a progenitor of its outer layers (Nomoto et al., 1995; Eldridge et al., 2013).
Given the large range of of SNe Ic we can infer that a wide range of progenitor stars can end their lives as SNe Ic, depending on their evolution. Many of the best observed SNe Ic are luminous, massive, and energetic, and belong to an extreme subclass sometimes called hypernovae. These are characterised by early spectra showing very broad absorption features indicative of very high ejecta velocities (Mazzali et al., 2002, 2010). Some of these SNe have been discovered in coincidence with long-duration gamma-ray bursts (GRBs) (e.g., Galama et al., 1998; Mazzali et al., 2006a; Ashall et al., 2017). While the collapsar scenario, involving the formation of a black hole and the subsequent accretion on to it of additional material from the stellar core (MacFadyen & Woosley, 1999; Woosley & Bloom, 2006; Fryer et al., 2007) has enjoyed much success, the fact that all GRB-SNe have erg, and that the collimation-corrected energy of the associated GRBs is always much smaller than the SN has been suggested to indicate that GRB-SNe could be energised by magnetars (Mazzali et al., 2014; Greiner et al., 2015; Ashall et al., 2017). SN 2006aj, which was associated with an X-ray flash, was modelled as the explosion of a star of M☉, and a magnetar was claimed to have energised the explosion also in this case (Mazzali et al., 2006b). Magnetars may therefore be responsible for most, perhaps all SNe associated with relativistic events, which would be in keeping with the original suggestion that the collapsar is a failed SN (MacFadyen & Woosley, 1999). We also know SNe which have a high-velocity, high-energy tail to their ejecta, which causes broad absorption lines, but were not associated with a GRB (e.g. SN 1997ef, Mazzali et al., 2000). In some cases the mass and energies involved may have been too small (e.g. SN 2002ap, Mazzali et al., 2002); in other cases the orientation of the event may have been unfavourable for the detection of a possible GRB (e.g. SN 2003jd, Valenti et al., 2008; Mazzali et al., 2005).
Extracting SN properties requires good observational data as well as explicit modelling of these data (spectra and light curves), which implies some amount of work and has been done for only a very small number of SNe. Although significant uncertainties affect the estimates of mass and energy obtained even with this method, Mazzali et al. (2013) show that properties derived using scaling arguments can easily lead to much larger uncertainty, while properties derived using simplistic approaches are not to be trusted at all. It is therefore important not only to extract the properties of the most extreme SNe, but to map the entire range of , , and 56Ni mass in order to understand how SNe Ic are produced and what is the relation to other types of stripped-envelope SNe, which may show different distributions of properties (e.g. Prentice & Mazzali, 2017).
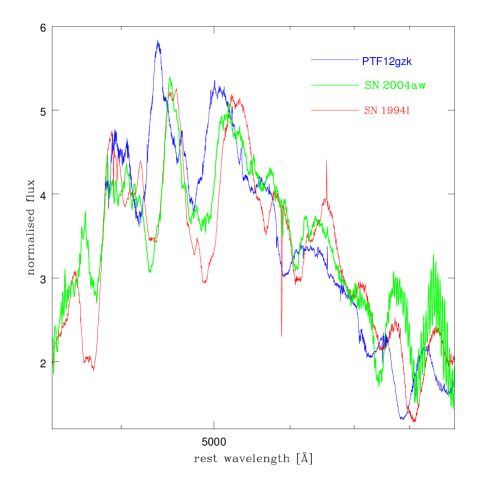
SN 2004aw is an interesting SN to study because it appears to be an intermediate case and it was very well observed (Taubenberger et al., 2006). Under the classification scheme presented in Prentice & Mazzali (2017) it is classified as a SN Ic-6. It was spectroscopically similar to SN 1994I and PTF12gzk (Ben-Ami et al., 2012), which was characterised by high line velocities ( km s-1). SN 2004aw is intermediate between these two SNe in velocity. In Figure 1 we compare near-maximum spectra of the three SNe. Despite the large velocity difference between the spectra, it is apparent that none of them show the extreme line blending that is typical of broad-lined SNe Ic. The light curve of SN 2004aw is somewhat broader than that of SN 1994I, and depending on the reddening that is assumed it may be also be more luminous. SN 2004aw may therefore represent an intermediate type of event, and as such it provides a good opportunity to further our understanding of He-poor SNe.
In this paper we describe our one-dimensional (1-D) models for the photospheric and nebular spectra of SN 2004aw, and for the bolometric light curve. Using our 1-D radiative transfer codes, we constrain the ejected mass, kinetic energy, and ejected 56Ni mass of SN 2004aw, which are then compared with those of other Type Ic SNe.
We analysed SN 2004aw in the spirit of abundance tomography (Mazzali et al., 2014). In Section 2 we describe our models for the early-time spectra, and discuss how they were used to establish a density distribution. We then proceed to the nebular spectra, and show how these can be used to determine the mass and density of the ejecta at low velocities, as well as their composition, in particular with respect to the amount and distribution of 56Ni. We also show how the profile of the emission lines can be used to optimise the model (Section 3). We then use the model of the ejecta obtained through spectral modelling, including the distribution of 56Ni, to compute a synthetic bolometric light curve, which we compare to the bolometric light curve of SN 2004aw constructed from the available photometry (Section 4). Finally, in Section 5 we discuss our results, and place SN 2004aw in the context of type Ic SNe.
Following Taubenberger et al. (2006), a distance modulus of for the host galaxy, NGC 3997, was used. A combined Galactic plus local reddening of is assumed throughout this paper.
2 Models for the Photospheric Spectra
We modelled a series of photospheric spectra of SN 2004aw using our Montecarlo SN spectrum synthesis code. Spectra with epoch between 1 and 28 days after maximum were selected from Taubenberger et al. (2006).
Our method is based on a Monte-Carlo solution of the line transfer that was developed by Abbott & Lucy (1985), Mazzali & Lucy (1993), Lucy (1999), and Mazzali (2000). The models assume an inner boundary (“photosphere”) of velocity for an epoch relative to the explosion where all radiation is emitted as a blackbody continuum of temperature . This is generally a good assumption for early epochs, and typically works until epochs of weeks after maximum for oxygen-dominated SN Ic ejecta. The ejecta are described by a density distribution (an explosion model) and by a composition, which can vary with depth. The gas in the ejecta and the radiation field is assumed to be in radiative equilibrium. Photon energy packets are followed through the ejecta, where they undergo scattering events. For line scattering, a branching scheme based on transition probabilities in the Sobolev-approximation allows photons to be emitted in transitions different from those in which they were absorbed. In order to account for the energy of photons that are scattered back into the photosphere (line blanketing) is adjusted in an iterative procedure to obtain the desired emergent luminosity, . The emergent spectrum is obtained from a formal solution of the transfer equation using the source functions that are derived from the Monte-Carlo simulation. The code has been used for a number of SNe Ic (e.g. Mazzali et al., 2013).
Early-time spectra probe the outer part of the ejecta, and can be used to establish both the abundance and the density distribution. In the case of SN 2004aw the density structure above km s-1 was modelled based on the 1-D hydrodynamical model CO21, which was developed for SN 1994I (Iwamoto et al., 1994). The density was scaled up by a factor of in order to achieve enough optical depth in the lines. This approach is justified by the overall spectral similarity between SN 2004aw and SN 1994I at similar photospheric epochs 1and by the good match of our model spectra to the observed ones (see Figure 2). This simplistic approach is necessary because of the lack of a grid of explosion models at different masses and energies. On the other hand, rescaling is justified because CO cores of massive stars tend to have self-similar density profiles even if they differ in mass (G. Meynet, priv. comm.). This rescaling can lead to some additional uncertainty, so we are very generous with our error estimates below. Homologous expansion is assumed at all times, so the ejecta can be conveniently described using velocity as a comoving coordinate.
As the supernova ejecta expand the line-forming region of the supernova recedes to progressively lower velocities. Subsequent epochs are therefore modelled by adding shells below the previous inner boundary while retaining the density and composition of the layers described by models of earlier epochs, following the approach called “abundance tomography” (Stehle et al., 2005).
Our models require a time from explosion so that the density structure can be appropriately rescaled. SN 2004aw was discovered late, only 5 days before maximum, so a direct determination of the epoch of explosion is not possible. Taubenberger et al. (2006) showed that the light curves of SN 2004aw are broader than those of SN 2002ap, whose risetime was determined through modelling to be days (Mazzali et al., 2002). SN 2004aw reached maximum days after maximum (Taubenberger et al., 2006). Bolometric maximum was intermediate between these two (see Section 4). We adopted for SN 2004aw a rise-time to maximum of 14 days. Epochs used in the models are shown in Figure 2 and listed in Table 1 along with other modelling parameters. We did not correct for time-dilation caused by the small redshift km s-1) since the uncertainty in the epoch (at least day) is larger than the correction.
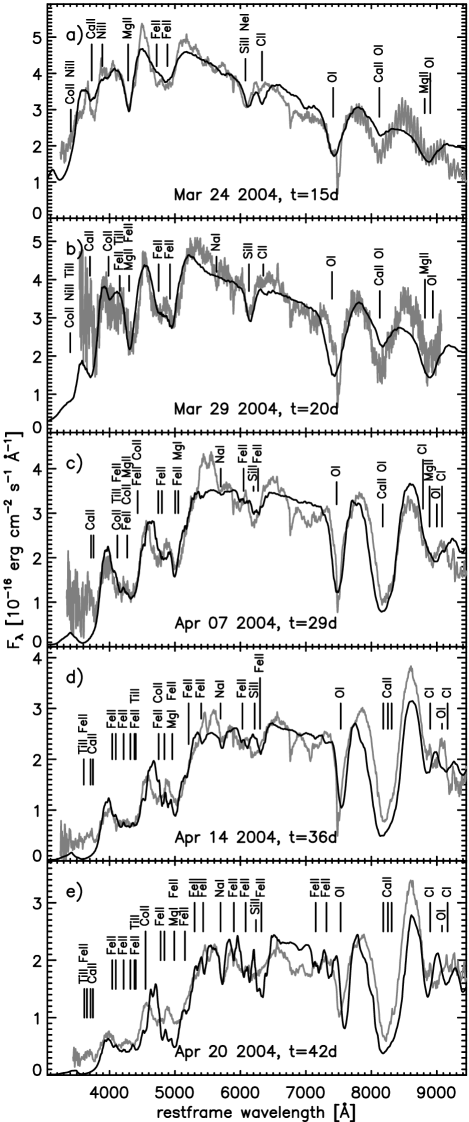
Figure 2 shows our best-fitting model spectra (black lines) compared to the observed spectra (gray lines). This ejecta model has M☉ of material above 5000 km s-1. We also tested ejecta models with different mass in an effort to break the parameter degeneracy that affects the light curve modelling. We found that the SN 2004aw spectra can be reproduced reasonably well only if the density scaling factor of CO21 is between 2 and 4. Models with larger mass have excessively high line velocities which cause the absorption features to appear too broad. In particular, the oxygen line at Å becomes significantly too broad if too much material is present at high velocities. This line is highly saturated and therefore fairly insensitive to the O abundance within reasonable limits, meaning that the strength and shape of the absorption feature is primarily set by the density structure. The lower limit for the mass above any photosphere is constrained by the amount of material needed to generate notable P-Cygni features.
In the following paragraphs we discuss the properties of the individual models in more detail. The primary input parameters for all early-time spectral models are summarized in Table 1.
| Date | ||||
|---|---|---|---|---|
| [d] | [erg/s] | [km/s] | [K] | |
| 24 Mar 2004 | 15 | 11100 | ||
| 29 Mar 2004 | 20 | 9600 | ||
| 07 Apr 2004 | 29 | 8100 | ||
| 14 Apr 2004 | 36 | 6600 | ||
| 21 Apr 2004 | 43 | 5000 |
The first spectrum that we modelled is from March 24, 2004, day after -band maximum and d after explosion. Fig. 2a shows a comparison of the model spectrum to the observed one. The model with erg s-1 and km s-1 reproduces most of the observed features although the re-emission features are not strong enough in some places. All Ca ii absorptions, the H&K feature at Å and the IR triplet at Å, are somewhat weaker in the model than in the observation. To fit these features, however, a much higher Ca abundance would be required which cannot be accommodated by the later spectra. Therefore it is likely that the model at this epoch overestimates the ionization, resulting in too much Ca iii at the expense of Ca ii. The composition used to model this spectrum includes equal parts of O and C ( per cent by mass), per cent Ne, a total of per cent intermediate-mass elements (Mg, Si, S, Ar) including per cent Ca. Additionally, we use per cent Fe-group elements consisting of per cent , per cent “stable” Fe (i.e., Fe not produced via the decay chain) and traces of Ti and Cr.
Figure 2b shows the spectrum on March 29, 2004, compared to the model spectrum. The epoch, days after maximum light, corresponds to d after the assumed explosion date. The model requires a luminosity of erg s-1. The pseudo-photosphere is located at km s-1 with a temperature of K for the underlying blackbody. The composition is similar to the previous model although less stable Fe is needed to match the Fe features because more has decayed to Fe.
The next epoch we modeled is 2004 April 7, 15 days after maximum light and d after explosion (Fig. 2c). The luminosity used in this model is erg s-1 at a photospheric velocity of km s-1. The resulting temperature of the photosphere is K. The shell near the photosphere contains still per cent C and O but somewhat more intermediate-mass elements, and per cent . This spectrum appears to be much redder than the earlier ones. In addition to a lower temperature, blocking by a large number of iron group lines suppresses the UV and blue flux in this and later spectra. The fit to the observed spectrum is acceptable although the double-peaked re-emission features between and Å are too weak in the model. At this and the subsequent epochs the models also fail to reproduce the absorption features around and Å. Based on the models it cannot be uniquely asserted if this discrepancy is due to missing elements in the composition or if the ionization balance is incorrectly determined. The assumption of the thermal photosphere absorption additionally overestimates the flux in this wavelength region.
The following spectrum (Fig. 2d) was taken on 2004 April 14, 22 days after maximum light and d after explosion. The luminosity used here is erg s-1. The photospheric velocity is km s-1, which leads to a blackbody temperature of K. The composition used for this fit is still very similar to the previous epoch, with a slightly higher mass fraction (1.6 per cent). The O i feature at Å appears stronger in the model than in the observation. Unfortunately, the observed spectra show an atmospheric absorption feature at Å which happens to coincide with the O i feature. We decided to use the observed spectrum in which this feature has not been removed because it makes the uncertainty in the shape of the O i absorption more apparent.
The last epoch we modelled with the photospheric method (Fig. 2e) is 20 April 2004, 28 days after maximum light and d after explosion. The model requires a change in the abundance pattern. C and O are reduced to and per cent, respectively, Si is increased to per cent and we require per cent of . The inner boundary of this model is located at km s-1. The overall shape of the spectrum is well reproduced although the velocity of some absorptions is underestimated by the model, indicating that the change in composition may actually occur at somewhat higher velocities than assumed here. The uncertainty in the shape of the density structure in this transition region, however, makes it difficult to find a better match. To improve the fit we used an intermediate shell at km s-1 which allows us to smoothen the transition somewhat, although the lack of an observed spectrum between Apr 14 and 21 leaves this shell relatively unconstrained.
3 Models for the nebular spectra
More information about the properties of the deeper layers of the ejecta can be obtained from nebular-epoch spectra. At late phases, when the optical depth of the ejecta has dropped to below 1, the innermost ejecta produce emission lines, whose strengths and profiles can shed light on the core-collapse process.
The nebular spectra of Type Ic SNe are usually dominated by a strong [O i] 6300, 6364 line, and SN 2004aw is no exception. In the case of the GRB/SN 1998bw, the nebular spectra were used to infer the aspherical distribution of different elements in the ejecta and hence the aspherical nature of the explosion. The narrow [O i] 6300, 6364 line and the contrasting broad [Fe ii] emission suggested a polar-type explosion viewed near the axis (Mazzali et al., 2001; Maeda, 2002). For SN 2003jd, which was luminous but did not show a GRB, the double-peaked profile of the [O i] line witnesses the disc-like distribution of oxygen in an explosion similar to that of SN 1998bw but viewed closer to the equatorial plane (Mazzali et al., 2005).
In contrast, other SNe Ic show no sign of asphericity in their late-time profiles. Examples include a low-energy SN such as SN 1994I (Sauer et al., 2006) and a narrow-lined SN with higher energy such as SN 2006aj (Mazzali et al., 2007).
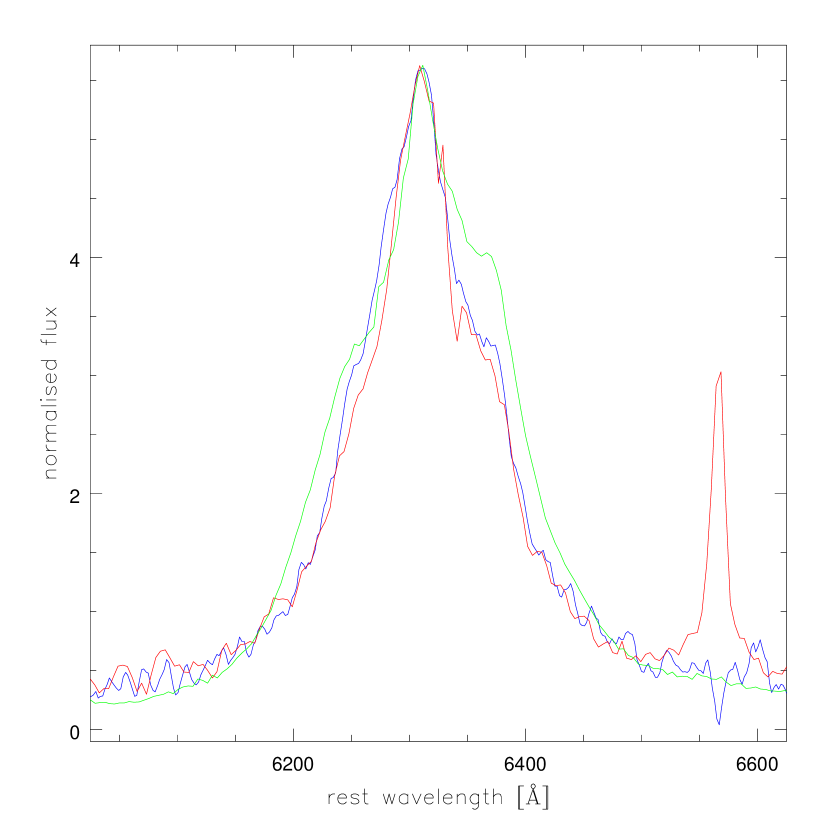
The [O i] 6300, 6364 emission profile in SN 20004aw is remarkably similar to that of SN 1998bw (Figure 3), indicating that SN 2004aw must have been significantly aspherical. A detailed comparison shows that SN 2004aw has a broader emission base, and the narrow core that characterised SN 1998bw emerges only at low velocities. This suggests a similar morphology for the two SNe, but more extreme in SN 1998bw, and a similar viewing angle. Below we attempt to model the nebular spectrum of SN 2004aw in order to define its properties.
Only the first nebular spectrum of SN 2004aw, obtained on 4 Nov 2004, days after maximum, has sufficiently high signal-to-noise ratio that several lines can be detected. The spectrum is shown in Figure 4 along with synthetic models. The emission lines that can be identified are, from blue to red: Mg i] 4571; [Fe ii] multiplets near 5200 Å, the strength of which is related to the peak luminosity of the SN; a weak Na i D line at 5890 Å; the very strong [O i] 6300, 6364 emission; the strong line near 7250 Å, which contains both [Ca ii] 7291, 7320 and [Fe ii] lines; a weaker Ca ii IR triplet near 8600 Å, which also contains some C i.
We modelled the spectrum using a code (Mazzali et al., 2001) that computes -ray and positron deposition following the decay of 56Ni to 56Co and hence to 56Fe, and then balances the collisional heating induced by the thermalisation of the fast particles produced by the deposition with cooling via line emission in non-LTE, following the prescriptions of Axelrod (1980). The code can be used in two modes, as discussed in Mazzali et al. (2007): a one-zone version simply assumes a nebula of constant density, with a sharp outer boundary at a velocity the value of which is selected at input, as are the mass of the nebula and the elemental abundances within it. In a more sophisticated version the code still assumes spherical symmetry but allows for a radial variation of density and composition, and does not require an outer boundary. In this version the diffusion of -rays is followed with a Montecarlo method (Cappellaro et al., 1997). This version is useful to test the prediction of explosion models as well as to investigate the radial distribution of mass and abundances in detail when the observed line profiles are sufficiently well determined.
In order to determine the global properties of the nebular spectrum of SN 2004aw we began by constructing a first, coarse model using the one-zone approach, adjusting the abundances to fit the shape of the prominent emission features. The synthetic spectrum we computed is indicated by a blue dashed line in Figure 4, where it is compared to the observed spectrum (light grey). The darker line represents the observed spectrum that has been smoothed to emphasise emission features especially in the blue. Assuming a typical rise time of 14 days, we used an epoch of 250 days after explosion for the calculation. The outer velocity adopted in the calculation that gives a reasonable fit to most emission lines is km s-1. This shows that the nebular spectra originate in a region deeper than the innermost layers studied by means of early-phase spectroscopy, but the separation between the two regions is small. The mass contained within km s-1 in the model is M⊙. The dominant element is oxygen (1.3 M⊙). The mass of required to reproduce the Fe ii lines and at the same time to excite all other transitions is 0.17 M⊙. This is larger than in the low-mass SN Ic 1994I, and similar to energetic, broad-lined SNe Ic such as 1997ef (Mazzali et al., 2000) or 2006aj (Mazzali et al., 2006b). The carbon mass is small, only 0.2 M⊙, as determined by the strength and shape of the Ca ii-dominated feature near Å. A small C/O ratio is quite common in SNe Ic. The Mg mass is also small, 0.004 M⊙, despite the relative strength of Mg i] Å.
The blue dashed line in the blow-up in Fig. 4 shows in detail the [O i] line in the one-zone model. When the observed line profile is viewed in detail it is clear that it has a composite structure. It shows a broad base, which can be described by a symmetric emission with limiting velocity km s-1, and a narrow core, of width km s-1, superimposed on it. As we showed above, it is similar to the profile observed in SN 1998bw. A similar type of profile was also observed in the BL-SN Ic 2002ap, and it may be interpreted as a signature of asphericity (Mazzali et al., 2007). As discussed in that paper, the profile can be produced by the superposition of a narrow emission core and either a broad, flat-topped profile, which can originate in a shell-like distribution of oxygen, or a double-peaked profile such as what is expected from an equatorial distribution of oxygen viewed on or close to the equatorial plane (Mazzali et al., 2005). The shell+core configuration would be globally spherically symmetric, while the disc+core one would be aspherical. It is not possible to distinguish between these two scenarios based only on the profile of the [O i] line. In the case of SN 1998bw, the simultaneous observation of broad [Fe ii] emission lines favoured the disc+core solution. In the case of SN 2004aw, the Fe lines are not sufficiently well observed for us to be able to determine which scenario is favoured. Still, the similarity of the [O i] profile suggests that the inner parts of SN 2004aw behaved like SN 1998bw. The [O i] emission profile is SN 2002ap was also similar. Interestingly, the [O i] line in SN 2002ap was the broadest of the three SNe. The broad emission base suggests that the intermediate-velocity layers ( km s-1) were more spherical in SN 2002ap than in either SN 1998bw and 2004aw. The weaker central emission core also indocates that any central density enhancement was also less extreme.
An aspherical distribution of matter requires a detailed model of the explosion. Here we used our stratified code to test the spherically symmetric scenario. We used the density and abundance distributions obtained from the modelling of the early-time spectra at velocities down to km s-1, the velocity of the photosphere of the last of the early-time spectra (20 April 2004). Therefore, we freely adjusted both the density and the abundances below that velocity, trying to optimise the detailed fit of the line profiles, and in particular that of [OI] Å and its narrow core.
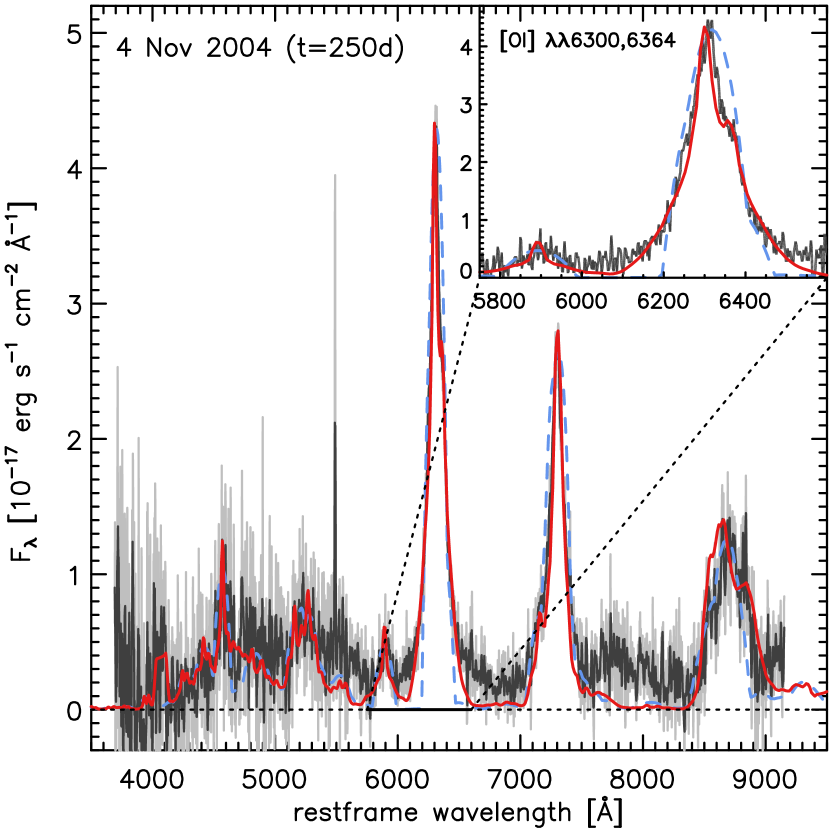
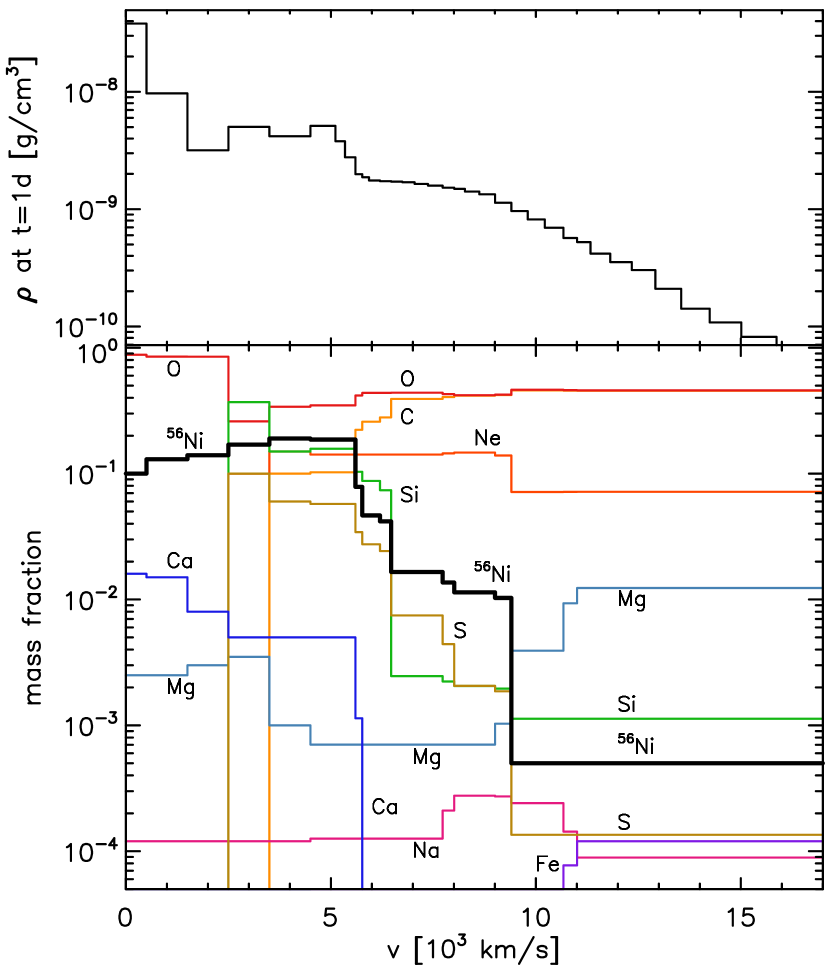
The solid red line in Figure 4 shows the multi-zone synthetic spectrum. The narrow core has a characteristic velocity of km s-1, and there is a clear discontinuity in line emission at velocities between 2000 and km s-1. In order to reproduce such a feature, it was necessary to introduce a discontinuity in the density profile. The density decreases slightly below km s-1, reaching a minimum at km s-1, and then it increases sharply again in deeper layers. This distribution places a core containing M⊙ of material below km s-1. The composition of this core must be dominated by oxygen if the sharp peak of the [OI] line is to be reproduced, but it also must contain in order to excite oxygen. The one-zone model already suggests that a large fraction of the is located at km s-1. As a result, the distribution is smooth, peaking at 4-5000 km s-1, but the distribution of oxygen is bimodal: the O abundance is large outside of km s-1, and again below km s-1. The density structure used to fit the O i feature also produces reasonable fits to the other feature, which however are quite noisy. The nebular model includes a total of of . The total ejected mass is , of which 0.85 M⊙ are located at km s-1.
The density distribution that we finally derived is shown in Figure 5. It shows the sharp increase of density at the lowest velocities, indicating the presence of in inner region dominated by oxygen.
Classical, one-dimensional explosion models do not predict the presence of any material below a minimum velocity, which represents the position of the "mass-cut": material below this mass cut forms the compact remnant and is not ejected. Light curve studies had already suggested the presence of an inner dense core of material in some SNe Ic, in particular the massive and energetic ones linked to gamma-ray bursts (Maeda et al., 2003). The nebular spectra of both SNe 2004aw and 1998bw indicate that the inner region is dominated by oxygen, a constitutent of the stellar core, rather than by products of nucleosynthesis. The most likely explanation for this distribution of mass and abundances is that the low-velocity material was ejected in the low-energy part of an aspherical explosion. In the case of SN 1998bw the entire [O i] profile is sharply peaked, indicating a grossly aspherical explosion, while in the case of SN 2004aw the sharp component of the emission is narrower, suggesting that the asphericity affected only the innermost parts of the ejecta.
4 Bolometric Light Curve
4.1 Construction of the Bolometric Light Curve
We evaluated a pseudo-bolometric light curve of SN2004aw as follows. The magnitudes reported in Table 2 of Taubenberger et al. (2006) were dereddened for Galactic extinction using and the extinction curve of Cardelli et al. (1989) and converted to fluxes according to Fukugita et al. (1995). Note that those magnitudes are all corrected for the contribution of the host galaxy, although this was evaluated with different methods for different telescopes: the KAIT magnitudes were obtained via aperture photometry on template-subtracted images, while for all the rest PSF photometry was used within SNOOPY, which includes a correction for the local background.
The light curves in the and bands cover a much more limited time interval than the ones; therefore, we assumed that their temporal behaviour at epochs where observations are not available follows that of the -band. Similarly, we assumed that the - and -band fluxes at the penultimate and last epochs follow the same general temporal trend as the other optical bands.
The monochromatic light curves were splined with a time resolution of 1 day. The monochromatic fluxes in the various bands were linearly interpolated and extrapolated redwards and bluewards of the - and -band filter boundaries, respectively. Broad-band spectral energy distribution were thus constructed at each epoch and integrated in flux over the range 3000-24000 Å. Any contribution at wavelengths outside the above range was ignored and is likely not to exceed 5-10%. The resulting pseudo-bolometric luminosities corresponding to the epochs of the available photometry are plotted in Figure 6.
In order to estimate the uncertainties, the errors associated with the optical and NIR photometry were propagated by adding them in quadrature. For the epochs where only optical photometry was available, the errors on the NIR photometry were estimated based on the errors at the epochs when data were available.
The resulting light curve is consistent with that reported in Taubenberger et al. (2006) when account is taken of the somewhat different treatment of flux at the boundaries of the wavelength range adopted for integration.
4.2 Light Curve Model
We compare the bolometric light curve obtained as discussed above with models computed with the SN Montecarlo light curve code discussed first in Cappellaro et al. (1997) and expanded in Mazzali (2000). Based on a density structure and a composition, the code computes the propagation and deposition of gamma-rays and positrons (using the same description as the nebular spectrum code), transforms the deposited energy into radiation and follows the propagation of the optical photons in the expanding ejecta. Although it is based on simple assumptions about the opacity (Mazzali, 2000; Hoeflich et al., 1995) it does yield a reasonable representation of the bolometric light curve (e.g. Mazzali et al., 2013).
A synthetic bolometric light curve was computed for the ejecta density and abundance distribution that was obtained from spectral modelling as outlined above. Above 5000 km s-1 the model is a scaled-up version of model CO21, which gave good fits to SN 1994I. The photospheric spectra of SN 2004aw resemble those of SN 1994I at similar epochs (with respect to the -band maximum), apart from having higher line velocities. This suggests a similar density structure and a similar mass-to-kinetic energy ratio for both SNe for the part of ejecta that is responsible for spectral lines in the photospheric phase. Below 5000 km s-1, however, we adopted the density derived in Sec. 3 to reproduce the nebular spectra. The resulting explosion model has an ejected mass of M⊙, an energy erg, and a 56Ni mass of M⊙.
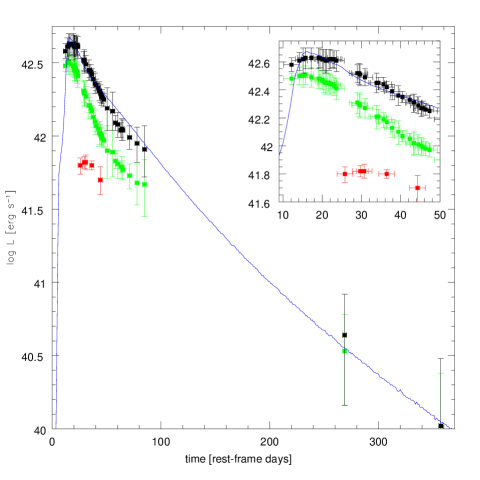
Figure 6 shows the synthetic bolometric light curve compared to the observed one constructed as described above. The final bolometric light curve uses as reference the time of maximum, since the time of the explosion is not accurately known. Bolometric maximum occurs 1-3 days after -band maximum according to our calculation. A pre-discovery limit was obtained on 2004 Mar 13, which precedes -band maximum by 10 days. The light curve of SN 2004aw is relatively broad for a SN Ic. The rise time of the -band light curve is days for the GRB/SN 1998bw (Galama et al., 1998) and days for the XRF/SN 2006aj (Pian et al., 2006), whose explosion dates are known from the accompanying GRBs. In previous theoretical studies of Type Ic SNe the assumed (or model-constrained) rise time days for SN 1994I (Iwamoto et al., 1994; Baron et al., 1999; Sauer et al., 2006) and for SN 2002ap (Mazzali et al., 2002), and as much as 20 days for SN 1997ef (Mazzali, 2000). In the case of SN 2004aw a rise time of 14 observed days is used, which matches the epoch of bolometric maximum in the synthetic light curve.
Although the model does not capture all undulations in the observed light curve, it does reproduce its overall flux level and the time of maximum, indicating that the model that was used has reasonable values of mass, energy, and 56Ni mass. We take this as a confirmation of the spectroscopic results. A possible reason for the discrepancies is the approximate treatment of the (gray) opacity, but this was not an issue in other cases (e.g. Mazzali et al., 2013). Another possible source of uncertainty is that we based our calculations on a rescaled rather than a real explosion model, and this rescaling was significant. Thus our model may not fully capture the properties of a significantly more massive explosion. We therefore use generous error bars on our estimates of mass and velocity.
We can conservatively estimate that, in order to reproduce the bolometric light curve of SN 2004aw, the ejecta mass should be in the range M⊙. For smaller masses we can expect the peak to occur too early, while for larger masses the opposite would be the case.
5 Discussion and Conclusions
Our models suggest that SN 2004aw was the explosion of a massive C+O star that ejected M⊙ of material. If we consider a range of possible remnant masses, from a neutron star with mass 1.5 M⊙ up to a black hole with mass 3 M⊙ this leads to an exploding CO core of M⊙. This points to a progenitor star of M⊙, in the context of the pre-supernova evolution models of Nomoto & Hashimoto (1988) and Hashimoto (1995) (see also Woosley & Weaver 1986). The estimate of may be modified if the large mass-loss required to remove the H and He envelopes is taken into consideration. For massive single stars, this strongly depends on the uncertain, mass-dependent mass-loss rate in the Wolf-Rayet stage. For example, Woosley et al. (1993, 1995) found that all their models with M⊙ evolve to a narrow final C+O core mass range of M⊙ which may be marginally compatible with SN 2004aw. In contrast, Pols & Dewi (2002) obtained a final C+O core mass in excess of 10 M⊙ for M⊙ at solar metallicity, adopting updated mass-loss rates, while models with M⊙ retain a substantial He envelope before explosion. Near-infrared data of SN 2004aw (Taubenberger et al., 2006) clearly rule out the presence of significant amounts of He (Hachinger et al., 2012). SN 2004aw may have been the outcome of common envelope evolution in a massive close binary, a scenario first proposed by Nomoto et al. (1994, 1995) for Type Ic SNe in general and SN 1994I in particular. This was developed for low-mass SNe Ic but it may also work at large masses. Alternatively, binary evolution with stable mass transfer may lead to a C+O progenitor, but this mechanism may work only at lower masses than what is required for SN 2004aw (Yoon, 2015). At high masses, Wolf-Rayet wind mass-loss may strip stars of their outer H and He envelopes and produce the progenitors of massive SNe Ic.
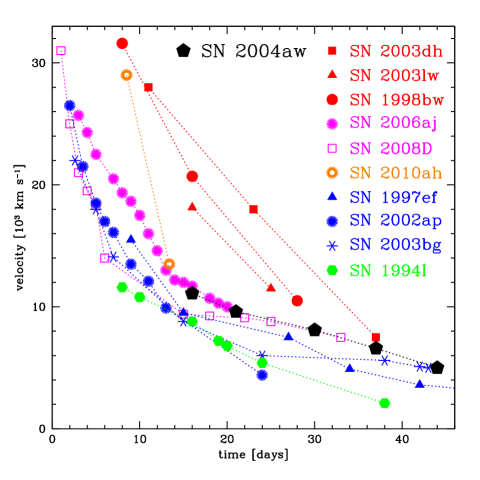
The explosion of SN 2004aw was moderately energetic, resulting in a kinetic energy erg. The ratio of kinetic energy and ejected mass is erg/M⊙], similar to low-energy explosions such as SN 1994I (Sauer et al., 2006) and significantly smaller than that of low-mass hypernovae such as SN 2002ap (Mazzali et al., 2002). SN 2004aw is often referred to as a broad-lined SN Ic, even though its early-time spectra are quite different from those of hypernovae such as SN 2002ap (Taubenberger et al., 2006) and very similar to those of a low-mass SN Ic like SN 1994I. In Figure 7 we examine the behaviour of the model photospheric velocity as a function of time compared to other SNe Ib/c with similar modelling. We do not use observed line velocities as those measurements can be highly uncertain because of line blending and broadening, and because line absorption happens at different velocities for different lines. SN 2004aw has no early information but at the times when it was observed the photospheric velocity follows the behaviour of SNe like 2006aj or 2008D, which do not have a very large . SN 2004aw also follows the behaviour of SN 1994I, although it does so at higher velocities.
Could the earlier spectra of SN 2004aw have shown broad lines? We mentioned above that the presence of broad lines is mostly the result of the density slope in the outermost layers. We can modify the density slope in the outermost layers, and test what the spectrum would have looked like at an epoch preceding the observed ones, making sure that the modification does not affect the earliest available spectrum.
Figure 8 shows the density profiles we have used. We modified the density only above km s-1 in order not to affect the models corresponding to epochs where observations exist showing that the lines are not broad. The modified models have different density power-law indices above that velocity, as marked in the figure. Figure 9 shows the spectra at 7 days after explosion. Spectra computed with increasingly flatter slopes show broader lines. These lines eventually blend, reducing the number of observed features, as described in Prentice & Mazzali (2017). Figure 10 shows the spectra at 15 days after explosion. At this epoch all spectra are basically the same, showing that changing the outer density slope at high velocity has no impact at later times.
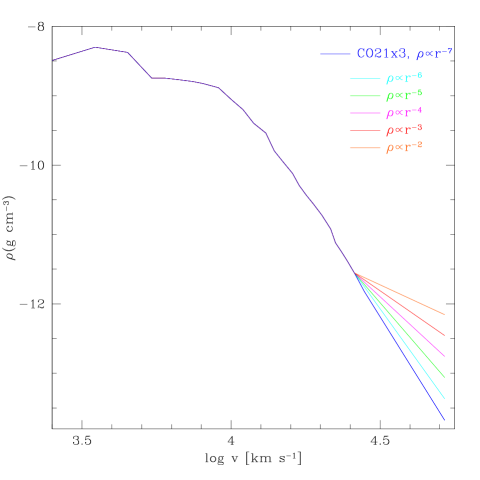
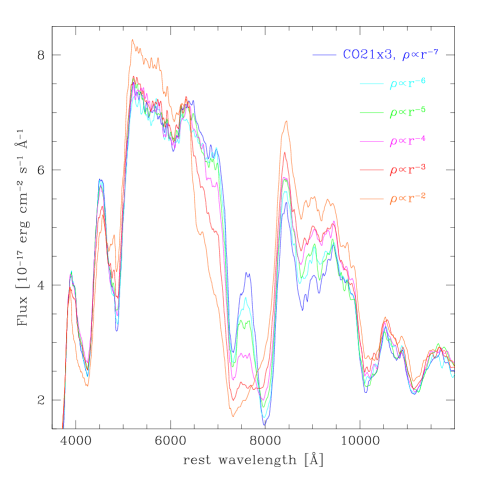
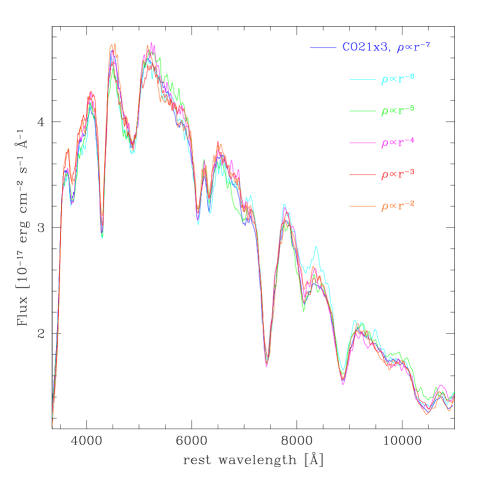
The models we computed all have M⊙, but vary in from erg for model CO21x3, which has the steepest outer density slope, to erg for the model with outer density slope power-law index . The ratio / ranges therefore from to , which spans some of the range of observed SN Ib/c properties, although it does not reach the highest values. If / was larger the spectrum at 15 days would be affected. This sets the uncertainty on the estimate for SN 2004aw, and it is an uncertainty that should be applied to all narrow-line SNe Ib/c with no early data. It also affects the detailed classification of the SN, as the number of lines, which is 6 at maximum, can be anything between 4 and 6 one week earlier Prentice & Mazzali (2017).
Given these uncertainties, we can conservatively estimate that SN 2004aw ejected M⊙ of material with a kinetic energy erg.
The value of determined from modelling, although not as extreme as the ergs of hypernovae, is probably too large for the canonical “delayed neutrino-heating” SN mechanism taking place in a proto-neutron star (Janka et al., 2007). In fact, the ZAMS mass range of M☉ spans the putative upper boundary for neutron star formation at the end of core collapse and a black hole may be preferred (Fryer, 1999). However, doubts have been cast on the sharpness of this separation (Ugliano et al., 2012). If the progenitor core did collapse to a black hole, the SN explosion could have been set off by a central engine comprising of the black hole and an accretion disk as proposed in the collapsar model, providing that the progenitor star was rotating rapidly (MacFadyen & Woosley, 1999). On the other hand, if the result of the collapse was a neutron star, the explosion could have been aided by a magnetar, which may have injected energy into the SN ejecta, contributed to the synthesis of 56Ni, or both (Mazzali et al., 2006a, 2014). Fryer & Young (2007) simulated the core collapse of a 23 M☉ star and found a long delay to explosion, which may allow time for large magnetic fields to develop in the proto-neutron star.
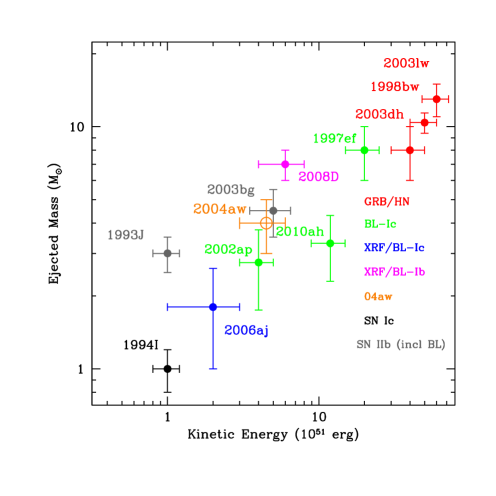
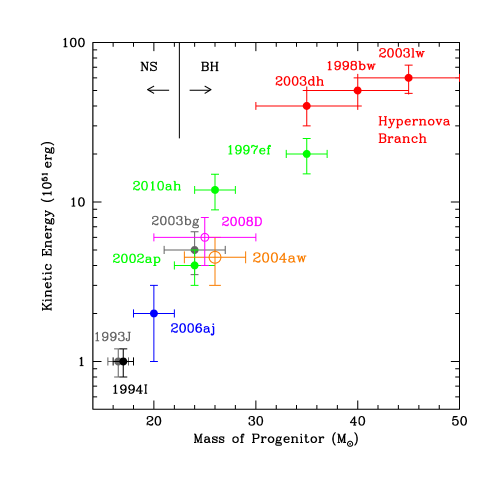
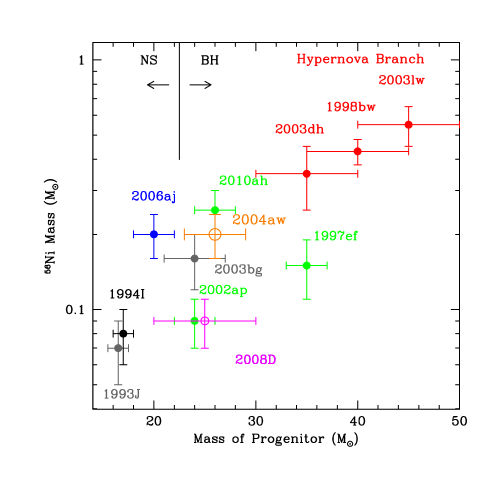
Adding SN 2004aw to the plots showing the main properties of SNe Ib/c that have been modelled in detail (Figure 11), we see that it confirms the trend for increasing with increasing ejected mass. This plot is affected for some SNe by the presence of an outer He shell (SNe Ib) as well as some H (SNe IIb). We can however use the mass of the CO core to reconstruct the ZAMS mass of the progenitor. Such a plot (Figure 12) shows a more linear relation between and progenitor mass, although there seems to be some spread in the value of at progenitor masses between and 30 M⊙. Among SNe in this mass range that have been studied, SN 2004aw has one of the smallest ratios of per inferred progenitor mass, and it is in fact the only one that does not show broad lines in its spectra.
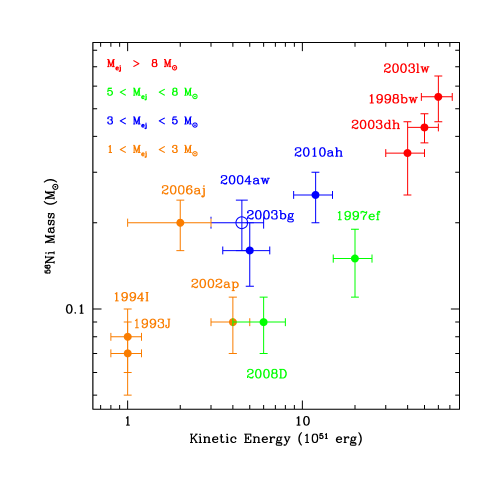
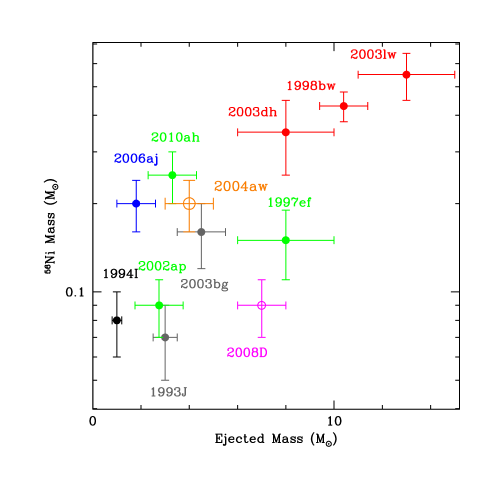
An amount of M☉ of 56Ni was ejected to power the light curve of SN 2004aw. Allowing for the uncertainties in the adopted distance modulus and total reddening (Taubenberger et al., 2006) this value may vary from to 0.25 M☉. This value lies between the M☉ 56Ni of the three hypernovae connected with classical long GRBs (SNe 1998bw, 2003dh, and 2003lw; Nakamura et al. 2001; Deng et al. 2005; Mazzali et al. 2006b) and the M☉ of the low-energy SN Ic 1994I (Iwamoto et al., 1994) but also of SN 2002ap (Mazzali et al., 2002; Tomita et al., 2006). On the other hand, it is comparable to the value inferred for the Type Ic SN 2006aj, which was accompanied by X-ray Flash 060218 and for the non-GRB hypernova SN 1997ef. SN 2006aj has been modelled to have had ergs and was suggested to have been a magnetar-induced explosion of a star of M☉ (Mazzali et al., 2006a), while SN 1997ef had M☉ and ergs (Iwamoto et al., 2000; Mazzali et al., 2004). The production of explosively synthesized 56Ni appears broadly to increase with explosion energy (Figure 13) as well as with ejected mass (Figure 14), and the relation gets tighter if inferred progenitor mass is used, which eliminates the influence of the outer stellar envelopes on the mass estimate (Figure 15). Still, in the range of values where SN 2004aw is located there is significant dispersion. Several factors may be at play: in SN 2006aj magnetar energy may have contributed to increasing the 56Ni production. In the case of a massive progenitor such as that of SN 1997ef, fallback onto a black hole may have limited the amount of 56Ni that finally was ejected. Other parameters, such as binarity, rotation, metallicity, and asymmetry, may affect the outcome of the explosion. This highlights how little we still know about SN Ib/c explosions.
The properties of stripped-envelope core-collapse SNe seem particularly diverse in the progenitor mass range M☉. While the XRF-SN 2006aj is strikingly similar to SN 2002ap in light curves and spectra, SN 2002ap has no GRB association at all despite being one of the best-observed SNe Ic.
The Type Ib SN 2008D, was captured by the Swift X-Ray Telescope at its very initial flash of soft X-rays (Soderberg et al., 2008) and was soon confirmed in the optical (Deng & Zhu, 2008). With the nature of its initial flash under debate, spectrum and light curve modelling suggests that it had a progenitor with M☉ (Mazzali et al., 2008; Tanaka et al., 2009). Another peculiar SN Ib was 2005bf ( M☉; Tominaga et al. 2005) whose composite light curve reached a first peak compatible with moderate 56Ni production and then rose for as long as days to reach a second peak, which would require M☉ 56Ni. Late-time observations showed that the light curve then traced back the predicted extension of a normal-luminosity SN, suggesting that the second peak was due to the late injection of magnetar energy (Maeda et al., 2007).
Although our models are one-dimensional, asphericity would probably not change our results much. Asphericity was observed in some Type Ic SNe with no GRB connection, first using polarimetric measurements (e.g., Wang et al. 2001; Kawabata et al. 2002), and then also through revealing line profiles in nebular spectra (e.g, Mazzali et al. 2005; Maeda 2008). The asphericity in SN 2004aw is significant, but it appears to be confined to the deepest layers of the SN ejecta, while in SN 1998bw it affected probably the entire SN ejecta. As already mentioned, what is suggested by the nebular spectra of SN 2004aw is an explosion that was fairly spherical in the outer layers, but significantly aspherical in the deepest parts. It may heve been the result of a magnetar or a collapsar which did not inject enough energy to modify the entire SN structure, but did leave an imprint in the regions close to the site of collapse. This may be related to the fact that SN 2004aw had a smaller mass than any GRB/SN. Studies of further examples of energetic SNe Ic are required in order to further our understanding the presence and impact of an engine.
Acknowledgments
We gratefully acknowledge convertations with G. Meynet during the KITP 2017 Programme on Massive stars. ST acknowledges support by TRR33 “The Dark Universe” of the German Research Foundation.
References
- Abbott & Lucy (1985) Abbott, D.C., Lucy, L.B., 1985, ApJ, 288, 679
- Ashall et al. (2017) Ashall C., et al., 2017, preprint (arXiv:1702.04339)
- Axelrod (1980) Axelrod T., 1980, Ph.D. thesis, Univ. California, Santa Cruz
- Baron et al. (1999) Baron, E., Branch, D., Hauschildt, P.H., Filippenko, A.V., Kirshner, R.P. 1999, ApJ, 527, 739
- Ben-Ami et al. (2012) Ben-Ami, S., et al. 2012, ApJ, 760, L33
- Bianco et al. (2014) Bianco F. B., et al. 2014, ApJ, 213, 19
- Cappellaro et al. (1997) Cappellaro, E., Mazzali, P. A., Benetti, S., Danziger, I. J., Turatto, M., della Valle, M. & Patat, F. 1997, A&A, 328 , 203
- Cardelli et al. (1989) Cardelli, J. A., Clayton, G. C., & Mathis, J. S. 1989, ApJ, 345, 245
- Clocchiatti & Wheeler (1997) Clocchiatti, A., Wheeler, J.C., 1997, ApJ, 491, 375
- Deng et al. (2005) Deng, J., Tominaga, N., Mazzali, P.A., Maeda, K., Nomoto, K. 2005, ApJ, 624, 898
- Deng & Zhu (2008) Deng, J., Zhu, Y. 2008, GCN, 7160
- Eldridge et al. (2013) Eldridge J. J., Fraser M., Smartt S. J., Maund J. R., Crockett R. M., 2013, MNRAS, 436, 774
- Filippenko (1997) Filippenko, A. V., 1997, ARA&A, 35, 30
- Fryer (1999) Fryer, C.L., 1999, ApJ, 522, 413
- Fryer & Young (2007) Fryer, C.L., Young, P.A. 2007, ApJ, 659, 1438
- Fryer et al. (2007) Fryer, C.L., et al., 2007, PASP, 119, 1211
- Fukugita et al. (1995) Fukugita, M., Shimasaku, K., & Ichikawa, T., 1995, PASP, 107, 945
- Galama et al. (1998) Galama, T.J., et al., 1998, Nature, 395, 670
- Greiner et al. (2015) Greiner J. et al., 2015, Nature, 523, 189
- Hachinger et al. (2012) Hachinger, S., Mazzali, P. A., Taubenberger, S., Hillebrandt, W.; Nomoto, K.; Sauer, D. N. 2012, MNRAS, 422, 70
- Hashimoto (1995) Hashimoto, M., 1995, Prog. Theor. Phys., 94, 663
- Hoeflich et al. (1995) Hoeflich, P., Khokhlov, A. M., & Wheeler, J. C. 1995, ApJ, 444, 831
- Iwamoto et al. (1994) Iwamoto, K., Nomoto, K., Hoflich, P., Yamaoka, H., Kumagai, S., Shigeyama, T. 1994, ApJ, 437, L115
- Iwamoto et al. (1998) Iwamoto, K., et al., 1998, Nature, 395, 672
- Iwamoto et al. (2000) Iwamoto, K., et al., 2000, ApJ, 534, 660
- Janka et al. (2007) Janka, H.-Th., Langanke, K., Marek, A., Martínez-Pinedo, G., Müller, B. 2007, Phys. Rep., 442, 38
- Kawabata et al. (2002) Kawabata, K.S., et al., 2002, ApJ, 580, L39
- Kawabata et al. (2003) Kawabata, K.S., et al., 2003, ApJ, 593, L19
- Lucy (1999) Lucy, L.B., 1999, A&A, 345, 211
- Lyman et al. (2016) Lyman J. D., Bersier D., James P. A., Mazzali P. A., Eldridge J. J., Fraser M., Pian E., 2016, MNRAS, 457, 328
- MacFadyen & Woosley (1999) MacFadyen, A.I., Woosley, S.E., 1999, ApJ, 524, 262
- Maeda (2002) Maeda, K., Nakamura, T., Nomoto, K., Mazzali, P.A., Patat, F., Hachisu, I., 2002, ApJ, 565, 405
- Maeda et al. (2003) Maeda, K., Mazzali, P. A., Deng, J., Nomoto, K., Yoshii, Y., Tomita, H., Kobayashi, Y., 2003, ApJ, 593, 931
- Maeda et al. (2007) Maeda, K., et al. 2007, ApJ, 666, 1069
- Maeda (2008) Maeda, K., et al., 2008, Science, 29, 1220
- Matheson et al. (2001) Matheson T., Filippenko A. V., Li W., Leonard D. C., Shields J. C., 2001, AJ, 121, 1648
- Maurer et al. (2010) Maurer, J. I., et al. 2010, MNRAS, 402, 161
- Mazzali (2000) Mazzali, P.A., 2000, A&A, 363, 705
- Mazzali & Lucy (1993) Mazzali, P.A., Lucy, L.B. 1993, A&A, 279, 447
- Mazzali et al. (2000) Mazzali, P. A., Iwamoto, K., & Nomoto, K. 2000, ApJ, 545, 407
- Mazzali et al. (2001) Mazzali, P.A., Nomoto, K., Patat, F., Maeda, K., 2001, ApJ, 559, 1047
- Mazzali et al. (2002) Mazzali, P.A., et al., 2002, ApJ, 572, L61
- Mazzali et al. (2004) Mazzali, P.A., Deng, J., Maeda, K., Nomoto, K., Filippenko, K., Matheson, T., 2004, ApJ, 614, 858
- Mazzali et al. (2005) Mazzali, P.A., et al., 2005, Science, 308, 1284
- Mazzali et al. (2006a) Mazzali, P.A., et al., 2006a, ApJ, 645, 1323
- Mazzali et al. (2006b) Mazzali, P.A., et al., 2006b, Nature, 442, 1018
- Mazzali et al. (2007) Mazzali, P. A., Foley, R. J., Deng, J., et al. 2007, ApJ, 661, 892
- Mazzali et al. (2007) Mazzali, P.A., et al., 2007, ApJ, 670, 592
- Mazzali et al. (2008) Mazzali, P.A., et al., 2008, Science, 321, 1185
- Mazzali et al. (2010) Mazzali, P. A., Maurer, I., Valenti, S., Kotak, R., & Hunter, D. 2010, MNRAS, 408, 87
- Mazzali et al. (2013) Mazzali, P. A., Walker, E. S., Pian, E., Tanaka, M.,; Corsi, A., Hattori, T., Gal-Yam, A., 2013, MNRAS, 432, 2463
- Mazzali et al. (2014) Mazzali, P. A., Sullivan, M., Hachinger, S., et al. 2014, MNRAS, 439, 1959
- Modjaz et al. (2016) Modjaz M., Liu Y. Q., Bianco F. B., Graur O., ApJ, 832, 108
- Nakamura et al. (2001) Nakamura, T., Mazzali, P.A., Nomoto, K., Iwamoto, K., 2001, ApJ, 550, 991
- Nomoto & Hashimoto (1988) Nomoto, K., Hashimoto, M., 1988, Phys. Rep., 163, 13
- Nomoto et al. (1994) Nomoto, K., Yamaoka,H., Pols, O.R., van den Heuvel, E.P.J., Iwamoto, K., Kumagai, S., Shigeyama, T., 1994, Nature, 371, 227
- Nomoto et al. (1995) Nomoto, K., Iwamoto, K., Suzuki, T., 1995, Phys. Rep., 256, 173
- Pian et al. (2006) Pian, E., et al., 2006, Nature, 442, 1011
- Pols & Dewi (2002) Pols, O.R., Dewi, D.M., 2002, PASA, 19, 233
- Prentice et al. (2016) Prentice S. J., et al., 2016, MNRAS, 458, 2973
- Prentice & Mazzali (2017) Prentice S. J., & Mazzali, P. A., 2017, MNRAS, in press (arXiv:1704.08298)
- Richmond et al. (1996) Richmond, M.W., et al., 1996, ApJ, 111, 327
- Sauer et al. (2006) Sauer, D.N., Mazzali, P.A., Deng, J., Valenti, S., Nomoto, K., Filippenko, A.V., 2006, MNRAS, 369, 1939
- Soderberg et al. (2008) Soderberg, A.M., et al., 2008, Nature, 453, 469
- Stehle et al. (2005) Stehle, M., Mazzali, P.A., Benetti, S., Hillebrandt, W., 2005, MNRAS, 360, 1231
- Taddia et al. (2015) Taddia F., et al., 2015, A&A, 574, A60
- Tanaka et al. (2009) Tanaka, M., et al. 2009, ApJ, 692, 1131
- Taubenberger et al. (2006) Taubenberger, S., et al., 2006, MNRAS, 371, 1459
- Tominaga et al. (2005) Tominaga, N., et al., 2005, ApJ, 633, L97
- Tomita et al. (2006) Tomita, H., et al., 2006, ApJ, 644, 400
- Ugliano et al. (2012) Ugliano, M., Janka, H.-T., Marek, A., & Arcones, A. 2012, ApJ, 757, 69
- Valenti et al. (2008) Valenti, S., et al., 2008, MNRAS, 383, 1485
- Wang et al. (2001) Wang, L., Howell, D.A., Höflich, P., Wheeler, J.C., 2001, ApJ, 550, 1030
- Woosley & Bloom (2006) Woosley, S.E., Bloom, J.S., 2006, ARA&A, 44, 507
- Woosley & Weaver (1986) Woosley, S.E., Weaver, T.A., 1986, ARA&A, 24, 205
- Woosley et al. (1993) Woosley, S.E., Langer, N., Weaver, T.A., 1993, ApJ, 411, 823
- Woosley et al. (1995) Woosley, S.E., Langer, N., Weaver, T.A., 1995, ApJ, 448, 315
- Yoon (2015) Yoon, S.-C., 2015, PASA, 32, 15