Local magnetic measurements of permanent current paths in a natural graphite crystal
Abstract
A recently reported transition in the electrical resistance of different natural graphite samples suggests the existence of superconductivity at room temperature. To check whether dissipationless electrical currents are responsible for the trapped magnetic flux inferred from electrical resistance measurements, we localized them using magnetic force microscopy on a natural graphite sample in remanent state after applying a magnetic field. The obtained evidence indicates that at room temperature a permanent current flows at the border of the trapped flux region. The current path vanishes at the same transition temperature K as the one obtained from electrical resistance measurements on the same sample. The overall results support the existence of room-temperature superconductivity at certain regions in the graphite structure and show that the used method is suitable to localize the superconducting regions.
To prove the existence of superconductivity in certain small regions of a macroscopic sample, usual experimental methods that show zero electrical resistance and/or magnetic flux expulsion are not always well suitable. This is the case where the superconducting regions are localized within a two-dimensional interface at which no easy access for direct electrical contacts to the regions of interest is possible. Moreover, if the size of the superconducting regions is much smaller than the effective London penetration depth, in addition to demagnetization effects, the flux expulsion, i.e. the Meissner effect, might be immeasurable. In this case, an alternative proof for the existence of superconductivity can rely on the observation of dissipationless currents that maintain a magnetic flux trapped at certain regions of the sample or interface. Recently published resultsPrecker et al. (2016) suggest that graphite samples show a superconducting-like transition at surprisingly high transition temperatures K. The observation of Bragg peaks in X-ray diffraction (XRD) measurements corresponding to the two possible stacking orders of graphite, rhombohedral and hexagonal, suggests their interfaces as the regions where superconductivity can be localizedMuñoz et al. (2013); Volovik (2013); Peotta and Törmä (2015); Heikkilä and Volovik (2016) due to existence of flat bandsFeng et al. (2012); Coletti et al. (2013); Pierucci et al. (2015).
The sample used was cut from a large natural graphite sample from a mine in Sri Lanka. Before we started the MFM measurements, the sample was previously characterized with the electrical resistance four-terminals measurements. The temperature dependence of the resistance and of the remanence (three point measurements) after applying a certain magnetic field, agree with published results for similar samples, see Precker et al. (2016). According to XRD measurements, the sample has two well defined stacking orders, i.e. Bernal and rhombohedral order Precker et al. (2016). This implies that interfaces between the two stacking orders exist inside the sample, as TEM pictures indicate Precker et al. (2016); Barzola-Quiquia et al. (2008). In addition, interfaces between two crystalline regions of similar stacking order, but which are rotated around the a common -axis, are possible. The two phases and the interfaces have large influence on the electrical transport properties Zoraghi et al. (2017).
For the localization of dissipationless currents in a graphite sample produced after we remove an applied magnetic field on the sample in the zero field cooled (ZFC) state, we selected an available magnetic force microscope (MFM) Nanoscope IIIa from Digital Instruments, which provides images of a phase signal proportional to the second derivative of the stray field component, see, e.g., Kirtley (2010). Tapping mode is used to obtain the topography, the tip is then raised just above the sample such that a constant separation between sample and tip is maintained. The scan height was kept at 200 nm for all measurements. (local stray field gradient resolution is roughly equal to the lift height). Furthermore, parameters such as tip velocity were chosen such that striking of the tip on the surface was avoided. A commercial MFM tip was used, the details of the tip are: force constant: N/m; resonant frequency: kHz; nominal tip radius: nm; magnetic moment: Am2; magnetic/reflective coating: CoCr. For the resistance measurements an AC LR700 bridge (four-terminal sensing) was used with a current peak amplitude of 0.3 mA.
In order to carry out the temperature dependent MFM measurements from 290 K to 400 K, a special Cu-plate sample holder was prepared with a heater and a thermometer at the bottom area. The Cu-plate as well as the sample were connected to ground. The substrate with the sample was fixed using varnish at the upper part of the Cu-plate. The temperature was increased such that there was no overshoot, and kept at constant value throughout the measurements. After the measurements at the maximum temperature were done, the sample was cooled to room temperature without any application of a magnetic field. No phase shift has been detected in this state. Furthermore, a new tip was installed and the sample was scanned again with the same result. Therefore, we rule out the possibility of ferromagnetic order in the sample.
A calibration of the MFM tip response has been done introducing an electrical current on Au loops of ring geometry of m width and m diameter patterned by electron beam lithography. The dependence of the phase signal on current and scan height were monitored, in order to obtain the effective magnetic moment and tip-dipole distance Kong and Chou (1997); Baumeister et al. (1992). This can be used to give only a rough estimation of the magnetic field, as the magnetic decay length of the sample is unknown. The high temperature measurements have been done using the same current Au-loop to test the response of the MFM tip.
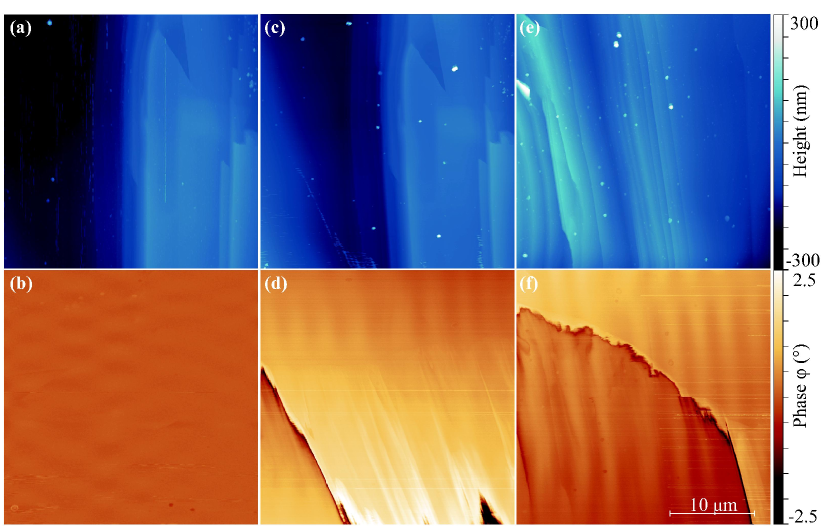
The very first MFM measurements were done with the sample in the virgin state. For that the sample was heated to 390 K and cooled down at zero applied field to 293 K. Figure 1(a) and (b) show the topography and the phase in the maximal scan area m2 of the sample surface in our device. The phase signal, see Figure 1(b), does not show any peculiarity, but a nearly constant phase value. Different MFM scans of the sample in this virgin state in a larger area of m2 provided similar results, independently of the sample surface topography. Within experimental resolution, this result indicates the absence of surface stray fields and rules out the possible existence of magnetic order with magnetic domains or stray fields at certain topographic peculiarities of the sample. After applying a magnetic field of T amplitude and normal to the sample main area, using a permanent magnet, the topography and the phase were measured in the same area and shown in Figure 1(c,d). Whereas the topography remains the same, as expected, there is a clear feature in the phase, which indicates the existence of a current path as will become clear below. Figure 1(e,f) show the topology and the phase signal after application of the magnetic field of another m2 area of the sample surface. One can realize that there is no relationship between the topology and the phase signal art .
[t]
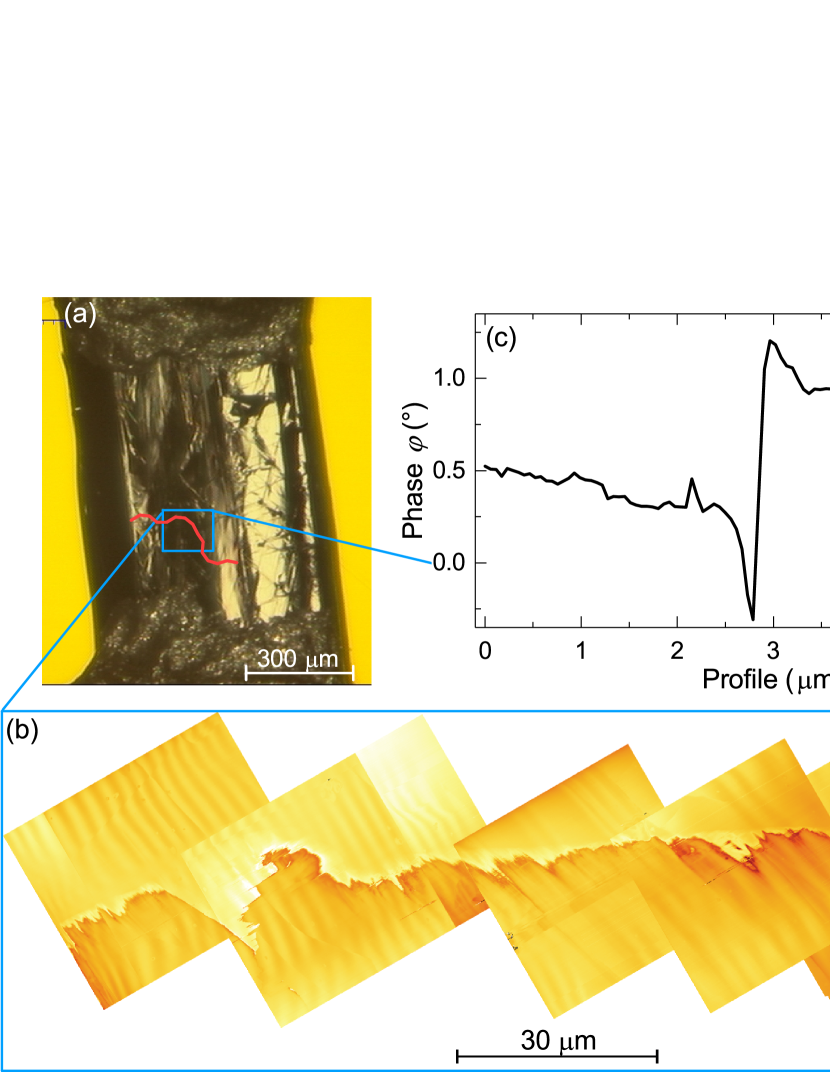
Figure 2(a) shows an optical photo of the sample with its two voltage electrodes at the top and bottom. The red line in the middle indicates the position of the current path identified by the MFM measurements. Figure 2(b) shows the phase result in a small portion of this path. We note that the localization and the measurement of this path took about 6 weeks of continues measurements (each picture with high resolution and of m3 area takes about day). A line profile of the phase as a function of position obtained scanning perpendicular through the path (indicated by the straight black line at the right of Figure 2(b)) is given in Figure 2(c). This phase signal around the edge region of the phase feature observed at remanence, after applying a magnetic field, indicates the existence of a current lineKirtley (2010). Moreover, the difference in the phase between the right and left region from the current line indicates the existence of a magnetic field of the order of mT, following the calibration of the same MFM tip done with Au current loops.
The finite magnetic field enclosed by a persistent current line implies the existence of a current loop in the sample. The reason why we could not measure it completely after 6 weeks of measurements is related to the cragged topography of the sample at the two edges of the red path seen in Figure 2(a). Therefore, we decided to measure the temperature dependence of the phase of the current line and compare it with the electrical resistance results obtained in the same sample as a function of temperature between 290 K and 390 K.
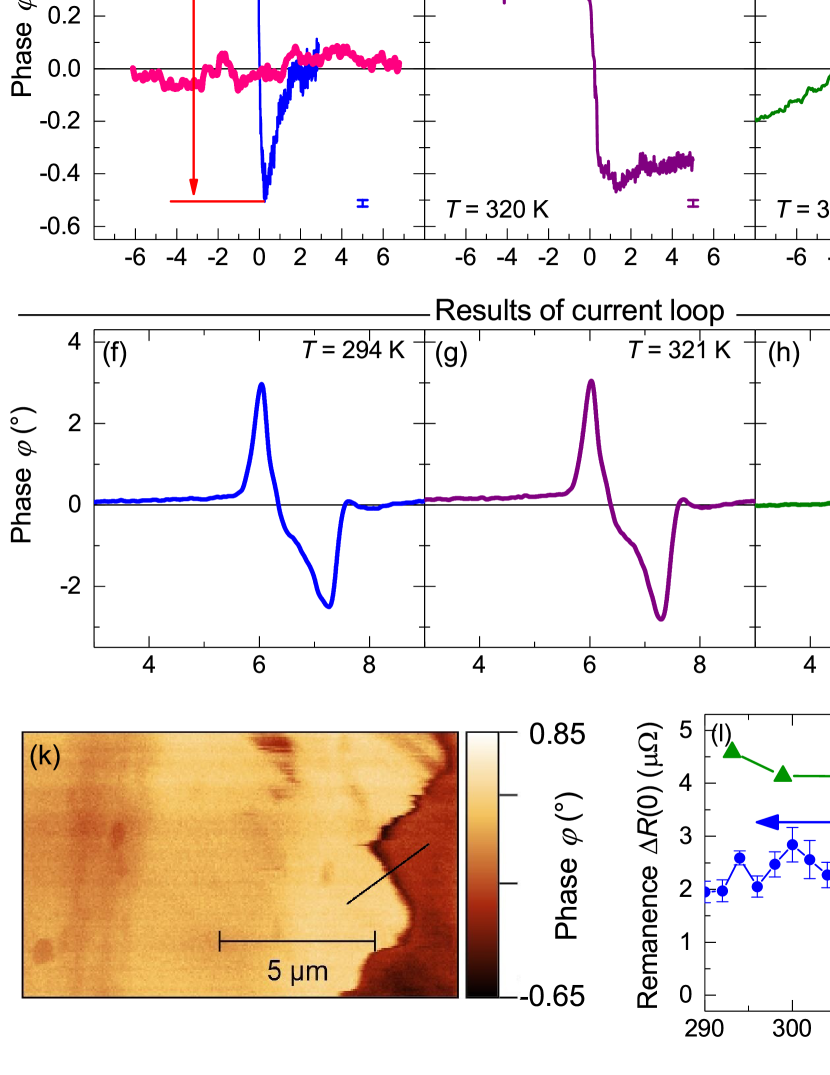
Figures 3(a)–(e) show the phase line scan through the black straight line shown in the phase MFM picture in Figure 3(k) at different constant temperatures of the sample. Defining as indicated in Figure 3(a), which is proportional to the current amplitude, we plot it as function of temperature in Figure 3(l) (green triangles). The temperature, at which this amplitude vanishes, agrees very well with the electrical resistance measurement as function of temperature at zero field, as well as with the remanence of the resistance . This electrical resistance remanence is defined Precker et al. (2016) as the difference between the resistance measured at zero field after applying a field of 0.03 T normal to the main surface of the sample , and the measured resistance of the sample in the virgin state obtained after zero-field cooling from 390 K. The three curves in Figure 3(l) indicate a critical temperature of K with a transition width K. After crossing from below and after ZFC to 293 K, the MFM measurement of the sample does not show any feature at the same position (see magenta line in Figure 3(a)). This vanishing of the remanence at the same transition temperature obtained by the resistance measurements, clearly indicates that the origin of the current line is intimately related to the phenomena we measured from the electrical resistance.
The fact that this current line obtained from the MFM phase signal remains for several weeks without decreasing its amplitude within experimental resolution indicates clearly the existence of a permanent current, that originates the magnetic field that influences the electrical resistance. This is a direct proof for the existence of superconductivity in certain regions of the graphite sample, up to a critical temperature that lies above room temperature for the measured sample. As shown in previous publications, the magnetization Scheike et al. (2012) as well as the electrical resistance Precker et al. (2016) reveal a flux creep phenomenon with a logarithmic time dependence. Those results suggest that the current line measured by the MFM phase should also show some kind of time dependence. Measuring the evolution of the MFM phase line with time we identified a shift in its position compatible with the decrease with time of the field enclosed area due to flux creep, see the video included in the supplementary information.
The meandering structure of the current path shown by the MFM phase line, see Figure 2(b), is similar to the one observed in high-temperature superconducting oxides in remanence Vlasko-Vlasov et al. (1997, 1998). In that case a modified Bean model based on a finite lower critical field and vortex pinning was used to understand the origin of the current line known as the Meissner hole (for a review see Jooss et al. (2002)). In the case of our graphite sample, however, from the simple Ginzburg-Landau relation for , taking the effective penetration depth as the one derived by Pearl Pearl (1964) for very thin films ( is the thickness of the superconducting interface distance between graphene planes) one expects a negligible . Moreover, due to the expected huge penetration depth, the pinning of pancake vortices at the interfaces should be rather negligible at such high temperatures. In contrast, the maximum in the remanence measured by the resistance is just below the transition (blue points in Figure 3(l)). This fact suggests that the magnetic field at remanence is produced by macroscopic (or mesoscopic) current loops, which originate fluxons. These pinned fluxons are the origin for the remanent state of the magnetic field and the irreversible behavior observed in the electrical resistance.
In conclusion, through MFM measurements done on a natural graphite sample that shows a transition in the electrical resistance and its remanence at K we could localize a current line as the origin for the trapped flux. This current remains for several weeks basically unchanged but it shows creep. The current line vanishes irreversibly at the same temperature as the electrical resistance shows a transition. Our results indicate that MFM as well as other scanning magnetic imaging techniques can be used to identify the regions of graphite samples were superconductivity is localized. This will undoubtedly help to further characterize the superconducting interfaces and/or other regions of interest in graphite, paving the way for their future device implementations.
Acknowledgements.
We thank Henning Beth for providing us with the natural graphite sample from Sri Lanka. C.E.P. gratefully acknowledges the support provided by The Brazilian National Council for the Improvement of Higher Education (CAPES). M.S. and J.B-Q. are supported by the DFG collaboration project SFB762.References
- Precker et al. (2016) C. E. Precker, P. D. Esquinazi, A. Champi, J. Barzola-Quiquia, M. Zoraghi, S. Muiños-Landin, A. Setzer, W. Böhlmann, D. Spemann, J. Meijer, T. Muenster, O. Baehre, G. Kloess, and H. Beth, New J. Phys. 18, 113041 (2016).
- Muñoz et al. (2013) W. A. Muñoz, L. Covaci, and F. Peeters, Phys. Rev. B 87, 134509 (2013).
- Volovik (2013) G. E. Volovik, J Supercond Nov Magn 26, 2887 (2013).
- Peotta and Törmä (2015) S. Peotta and P. Törmä, Nature Communications 6, 8944 (2015).
- Heikkilä and Volovik (2016) T. Heikkilä and G. E. Volovik, “Flat bands as a route to high-temperature superconductivity in graphite,” (P. Esquinazi (ed.), Springer International Publishing AG Switzerland, 2016) pp. 123–144.
- Feng et al. (2012) L. Feng, X. Lin, L. Meng, J.-C. Nie, J. Ni, , and L. He, Appl. Phys. Lett. , 113113 (2012).
- Coletti et al. (2013) C. Coletti, S. Forti, A. Principi, K. V. Emtsev, A. A. Zakharov, K. M. Daniels, B. K. Daas, M. V. S. Chandrashekhar, T. Ouisse, D. Chaussende, A. H. MacDonald, M. Polini, and U. Starke, Phys. Rev. B 88, 155439 (2013).
- Pierucci et al. (2015) D. Pierucci, H. Sediri, M. Hajlaoui, J.-C. Girard, T. Brumme, M. Calandra, E. Velez-Fort, G. Patriarche, M. G. Silly, G. Ferro, V. Souliere, M. Marangolo, F. Sirotti, F. Mauri, and A. Ouerghi, ACS Nano 9, 5432 5439 (2015).
- Barzola-Quiquia et al. (2008) J. Barzola-Quiquia, J.-L. Yao, P. Rödiger, K. Schindler, and P. Esquinazi, phys. stat. sol. a 205, 2924 (2008).
- Zoraghi et al. (2017) M. Zoraghi, J. Barzola-Quiquia, M. Stiller, A. Setzer, P. Esquinazi, G. Kloess, T. Muenster, T. Lühmann, and I. Estrela-Lopis, Phys. Rev. B 95, 045308 (2017).
- Kirtley (2010) J. Kirtley, Rep. Prog. Phys. 73, 126501 (2010).
- Kong and Chou (1997) L. Kong and S. Y. Chou, Appl. Phys. Lett. 70, 2043 (1997).
- Baumeister et al. (1992) W. Baumeister, P. Griitter, R. Guckenberger, H.-J. Güntherodt, T. Hartmann, H. Heinzelmann, H. Mamin, E. Meyer, D. Pohl, D. Rugar, H. Siegenthaler, U. Staufer, H. Wickramasinghe, W. Wiegrabe, and R. Wiesendanger, Scanning Tunneling Microscopy II (Springer, 1992).
- (14) There are however regions with a periodic modulation of the phase, see Fig. 2(b), which remain unaffected by the sample state and are due to an artefact of the used MFM.
- Scheike et al. (2012) T. Scheike, W. Böhlmann, P. Esquinazi, J. Barzola-Quiquia, A. Ballestar, and A. Setzer, Adv. Mater. 24, 5826 (2012).
- Vlasko-Vlasov et al. (1997) V. K. Vlasko-Vlasov, U. Welp, G. W. Crabtree, D. Gunter, V. Kabanov, and V. I. Nikitenko, Phys. Rev. B 56, 5622 (1997).
- Vlasko-Vlasov et al. (1998) V. K. Vlasko-Vlasov, U. Welp, C. G. W., D. Gunter, V. Kabanov, V. I. Nikitenko, and L. M. Paulius, Phys. Rev. B 58, 3446 (1998).
- Jooss et al. (2002) C. Jooss, J. Albrecht, H. Kuhn, S. Leonhardt, and H. Kronmüller, Rep. Prog. Phys. 65, 651 (2002).
- Pearl (1964) J. Pearl, Applied Physics Letters 5, 65 (1964).