978-1-nnnn-nnnn-n/yy/mm \copyrightdoinnnnnnn.nnnnnnn
DRAFT: please do not circulate \preprintfooterGenerated at: \currenttime
♭Cambridge University and ♮Imperial College, London and ♯Queen Mary University, London
Extending programs with debug-related features, with application to hardware development
Abstract
The capacity and programmability of reconfigurable hardware such as FPGAs has improved steadily over the years, but they do not readily provide any mechanisms for monitoring or debugging running programs. Such mechanisms need to be written into the program itself. This is done using ad hoc methods and primitive tools when compared to CPU programming. This complicates the programming and debugging of reconfigurable hardware.
We introduce Program-hosted Directability (PhD), the extension of programs to interpret direction commands at runtime to enable debugging, monitoring and profiling. Normally in hardware development such features are fixed at compile time. We present a language of directing commands, specify its semantics in terms of a simple controller that is embedded with programs, and implement a prototype for directing network programs running in hardware. We show that this approach affords significant flexibility with low impact on hardware utilisation and performance.
keywords:
debugging, FPGA, program directing, profiling, high-level synthesis, aspect-oriented programming1 Introduction
When debugging and monitoring programs running on microprocessors we usually benefit from hardware support that is leveraged by an Operating System to inspect and modify running processes Gagnon et al. [2007]. But when a program is run on reconfigurable hardware platforms, one does not usually have an operating system, a notion of process, nor any hardware support for debugging. Programs must contain additional logic to enable debugging, monitoring, and profiling during their execution, because the environment does not provide visibility into running programs by default.
Field-Programmable Gate Array devices (FPGAs) are a form of programmable hardware consisting of a grid of logic blocks whose function and wiring can be flexibly reconfigured. FPGAs are used to perform functions for which a full-featured general-purpose CPU is not appropriate. For such functions, FPGAs can operate at a higher throughput and consume much less electricity than CPUs [Mittal, 2014, §4.4]. This makes FPGAs especially appealing for some problems and environments, a recent example being datacentres Putnam et al. [2014].
Despite their appeal as a computing device, the programmability of FPGAs has been hampered by the need for low-level hardware-description languages traditionally used to program them, such as Verilog and VHDL, which “requires programmers to assume the role of hardware designers” So et al. [2002]. Research has yielded various approaches for high-level synthesis (HLS): this tends to consist of using (fragments of) existing languages, such as C or Java, to describe hardware.
In addition to a programmability gap between FPGAs and CPUs, there is a debuggability gap that has received far less attention. The programmability of FPGAs has improved over the years, but they are not debuggable by default Potkonjak et al. [1995]. FPGAs provide no visibility into the running program, and their standard tooling provides very limited support for this. For full visibility one could simulate the program, (e.g., on a workstation) but the simulation can be slower by a factor of Camera et al. [2005] because of the sheer amount of detail that must be simulated.
In this paper we propose to improve the debuggability of programs running on FPGAs by using a domain-specific control language inspired by program directing Sosič [1992] to generate in-program support for debugging. In addition to debugging, this can be used to monitor and profile programs.
We call our approach Program-hosted Directability (PhD). It involves extending the user’s program to service direction commands at runtime. Extending the program involves inserting (i) named extension points which can contain runtime-modifiable code in a computationally weak language (no recursion), and (ii) state to be used for book-keeping by that code, to implement direction features.
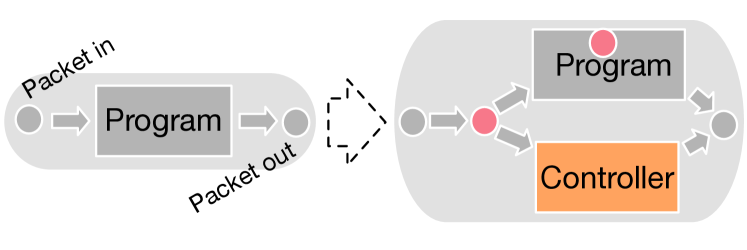
For example, the direction command “” (where is a variable in the program’s source code) logs updates made to a variable, and appends these updates to a buffer (of size “” for later inspection). We translate this command into (i) a snippet that gets injected into the program (Figure 1) and (ii) a modification of the program to allocate space for this snippet, and for state require by this snippet: such as the variable V_trace_idx, and array V_trace_buf. More examples are given in §3, and the overall scheme is shown in Figure 2.
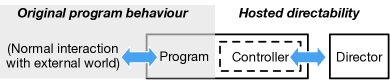
Idiomatic direction features (such as tracing, breakpoints, etc) are compiled down to a weak language and executed by an interpreter embedded in the program. For consistency with the description of the interpreter’s behaviour as hardware, we refer to it as a controller. The controller is invoked by extension points, which are inserted into the program through transformation. In the above example, the extension points would be added after each update to a variable, to ensure that the update is considered for logging.
Extension points are added at compile time depending on what direction commands we want to support at runtime. For example, starting with the sequence of statements we insert two extension points and , resulting in the program . When extension point is reached at runtime, a stored procedure associated with is executed by the controller. This procedure ultimately hands back control to the host program, or starts an interactive session with a program director, which can send the controller further commands, and update its stored procedures.
Our work systematises ad hoc debugging and profiling extensions to programs, and generalises the facilities currently made available for hardware development. Moreover, we can include only the features needed, thus improving the utilisation of the hardware, and its power consumption. The approach is extensible: one can code additional direction commands, or variations (§3.3). In this paper we show how to give semantics to program direction commands in terms of the placement of extension points, the code that is to be run by the controller, and the interaction between the controller and the direction tool that manages it.
We prototype PhD using an HLS and obtain a uniform interface for directing the software and hardware instances of the same program, allowing us to unify the debugging of these instances (which otherwise require diverse tools).
We believe that PhD can yield practical benefits in hardware development and deployment. As a technique, PhD is vendor-neutral and compiler-neutral, and the communication between the director and controller can be adapted to suit the program. For example, in our prototype we send direction commands via the network. PhD can be implemented in different ways: in our prototype we implemented it entirely in a high-level language via HLS, but one could also bolt it onto more finely engineered hardware blocks. Despite running as hardware, the directability features can be enabled and reconfigured at runtime: this consists of updating the code stored by the controller. In contrast, existing techniques for FPGAs involve including fixed function circuits in the design. Finally, PhD extends a program with a direction mode, thus facilitating the in-field debugging of programs.
Through PhD we hope to contribute to the convergeance between the debuggability of programs on FPGAs, and those on CPUs, which enjoy extensive hardware and OS support, and which in turn benefits sophisticated monitoring systems such as DTrace Gregg and Mauro [2011]. The ideas described in this paper are not necessarily tied to the languages, compilers, FPGA or other equipment we used in our prototype. We make the following contributions:
- •
-
•
We relate the direction commands with our low-level language through a specification (§3.4) in which programs are ordered by the directability features they support. This provides a basis on which we can reason that one program is “more debuggable” than another at runtime.
-
•
A prototype implementation and its evaluation (§4), where we measure the effect of directability on FPGA utilisation and performance.
2 FPGA debugging gap
Irrespective of how we write our program as a hardware description, once a so-called “bitstream” is generated that configures an FPGA to run our program, the program can only be tested as a black box, and we cannot understand or further influence its behaviour at that stage.
The need for better FPGA debugging features is becoming more urgent since:
-
•
FPGA chips are getting larger, which allows them to run more complex programs. Complex programs are more likely to be buggy, which necessitates more debugging.
- •
-
•
FPGAs are being deployed in large production environments, such as Microsoft’s datacentres Putnam [2014].
Hardware development has driven the development of formal methods to establish system correctness Fix [2008], which enabled the development for methods for software Ball et al. [2006]; Godefroid et al. [2012]. Unfortunately the verification is done on the Register-Transfer Level (RTL), a higher-level description of a hardware circuit in languages such as Verilog, and not on the generated bitstream. Thus debugging may still be needed.
2.1 Debugging(FPGA) != Debugging(CPU)
Debugging concepts from software do not correspond directly with debugging the same program on an FPGA. A lot of the core issues involved were discussed in the pioneering work of Koch et al. [1998] and in many other work on HLS debugging Goeders and Wilton [2014]; Monson and Hutchings [2015]. These are the main points:
-
•
Multiple source lines might be executed concurrently in hardware. Code is represented at the source, register-transfer, and gate levels. This has important consequences for debugging, described in the following points. The correspondence between these levels necessitates keeping metadata from compilation for debugging.
-
•
Depending on the debugged artefact, stepping by (source) line might be less useful than stepping by cycle.
-
•
Breakpoints become more tricky to interpret, since they are usually set on a specific line of code. In hardware there may be several overlapping lines being executed at a breakpoint [Koch et al., 1998, §4.3]. Moreover, the output of operations on previous lines might only be available after some clock cycles have elapsed. Depending on what the user wishes to do, they might prefer if the breakpoint is triggered after the elapsing of these cycles. Furthermore, part of the next line of source code might have started executing. This suggests that a strict indication of sequentiality needs to be communicated to the HLS compiler if the usual breakpoint semantics are desired.
-
•
As mentioned in the introduction, FPGAs do not provide hardware support such as debug registers to assist with analysing running programs.
2.2 Current techniques for FPGA debugging
Some existing techniques help narrow the debugging gap on FPGAs. Co-simulation involves comparing the behavioural simulation between HLS and RTL. This can be considered a special case of relative debugging Sosič and Abramson [1997] but it does not provide visibility into the hardware instance of a program. Another technique involves in-system testing: testing a large part of the system, though possibly not all. This does not provide visibility into the hardware either.
Current practice employs two techniques for FPGA debugging. Trace buffers are the most popular technique for debugging FPGAs. It requires a programmer to identify signals of interest in the circuit at compile time, then an embedded logic analyser is synthesised that uses on-chip memory to record traces for these signals. This suffers from two problems: only a limited number of signals may be viewed (limited by on-chip memory), and traces have a limited window size (for the same reason). Traces may be conditional, to avoid using up buffer space unnecessarily, but this technique is difficult to use because it involves generating the bitstream each time. Register scanning allows you to see the values of all registers on the FPGA, but requires “stopping the world” to enable reading and sending it off-chip. This slows down tests, and thus register scanning has been supplanted by trace buffers.
Both register scanning and trace buffers usually send recorded data off-chip via the JTAG (Joint Test Action Group) interface, a standardised instrumentation method Bennetts and Osseyran [1991]. This method is not scalable, since its transfer rate is far less than the FPGA throughput.
In summary, existing techniques consist of including “fixed function” modules as part of your hardware description at compile time. This has the advantage of being lightweight since these circuits are specialised to perform a single function, but it has the disadvantage of being inflexible. Generating a hardware bitstream can take hours, and the added overhead costs for runtime-reconfigurable debuggability and monitoring features might not be affordable in some use-cases. Furthermore, these techniques cannot be used in production environments.
2.3 High-Level Synthesis (HLS)
HLS involves the use of a high-level language, such as Java, C, C++, and OCaml, to write a hardware description. This takes advantage of the features of, and tooling available for, the high-level language. An RTL description is then generated from the high-level description.
Using an HLS to describe hardware enables one to run the HLS description as a software program, and to debug it as such, by using standard tools to compile and debug Java programs for instance. This prunes bugs from the eventual bitstream and avoids regenerating the bitstream. Irrespective of whether testing is directed at software or hardware, it can take many tests to find a fault. Software-based testing could help detect logic errors in our code, but it could not help us find some important classes of problems: ‘[Testing in] the silicon mode permits the analysis of bugs that are “invisible” at the RTL level’ Calagar et al. [2014]. We outline the main cases below:
-
1.
Interface mismatch. We need to understand whether a problem occurs because of a mismatch between one module and the rest of the circuit. Recall that behavioural simulation might not be applied to the whole design, and incorrect assumptions about the enclosing circuit can result in the simulation test succeeding but the hardware tests failing.
-
2.
Reproducability. Some faults are triggered during high-throughput tests, and are difficult to find when testing other instances of the program. Other faults result from features of the hardware and transient environmental states – such as “Single Event Effects” manifested through the flipped or stuck bits from the interaction of charged particles with semiconductors Sari et al. [2014]; Krishnaswamy et al. [2008].
-
3.
Toolchain problems. Diagnosing bugs in the compiler toolchain becomes easier if we can see into the compiled program’s operation. Bugs are not unusual in both HLS and RTL toolchains.
2.4 Current research on FPGA debugging
Various improvements have been explored for the techniques described above. For example, one could write summaries to the trace-buffer, rather than the explicit trace Goeders and Wilton [2014]. Another idea consists of multiplexing all signals and choosing which to observe at debug time rather than at compile time Hung and Wilton [2013], enabling “observation without recompilation”. An additional idea is to buffer into a fast external memory Panjkov et al. [2015].
| System Features | state inspection | trace recording | state updating | extension points | break points | stepping | interruption | fine granularity | assertion checking | hang detection | timing checks | software instance | runtime reconfigurable | HLS (vs HDL) | Network/Control | use leftover resource | embed at Source/HDL |
| Sosič [1992] Dynascope | ✓ | ✓ | ✓ | ✓ | ✓ | ✓ | ✓ | ✓ | ✓ | ✓ | ✓ | ||||||
| Goeders and Wilton [2014] HLS-Scope | ✓ | ✓ | ✓ | ✓ | ✓ | ✓ | C | S | |||||||||
| Calagar et al. [2014] Inspect | ✓ | ✓ | ✓ | ✓ | ✓ | ✓ | C | H | |||||||||
| Panjkov et al. [2015] | ✓ | ✓ | C | S | |||||||||||||
| Hung and Wilton [2014] QuickTrace | ✓ | ✓ | ✓ | ✓ | ✓ | N | ✓ | H | |||||||||
| Koch et al. [1998] SLE/CADDY | ✓ | ✓ | ✓ | ✓ | ✓ | ✓ | C | H | |||||||||
| Monson and Hutchings [2015] | ✓ | ✓ | ✓ | C | S | ||||||||||||
| Curreri et al. [2011] | ✓ | ✓ | ✓ | ✓ | C | H | |||||||||||
| Camera et al. [2005] BORPH | ✓ | ✓ | ✓ | ✓ | ✓ | ✓ | ✓ | C | H | ||||||||
| (see §2.5) PhD | ✓ | ✓ | ✓ | ✓ | ✓ | ✓ | ✓ | ✓ | ✓ | ✓ | C |
Table 1 surveys closely related work, classifying it according to the features they provide. Related work is contrasted in more detail in §5. In Table 1 extension points means being able to extend the program at certain points at runtime. Interruption refers to asynchronous interruption of a program by a debugger. Fine granularity means that we can look at arbitrary parts of a program; for instance McKechnie et al. [2009] only allow inspecting at the module boundary. Software instance means that the program can be run on the CPU as a process, independent from the FPGA. Network/Control refers to how a technique is implemented: as a control loop or as a network that feeds signals to a logic analyser. Use leftover resource means that the debug circuitry does not compete with the program’s circuit. And embed at Source/HDL refers to whether the source code or its HDL image is updated to include the debug circuitry.
2.5 PhD design features
PhD came about after we found ourselves extending our ad hoc debugging and monitoring code to support additional features, instigating us to study the problem more rigorously.
Table 1 shows the features supported by PhD. Initially it supported state inspection and update. Updating state enabled us to influence data-dependant control flow. Extending the controller to include branching and extension points enabled us to support more features, such as assertion checking, which involves breaking if a condition is satisfied.
As an idea, PhD is neither committed to HLS nor HDL description. In our prototype we implemented it in HLS for convenience, but often better performance can be gained by relying partly or fully on modules written in HDL.
3 A language and model for program directing
In this section we describe , a language of direction commands that we extracted by analysing the commands commonly given to profilers and debuggers such as gdb.111https://www.gnu.org/software/gdb/ In Figure 1 we described one such command and how we code the high-level direction command as a program that will be executed by the controller.
3.1 Direction language
Our direction language consists of the commands listed in Table 2. These commands can have three kinds of parameters: (i) symbols relating to the program, (such as variable or function names, or labels), (ii) relations over program variables, which we denote by the symbol , indicating the conditions on which statements might apply, and (iii) measures of resource, which we symbolise by , indicating a finite resource that is allocated for the execution of a command. Symbol is a metavariable ranging over variable identifiers in the source program, and is a metavariable ranging over labels in the source program. A label is associated with a single position in the program, (e.g., line 5 in function “main”), but a single position might be associated with multiple labels. below.
Let be the set of possible conditions that can be used. We assume that at least . We can also allow additional truth conditions, and in this model we will have for arbitrary ranging over program values or variables. For example, “” would instruct the controller to watch a variable , and switch to interactive directing when .
describes the maximum quantity of some resource when carrying out a direction command. This value must be less than the compile-time allocation of the resource, to ensure the provision of sufficient resource for the command at runtime. This is needed to size the buffers used for tracing. For example, “” will count the number of reads of , and break after 5000 reads have been made. This could be done to avoid overflow, or to capture some behaviour of interest. Similarly, “” breaks after 500 instances of have been recorded in the trace. The trace buffer must accommodate at least 500 entries.
| Command | Behaviour | ||||||
|---|---|---|---|---|---|---|---|
| Print the value of variable from the source program. | |||||||
| Activate a (conditional) breakpoint at the position of label . | |||||||
| Deactivate a breakpoint. | |||||||
| Print the “function call stack”. | |||||||
| Break when is updated and satisfies a given condition. | |||||||
| Cancel the effect of the “watch” command. | |||||||
| Count the reads or writes to a variable , or the calls to a function . | |||||||
|
|||||||
3.2 Controller
High-level direction commands such as those in Table 2 are ultimately translated into programs that run on a simple controller embedded in the program. We model the controller as a CASP machine (for “Counters, Arrays, and Stored Procedures”, the constituents of the machine’s memory). CASP machines are very weak. They are more structurally complex than register machines Shepherdson and Sturgis [1963] since they have separate memories for storing arrays and registers, but CASP machines are computationally much weaker than register machines, unable to encode partial computable functions. A limited form of memory indirection is permitted through a collection of arrays. The language lacks any means for defining recursive functions, or branching to arbitrary addresses. Any more complex computation must be done by the director; the controller simply provides a controlled access to the program’s memory.
We describe the language of CASP programs in Figure 3. We rely on the following meta-variables and syntax categories: programs, expressions, indices, updatable values, values, numerals (corresponding to ), variable identifiers, and the array identifiers, where the names for variables and those for arrays are disjoint, .
is a placement command: it updates the code at extension point having label to be . Note that placement commands may not be nested in our model: for instance, this is not a valid program:
We do not want to allow programs to be self-modifying in this way, since it complicates reasoning about them.
Ending programs.
Both and indicate the end of a CASP program, but differ in what happens before resuming the host program (in which the controller is embedded). simply resumes where the host program left off, whereas switches into an interactive direction mode. In this mode, the controller may receive commands from the director, execute them, and send an acknowledgement back.
The remaining syntax forms and constants used above are standard and intuitive. Owing to its simplicity the semantics of this language are straightforward, and are given in §C.1.
3.3 Examples
CASP programs are to what microprograms are to an Instruction Set Architecture Smith and van Leeuwen [1974]. We give some examples of coding program direction commands below, before describing the behaviour of program direction commands in more detail in the next two sections.
Conditional tracing.
Sampled tracing.
The sampled variant involves allocating an additional variable to count the interval between samples, and storing the desired sample interval:
Profiling.
The command “” causes a counter to be incremented each time a variable is updated:
Watchpoints.
The command “” causes the program to break (for interactive guidance) when a variable’s value satisfies some predicate. Let be the CASP-level value to the -level parameter (we give such a function in §3.5.1). The code is similar to that in the profiling example above, except that is user-provided.
Breakpoints.
“” causes the program to break when it reaches a specific label, and if condition is satisfied. The coding is identical to that in the watchpoint example, but they differ in their placement: breakpoints are placed at programmer-specified positions in the code whereas watchpoints are associated with labels where variables are updated. This difference cannot be seen from the snippet, but will become evident in the formalisation of the program direction commands, which we start next.
3.4 Directability ordering
In this section we define a relation to mean “ is more directable than ”, where are triples and , each representing three interdependent parties: the director, controller and program. The user (or their agent) issues direction commands to the director, which interacts with the program’s state via its agent, the controller, embedded in the program. We use this relation to give semantics to the direction commands in terms of interaction with CASP machines.
Our directability relation gathers information about the three parties involved, and describes how their interdependence is revealed by the directing commands: for example, the director would not be able to execute if the program did not have a variable called , or if the controller had not been allocated a trace buffer.
In our notation, represents the director’s state (a set of facts representing its knowledge about the controller’s state, such as which breakpoints exist, and whether they are active or not). is the controller’s state, consisting of a machine, cf §3.2. is a program. We will define an example language in §3.4.1 to aid our formalisation.
We also include in the relation some information about why one triple is less directable than the other. We therefore index the relation by (i) the direction commands (§3.1) supported by , (ii) the additional command supported by , and the semantics of this command. Note that denotes the set of direction commands that is supported simultaneously by , i.e., these commands are allocated separate state.
Written out in full, we obtain this relation:
In §3.5 we will instantiate such a relation by formalising commands from in terms of CASP machines. Note that this describes how the directing commands are translated into CASP programs, but we do not fully formalise the director: is written in an ML-like pseudocode.
Our formalisation is devised in away that avoids the mutual interference of direction commands. That is, the same program can be subjected to any combination of direction commands. To make this non-interference more precise, we introduce some definitions. Let and . We say that is relevant to if it only manipulates state or elements introduced in and . Furthermore commands are disjoint if they introduce non-overlapping state. That is, for any two commands and , for any prior states and their respective new states are disjoint: .
3.4.1 Program language
In this section we specify a first-order imperative language to support our formalisation of program direction commands. Unlike CASP machines (§3.2) this language is computationally strong: recursive functions over the integers can be encoded. The language’s simplicity enables the relation of program direction with CASP machines, while avoiding excessive formal complexity. Formalising transformations for realistic languages—even simple transformations Schäfer et al. [2008]—is usually fraught with complex definitions, and we avoid that here.
The language grammar is given next. Note that for simplicity we deliberately overlay the meta-variables for variables and numerals ( and ) over those for CASP machines. This simplifies the interface with CASP programs, which will be executed at extension points within host programs. ranges over programs, over statements, over expressions, over types, and and over the declaration of variables and functions respectively.
In this language the only data type in is the integer type. The only unusual construct in this language is . This indicates an extension point, where control is passed to the CASP machine (§3.2). As before, is a metavariable ranging over labels drawn from a denumerable set.
The semantics of this language are straightforward, and are given in §C.2. Intuitively, the behaviour of is as follows. If then the command has no effect. Otherwise, the stored procedure associated with each is called, in any order, and run to completion, noting the last instruction of each . The last instruction of any CASP program is either ‘continue’ or ‘break’ (§3.2). If all end in ‘continue’, then the behaviour of is to continue executing the next statement in the host program. Otherwise, if at least one ends in ‘break’, then the controller switches into interactive mode. In this mode, control remains with the controller, until the director sends it a ‘continue’ command, at which point control is returned to the program.
We make the simplifying assumption that all the statements in the user’s program are interspersed with ‘’: that is, if the user writes then this is translated into . In the next section we populate these extension points with labels, to extend the directability of a program.
3.5 Semantics for
In this section we encode program direction commands (§3.1) into interactions between the director and controller (§3.2). Note that this describes how the directing commands are translated into CASP programs, but we do not fully formalise the director: is written in an ML-like pseudocode.
3.5.1 Break
We start by formalising the meaning of the “break” command. Intuitively, this command adds a breakpoint to a program: an extension point is at the position of the breakpoint is labelled with , and the associated state is set up in the director and controller. To support this command:
-
•
A program is extended to include a label at the position where the breakpoint is to be placed. This extension is formalised by the premise , which means that is identical to except for the label occurring at some extension point. This is defined formally in §B along with related definitions, such as that of a position in the program.
-
•
The label must not appear in the original program. We write this as using an abbreviation defined in §B.
-
•
The controller’s state is extended to store the procedure associated with . Furthermore, the breakpoint is activated by default. We use the abbreviated notation to indicate this extension, where is the stored-procedure memory in the CASP.
-
•
The director’s state is extended to encode whether the breakpoint is currently active or not. It is activated by default, thus: , where “<<bp>>” is a unique token we use for breakpoints, and is a token we use to indicate that the breakpoint is active. Soon we will formalise the “unbreak” command, which flips this value to .
-
•
The director’s behaviour for the “break” command, , involves activating the breakpoint unless already active.
In the definition of below we use the notation , which we use to mean that the director sent the CASP program to the controller, and received the reply . Thus “” means that the director instructed the controller to store the program at , and that it expects to get back (which is a code indicating where the program is stored, as formalised in §C.1).
In we use the notation “” to abbreviate .
The formalisation of the “break” command follows.
We can use a simplified notation since our commands will be both relevant to
and disjoint:
{mathpar}
\inferrule
L /∈p
p <^1_L p’
p
p’
{
˘= { (<<bp>>,L,1) }˘= {SP[L↦_SP ] }D_c = λ.
where
We use to denote the meaning of
“” to the director, as a CASP program.
is the value used to initialise
the stored program associated with .
The meaning of is translated for inclusion in the CASP program by the following function:
We now turn to the “unbreak” direction. To be able to issue this direction, the breakpoint needs to exist—thus we have a dependency on the “break” direction earlier: {mathpar} \inferrule( ) ∈C p p { ˘= { }˘= {}D_c = λ. where
Note that the program, and the states of the controller and director are not changed. The only extension is made to the behaviour of the director, which is extended with a function to unset the breakpoint. This time we didn’t set anything in the controller since there is no default behaviour and additional state required for unsetting a breakpoint. This is because unbreaking a breakpoint doesn’t establish the breakpoint, whereas breakpoint does.
To print the value of a variable , that variable needs to exist in
the program (), and we need to have at least one extension
point (through which we can send the print command).
{mathpar}
\inferrule() ∈C
X ∈Var_p
p
p
{
˘= { }˘= {}D_c = λ.
This time we didn’t use a placement command to update the behaviour of the
controller; we simply ran a query.
is pseudocode that uses a print function in the director.
Recall that we formalise directions in terms of CASP machines, and don’t formalise the
director’s behaviour.
ensures that is a variable in . is defined in §B.
3.5.2 Trace
The most important command related to tracing is “trace start”; the other
commands depend on it.
{mathpar}
\inferrule
X ∈Var_p
∀L ∈X_L. L /∈p
Positions_p’(X_L) = PostUpdate_p’(X)
p <_X_L p’
p
p’
Applying this rule depends on a set of labels in that don’t exist in . is the least extension of that includes these labels. Furthermore, these labels coincide with the positions in the program occurring after has been updated.
The controller’s state is extended with the buffer index, , initialised to 0; the overflow indicator , initialised to 0 (for false); and is an array that can hold elements. Each labels the positions immediately after the variable has been updated.
) ∈C
Positions_p(X_L) = PostUpdate_p(X)
p
p
where .
4 Implementation and Evaluation
We prototyped the ideas described in the previous section by extending network programs with program-hosted directability, and compiled them to run on an FPGA. We then evaluated the effect of these directability features on the program in which they are embedded. Our approach enables us to make fine-grained modifications to directability, and we evaluate the overhead from supporting different CASP machine instructions.
4.1 Prototype
In our prototype we manually transformed programs to include the controller. This transformation was straightforward: we wrote the controller (implementing a CASP machine) and added extension points to the program (consisting of calls to the controller to execute a stored procedure).
Focus.
From its description, the PhD idea is not constrained to a specific kind of program. In our prototype we focussed on using it to work with network programs however, for two reasons:
-
1.
It allows us to test remote directing over standard network equipment. In our survey of tools and techniques (Table 1) only Dynascope has network access, but it does not work for FPGAs.
-
2.
It allows us to use industrial high-precision network measuring equipment to see the effects on the program hosting a controller.
Use-cases.
As programs we used implementations of DNS and Memcached that we had written previously to run on FPGAs, as part of earlier research. DNS (Domain Name System) is a ubiquitous name-resolution system used on private and public packet-switched networks such as the Internet Mockapetris [1987]. This implementation was around 700 lines of C#. Memcached Fitzpatrick [2004] is a well-known, in-memory key/value store that caches read results in memory to quickly respond to queries. The protocol uses a number of basic commands such as GET (retrieve a value associated with the provided key), SET (store a key/value pair) and DELETE (remove a key/value pair) and has both ASCII and binary protocols. In this work as proof-of-concept we have implemented a limited version of Memcached supporting GET/SET/DELETE using the binary protocol over UDP and supporting 6 byte keys and 8 byte values. This implementation was almost 900 lines of C#.
Method.
We transformed the DNS and Memcached implementations in two ways: (i) adding code to check whether a received packet is a direction packet intended for the controller (see Figure 4), in which case the controller (and not the original program) processes the packet; (ii) adding an extension point in the body of the (DNS or Memcached) main loop, allowing us to influence and observe the program from that point.
We form an enumerated type that corresponds to the program variables whose values the controller may access and change at runtime. The code for each value of the enumerated type is used to refer to the program value, to instruct the controller to increment it, for example. Building tool support to automate parts of this process seems feasible.
Direction packets.
Direction packets are network packets in a custom and simple packet format, whose payload consists of (i) code to be executed by the controller, or (ii) status replies from the controller to the director. It enables us to remotely direct a running program, similar to gdb’s ‘remote serial protocol’.222http://www.embecosm.com/appnotes/ean4/embecosm-howto-rsp-server-ean4-issue-2.html Our design uses a simple direction language, and works for instances of a program that run both as software and hardware (on FPGAs), whereas gdb requires special backends for each architecture.
Controller.
Our controller follows the description of CASP machines very closely (§3.2). It has two features. First, memory is organised into Counters, Arrays and Stored procedures. Counters include variables in the original program, as well as extra registers used for program directing. In this prototype we only support numeric datatypes; structured datatypes could be encoded in principle. Secondly, a function that interprets the language of CASP machines. This is used to branch to stored procedures when their corresponding extension points are reached.
Tools and equipment.
We wrote our programs in C#, and used the Kiwi high-level synthesis (HLS) system Singh and Greaves [2008] that statically recompiles .NET bytecode into Verilog. The Verilog code generated by Kiwi was slotted into open-source reference code from the NetFPGA project,333http://netfpga.org/ and compiled to run on the NetFPGA SUME board Zilberman et al. [2014], a low-cost, PCIe host adapter card able to support 40Gb/s and 100Gb/s applications. At the core of the board is a Xilinx Virtex-7 690T FPGA device.
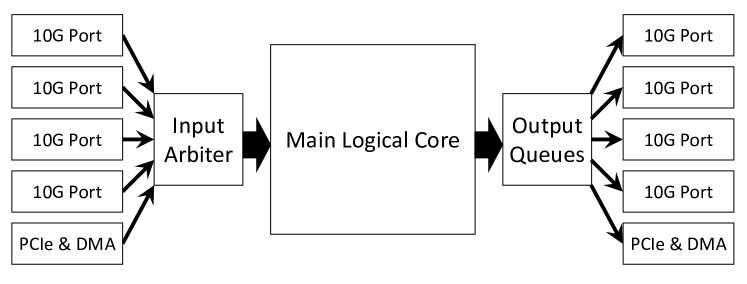
The NetFPGA reference designs share the same FPGA architecture, illustrated in Figure 5, of multiple physical interfaces surrounding a logical data-path. Traffic to the FPGA enters through one of four 10Gb/s ports or from a PCIe interface, and is passed into the main data-path by an input arbiter, which arbitrates between all ingress interfaces. Packets are then processed within the main logical core, and are diverted to their destination through an output queues module. From this module, the packets are passed to the physical interfaces and are transmitted.
4.2 Evaluation
We evaluate our prototype by carrying out a quantitative analysis of the impact that the controller has on the program in which it is embedded. This impact is measured in terms of utilisation of resources on the FPGA, and the performance of the host program.
An FPGA consists of an interconnected grid of logic blocks, which in turn contain resources such as memory and logic functions (in the form of so-called look-up tables). Flip-flops are primitive storage circuits.
Table 3 shows the utilisation and performance for DNS and Memcached, extended with different controller features. These features show a fine-grained decomposition of the instructions supported by the controller: reading a variable, writing a variable, and incrementing a variable. We see that the impact on utilisation and performance is minimal.
Performance is analysed in three ways. The duration is the number of clock cycles that are needed by the program to process a packet within the main logical core, as extracted from simulation. In our hardware, each clock cycle takes 10ns. Latency is the time taken for a program to service requests from the network. Throughput is the rate of requests that can be serviced by the program (before packets start to be dropped).
Using the controller we can read and change the program’s state at the packet rate. Using JTAG and the Virtex-7 FPGA we can read data at up to 66Mbps, three orders of magnitude less than the maximum throughput that the NetFPGA can sustain over high speed serial interface –e.g. the PCIe channel. In principle the direction controller could use any slice of that, subject to not interfering with the hosting program too much.
In Table 4 we compare DNS extended with one extension point, against DNS extended with an embedded logic analyser (ELA). An ELA is a standard technique in hardware development, and consists of a circuit that passively monitors the program, creating a trace of the program’s execution. DNS+2e is the DNS extended with one extension point that only contains a NOP. In (Count) the extension point’s stored procedure is changed into a counter, and in (Trace) it is changed to emulate the behaviour of the ELA.
These results confirm that the resources overhead is minimal, making PhD a feasible solution. We note that in the use-cases detailed below the FPGA resources were never exhausted, and consumed less than 25% of the logic resources, even for complex services.
In addition to the quantitative evaluation, we note that PhD is vendor-neutral and runtime-reconfigurable, and can be used for remote in-field debugging, whereas standard techniques for FPGA debugging do not provide this.
Test setup.
We use a host running Ubuntu server 14.04LTS, kernel version 4.4.0-45-generic. The host hardware is a single 3.5GHz Intel Xeon E5-2637 v4 on a SuperMicro X10-DRG-Q motherboard. An Endace 9.2SX2 DAG card (7.5ns time-stamping resolution) and a NetOptics passive-optical tap are used to intercept client-server traffic and permit independent measurement of client & server latency. For the throughput tests, OSNT Antichi et al. [2014] is used to control the rate of the generated requests.
| Artefact | Utilisation (%) | Performance | |||
|---|---|---|---|---|---|
| Logic | Flip-flops | Duration (#cycles) | Latency (s) | Queries-per-sec (KQPS) | |
| DNS | 100.00 | 100.00 | 57 | 1.85 | 1176 |
| +R | 103.40 | 102.76 | - | 1.85 | 1176 |
| +W | 115.05 | 106.04 | - | 1.84 | 1176 |
| +I | 109.79 | 106.12 | - | 1.84 | 1176 |
| Memcached | 100.00 | 100.00 | 64 | 2.03 | 952 |
| +R | 99.17 | 100.29 | - | 2.03 | 952 |
| +W | 99.80 | 100.74 | - | 2.04 | 952 |
| +I | 100.63 | 100.69 | - | 2.03 | 952 |
| Artefact | Utilisation (%) | Performance | |||
|---|---|---|---|---|---|
| Logic | Flip-flops | Duration (#cycles) | Latency (s) | Queries-per-sec (KQPS) | |
| DNS+ELA | 99.74 | 100.40 | 57 | 1.83 | 1176 |
| DNS+2e | 234.61 | 151.06 | 57 | 1.86 | 1176 |
| (Count) | 234.46 | 151.81 | 62 | 1.94 | 1064 |
| (Trace) | 218.30 | 151.84 | 70 | 1.99 | 1010 |
5 Related work
Portable debugging, program directing, and debugging languages.
We were inspired by previous work on portable debugging Ramsey and Hanson [1992]; Hood [1996]; Hanson and Raghavachari [1996] and program directing Sosič [1995]. That work usually makes the assumption that software is compiled to run on a general-purpose CPU however, whereas we also target reconfigurable hardware. The study of languages for debugging is a decades old subject Balzer [1969] and includes sophisticated languages for high-level querying of programs Johnson [1977]; Golan and Hanson [1993]; Winterbottom [1994]. Compared to that work, our work separates more starkly between the role (and language) of the director, and that of the controller, which have separate languages. This separation guided our modelling in §3.
Dynascope.
Dynascope Sosič [1992] provides an extremely fine grained execution stream of events–at the level of machine instructions–providing a complete description of a program’s runtime behaviour. We provide selective (and programmable) visibility by default, in the interest of performance. A more detailed stream could be produced if wished. Dynascope is generative by default (since you need to set filters to ignore events) whereas we are generative by direction (you only get events that you inserted code to generate).
High-level synthesis and runtime debugging.
The closest work is that by McKechnie et al. [2009] who adapt a debugging paradigm first developed for network-on-chip devices (NoC). They provide transaction-level granularity, consisting of domain-specific (high-level) events–less fine grained than Dynascope’s execution stream. Compared to our work they offer a less flexible interface, but they take a more detailed account of different sorts of interconnects between components–formats such as LocalLink and PLB.
Many other systems inject code to emit and observe events to aid with debugging of complex designs, such as “System on Chip” designs Lee and Lysecky [2015]. SeaCucumber Tripp et al. [2002] was the first to support source-level (HLS) debugging, both during behavioural simulation and during hardware execution. Monson and Hutchings [2015] take a different approach: source-code transformation (at the HLS level) to introduce “event observability ports” to enable runtime visibility of variables’ values –but note that it’s not always possible to observe an expression an interest. We took the approach of Monson and Hutchings [2015], relying on source transformation rather than on the HLS system.
Overhead can be reduced by being selective about what to monitor, rather than monitoring everything by default. This was studied by Goeders and Wilton [2016] who compared the amount of visibility afforded by different schemes when recording events such as reads and updates. We left the choice of what to observe to the programmer.
At present the LegUp HLS system Calagar et al. [2014] appears to provide the best support for debugging. In a contribution to that system, Hung and Wilton [2014] take a different approach to us: they use a two-step incremental compilation, the second step of which compiles the monitoring system by reclaiming unused FPGA resources. This approach is less likely to interfere with the timing behaviour of the observed circuit. Their model is more specialised to trace-buffers, and it would be interesting to generalise it to support our directing controller.
Testing of hardware is traditionally concentrated on the RTL description, where tools and techniques have been developed to verify designs prior to synthesis Foster [2008]; Fix [2008] . The difficulty of checking hardware entirely prior to synthesis has led to research into the inclusion of runtime monitors in hardware Todman et al. [2015]. Curreri et al. [2011] describe a system that translates source-level assertions into monitors. This technique is also used to detect hangs and possible timing overruns. We currently do not support such monitoring, since it requires a source-level notion of time that we currently do not provide, and “watchdog threads” that we currently do not include.
Finally, Camera et al. [2005] described a hardware OS, the Berkeley Operating system for ReProgrammable Hardware (BORPH), on which user programs were run. Their stitcher extend the user program to support debugging, providing a rich system. Like BORPH we require the designer to provide “hints to the system of what aspects of the design may need to be explored at runtime.”
Formalising program directors.
Since ‘debugging’ is such a vague term (compared to ‘compiling’, which has a clearer functional behaviour), its verification objective is hard to formalise. Perhaps as a consequence of this there has been little work on formalising and verifying debuggers, and usually entirely theoretical Zhu [2001]. Kishon et al. [1991] describe transformations over functional programs to include monitoring behaviour. Compared to this work, our transformations are not based on continuations (and we deliberately avoid needing first-order functions to avoid departing too much from the conventional hardware programming mindset). We use an approach based on operational semantics, similar to that used by da Silva [1992], but different in several ways: (i) we support a different set of directing commands, (ii) we don’t insert commands into the bytecode for the debugger to keep track of separations between subexpressions, and to keep track of the path through the expression (program), (iii) da Silva [1992], introduces a language for specifying debuggers whereas we introduce an operational language for inspecting and changing the program’s runtime state, (iv) we do not consider the equivalence between debuggers. Sansom and Peyton Jones [1997] describe the profiling of functional programs by using “cost centres”, a paradigm to identify locations in a program at an expression-level (rather than functional-level) granularity. Others have continued that to make it more practical Faddegon and Chitil [2015]. All the techniques described above rely on program transformation. They all use functional languages as examples whereas we use a simpler imperative language, to model the paradigm of register-level hardware programming more directly. Because of the weaving of debugging code into the program all these techniques can (retrospectively) be seen as special-cases of aspect-oriented programming, described next.
Aspect-oriented programming (AOP).
AOP involves the inclusion (“weaving”) of code (called “advice”) during compile-time or run-time, depending on whether certain compile- or run-time conditions are satisfied. AOP is a linchpin paradigm for tracing and monitoring Avgustinov et al. [2006]; Hamlen and Jones [2008] but advice can be arbitrary functions, and as a consequence they might have undesirable effects on runtime Avgustinov et al. [2007]. This is an important characteristic to our work, where we wanted to reduce the power of added code. Djoko Djoko et al. [2012] have categorised advice based on the degree of influence they can have on the observable behaviour of a program; and Dantas and Walker [2006] characterise less intrusive advice in their work on “harmless advice”.
6 Conclusion
Having poor programming and debugging support hinders the potential of computing architectures such as FPGAs, which are gaining importance in modern datacentres. By using a program directing approach we subsume several activities that can involve the interactive runtime analyses of programs Sosič [1992]. Our language-based approach has two extensibility benefits: (i) more efficient controllers can be implemented without changing the source language, and (ii) third-parties could extend or customise the language of direction commands without changing the controller that these commands compile to.
Using a program director brings security risks, since it may alter the control-flow of a program, and this may be exploited Abadi et al. [2005]. We sought to mitigate this risk by making the presence of the debug mode very apparent, to reduce the chances of excessive debug functionality being included in deployment Pauli [2016]. Dynascope was used to diagnose errors in the Dynascope compiler itself [Sosič, 1992, §3.1], but bugs could render such a task impossible, for reasons similar to the hereditary potential of vulnerabilities in compilers Thompson [1984]. This highlights the preference to have the code for the director be “correct by construction”, preferably automatically generated.
In work such as this we invariable come across the observer effect Mytkowicz et al. [2008] that monitoring code has on the monitored code. This is known to affect the visibility of timing bugs in software Neville-Neil [2014], but even “invisible” such bugs can leak important information to an adversary Cock et al. [2014].
The overhead due to monitoring is a very important consideration when evaluating system measurements, and monitoring systems try to do their utmost to reduce it Gregg and Mauro [2011]; Anderson et al. [2014]. A key weakness of our prototype is that it does not use low-level (RTL-level) techniques to reduce overhead, but we mitigate this by allowing extension points to be specialised, e.g., these may only be a breakpoint, a watchpoint, or both, etc. This simplifies the circuitry we get. A more sophisticated approach would involve organising the director to operate in a different clock domain if possible, following McKechnie et al. [2009]. Not having to sustain a large clock-distribution network leads to power saving, since unused logic blocks don’t need to be switched, and less heat is dissipated from leakage. It also makes placement and routing easier, which usually reduces the compilation time.
The main strength of our approach is that it provides a uniform interface for the flexible directing of software and hardware instances of programs at runtime. To our knowledge no other system provides this. We used an HLS system that allows us to run the resulting code both on software and on hardware, but the debugging methods used for either were hitherto separate.
We thank the many people who contributed to this paper. Matthew Grosvenor helped us with evaluation ideas and reusing the QJump infrastructure. Olaf Chitil, Paolo Costa, Klaus Gleissenthall, Tim Harris, Simon Moore, and Robert Soulé helped improve the paper through their feedback.
This work has received funding from the EPSRC NaaS grant EP/K034723/1, European Union’s Horizon 2020 research and innovation programme 2014-2018 under the SSICLOPS (grant agreement No. 644866), and the Leverhulme Trust Early Career Fellowship ECF-2016-289.
References
- Abadi et al. [2005] M. Abadi, M. Budiu, U. Erlingsson, and J. Ligatti. Control-flow Integrity. In Proceedings of the 12th ACM Conference on Computer and Communications Security, CCS ’05, pages 340–353, New York, NY, USA, 2005. ACM. ISBN 1-59593-226-7. 10.1145/1102120.1102165. URL http://doi.acm.org/10.1145/1102120.1102165.
- Anderson et al. [2014] J. Anderson, R. N. M. Watson, D. Chisnall, K. Gudka, I. Marinos, and B. Davis. TESLA: Temporally Enhanced System Logic Assertions. In Proceedings of the Ninth European Conference on Computer Systems, EuroSys ’14, pages 19:1–19:14, New York, NY, USA, 2014. ACM. ISBN 978-1-4503-2704-6. 10.1145/2592798.2592801. URL http://doi.acm.org/10.1145/2592798.2592801.
- Antichi et al. [2014] G. Antichi, M. Shahbaz, Y. Geng, N. Zilberman, A. Covington, M. Bruyere, N. McKeown, N. Feamster, B. Felderman, M. Blott, et al. OSNT: Open source network tester. IEEE Network, 28(5):6–12, 2014.
- Avgustinov et al. [2006] P. Avgustinov, E. Bodden, E. Hajiyev, L. Hendren, O. Lhoták, O. de Moor, N. Ongkingco, D. Sereni, G. Sittampalam, J. Tibble, and M. Verbaere. Aspects for Trace Monitoring. In Proceedings of the First Combined International Conference on Formal Approaches to Software Testing and Runtime Verification, FATES’06/RV’06, pages 20–39, Berlin, Heidelberg, 2006. Springer-Verlag. ISBN 3-540-49699-8, 978-3-540-49699-1. 10.1007/11940197_2. URL http://dx.doi.org/10.1007/11940197_2.
- Avgustinov et al. [2007] P. Avgustinov, J. Tibble, and O. de Moor. Making Trace Monitors Feasible. SIGPLAN Not., 42(10):589–608, Oct. 2007. ISSN 0362-1340. 10.1145/1297105.1297070. URL http://doi.acm.org/10.1145/1297105.1297070.
- Ball et al. [2006] T. Ball, E. Bounimova, B. Cook, V. Levin, J. Lichtenberg, C. McGarvey, B. Ondrusek, S. K. Rajamani, and A. Ustuner. Thorough Static Analysis of Device Drivers. SIGOPS Oper. Syst. Rev., 40(4):73–85, Apr. 2006. ISSN 0163-5980. 10.1145/1218063.1217943. URL http://doi.acm.org/10.1145/1218063.1217943.
- Balzer [1969] R. M. Balzer. EXDAMS: EXtendable Debugging and Monitoring System. In Proceedings of the May 14-16, 1969, Spring Joint Computer Conference, AFIPS ’69 (Spring), pages 567–580, New York, NY, USA, 1969. ACM. 10.1145/1476793.1476881. URL http://doi.acm.org/10.1145/1476793.1476881.
- Bennetts and Osseyran [1991] R. G. Bennetts and A. Osseyran. IEEE standard 1149.1-1990 on boundary scan: History, literature survey, and current status. Journal of Electronic Testing, 2(1):11–25, 1991. ISSN 1573-0727. 10.1007/BF00134941. URL http://dx.doi.org/10.1007/BF00134941.
- Calagar et al. [2014] N. Calagar, S. D. Brown, and J. H. Anderson. Source-level debugging for FPGA high-level synthesis. In 2014 24th International Conference on Field Programmable Logic and Applications (FPL), pages 1–8, Sept 2014. 10.1109/FPL.2014.6927496.
- Camera et al. [2005] K. Camera, H. K.-H. So, and R. W. Brodersen. An Integrated Debugging Environment for Reprogrammble Hardware Systems. In Proceedings of the Sixth International Symposium on Automated Analysis-driven Debugging, AADEBUG’05, pages 111–116, New York, NY, USA, 2005. ACM. ISBN 1-59593-050-7. 10.1145/1085130.1085145. URL http://doi.acm.org/10.1145/1085130.1085145.
- Chu et al. [2015] T. V. Chu, S. Sato, and K. Kise. Ultra-fast NoC emulation on a single FPGA. In 2015 25th International Conference on Field Programmable Logic and Applications (FPL), pages 1–8, Sept 2015. 10.1109/FPL.2015.7294021.
- Cock et al. [2014] D. Cock, Q. Ge, T. Murray, and G. Heiser. The Last Mile: An Empirical Study of Timing Channels on seL4. In Proceedings of the 2014 ACM SIGSAC Conference on Computer and Communications Security, CCS ’14, pages 570–581, New York, NY, USA, 2014. ACM. ISBN 978-1-4503-2957-6. 10.1145/2660267.2660294. URL http://doi.acm.org/10.1145/2660267.2660294.
- Curreri et al. [2011] J. Curreri, G. Stitt, and A. D. George. High-level Synthesis of In-circuit Assertions for Verification, Debugging, and Timing Analysis. Int. J. Reconfig. Comput., 2011:1:1–1:17, Jan. 2011. ISSN 1687-7195. 10.1155/2011/406857. URL http://dx.doi.org/10.1155/2011/406857.
- da Silva [1992] F. Q. B. da Silva. Correctness Proofs of Compilers and Debuggers: an Approach Based on Structural Operational Semantics. PhD thesis, School of Informatics, University of Edinburgh, Oct. 1992.
- Dantas and Walker [2006] D. S. Dantas and D. Walker. Harmless Advice. In Conference Record of the 33rd ACM SIGPLAN-SIGACT Symposium on Principles of Programming Languages, POPL ’06, pages 383–396, New York, NY, USA, 2006. ACM. ISBN 1-59593-027-2. 10.1145/1111037.1111071. URL http://doi.acm.org/10.1145/1111037.1111071.
- Djoko Djoko et al. [2012] S. Djoko Djoko, R. Douence, and P. Fradet. Aspects Preserving Properties. Sci. Comput. Program., 77(3):393–422, Mar. 2012. ISSN 0167-6423. 10.1016/j.scico.2011.10.010. URL http://dx.doi.org/10.1016/j.scico.2011.10.010.
- Faddegon and Chitil [2015] M. Faddegon and O. Chitil. Algorithmic Debugging of Real-world Haskell Programs: Deriving Dependencies from the Cost Centre Stack. In Proceedings of the 36th ACM SIGPLAN Conference on Programming Language Design and Implementation, PLDI ’15, pages 33–42, New York, NY, USA, 2015. ACM. ISBN 978-1-4503-3468-6. 10.1145/2737924.2737985. URL http://doi.acm.org/10.1145/2737924.2737985.
- Fitzpatrick [2004] B. Fitzpatrick. Distributed caching with memcached. Linux Journal, 2004(124), 2004.
- Fix [2008] L. Fix. Fifteen Years of Formal Property Verification in Intel, pages 139–144. Springer Berlin Heidelberg, Berlin, Heidelberg, 2008. ISBN 978-3-540-69850-0. 10.1007/978-3-540-69850-0_8. URL http://dx.doi.org/10.1007/978-3-540-69850-0_8.
- Foster [2008] H. Foster. Assertion-Based Verification: Industry Myths to Realities, pages 5–10. Springer Berlin Heidelberg, Berlin, Heidelberg, 2008. ISBN 978-3-540-70545-1. 10.1007/978-3-540-70545-1_3. URL http://dx.doi.org/10.1007/978-3-540-70545-1_3.
- Gagnon et al. [2007] M. N. Gagnon, S. Taylor, and A. K. Ghosh. Software protection through anti-debugging. IEEE Security Privacy, 5(3):82–84, May 2007. ISSN 1540-7993. 10.1109/MSP.2007.71.
- Godefroid et al. [2012] P. Godefroid, M. Y. Levin, and D. Molnar. SAGE: Whitebox Fuzzing for Security Testing. Commun. ACM, 55(3):40–44, Mar. 2012. ISSN 0001-0782. 10.1145/2093548.2093564. URL http://doi.acm.org/10.1145/2093548.2093564.
- Goeders and Wilton [2014] J. Goeders and S. J. E. Wilton. Effective FPGA Debug for High-Level Synthesis Generated Circuits. In 2014 24th International Conference on Field Programmable Logic and Applications (FPL), pages 1–8, Sept 2014. 10.1109/FPL.2014.6927498.
- Goeders and Wilton [2016] J. Goeders and S. J. E. Wilton. Quantifying observability for in-system debug of high-level synthesis circuits. In 2016 26th International Conference on Field Programmable Logic and Applications (FPL), pages 1–11, Aug 2016. 10.1109/FPL.2016.7577371.
- Golan and Hanson [1993] M. Golan and D. R. Hanson. Duel – A Very High-Level Debugging Language. In USENIX Winter Conference, pages 107–117, 1993.
- Gregg and Mauro [2011] B. Gregg and J. Mauro. DTrace: Dynamic Tracing in Oracle Solaris, Mac OS X, and FreeBSD. Prentice Hall Professional, 2011.
- Hamlen and Jones [2008] K. W. Hamlen and M. Jones. Aspect-oriented In-lined Reference Monitors. In Proceedings of the Third ACM SIGPLAN Workshop on Programming Languages and Analysis for Security, PLAS ’08, pages 11–20, New York, NY, USA, 2008. ACM. ISBN 978-1-59593-936-4. 10.1145/1375696.1375699. URL http://doi.acm.org/10.1145/1375696.1375699.
- Hanson and Raghavachari [1996] D. R. Hanson and M. Raghavachari. A machine-independent debugger. Softw., Pract. Exper., 26(11):1277–1299, 1996.
- Hood [1996] R. Hood. The P2D2 Project: Building a Portable Distributed Debugger. In Proceedings of the SIGMETRICS Symposium on Parallel and Distributed Tools, SPDT ’96, pages 127–136, New York, NY, USA, 1996. ACM. ISBN 0-89791-846-0. 10.1145/238020.238058. URL http://doi.acm.org/10.1145/238020.238058.
- Hung and Wilton [2013] E. Hung and S. J. Wilton. Towards Simulator-like Observability for FPGAs: A Virtual Overlay Network for Trace-buffers. In Proceedings of the ACM/SIGDA International Symposium on Field Programmable Gate Arrays, FPGA ’13, pages 19–28, New York, NY, USA, 2013. ACM. ISBN 978-1-4503-1887-7. 10.1145/2435264.2435272. URL http://doi.acm.org/10.1145/2435264.2435272.
- Hung and Wilton [2014] E. Hung and S. J. E. Wilton. Accelerating FPGA Debug: Increasing Visibility Using a Runtime Reconfigurable Observation and Triggering Network. ACM Trans. Des. Autom. Electron. Syst., 19(2):14:1–14:23, Mar. 2014. ISSN 1084-4309. 10.1145/2566668. URL http://doi.acm.org/10.1145/2566668.
- Johnson [1977] M. S. Johnson. The Design of a High-level, Language-independent Symbolic Debugging System. In Proceedings of the 1977 Annual Conference, ACM ’77, pages 315–322, New York, NY, USA, 1977. ACM. ISBN 978-1-4503-3921-6. 10.1145/800179.810221. URL http://doi.acm.org/10.1145/800179.810221.
- Kishon et al. [1991] A. Kishon, P. Hudak, and C. Consel. Monitoring Semantics: A Formal Framework for Specifying, Implementing, and Reasoning About Execution Monitors. In Proceedings of the ACM SIGPLAN 1991 Conference on Programming Language Design and Implementation, PLDI ’91, pages 338–352, New York, NY, USA, 1991. ACM. ISBN 0-89791-428-7. 10.1145/113445.113474. URL http://doi.acm.org/10.1145/113445.113474.
- Koch et al. [1998] G. H. Koch, W. Rosenstiel, and U. Kebschull. Breakpoints and Breakpoint Detection in Source-level Emulation. ACM Trans. Des. Autom. Electron. Syst., 3(2):209–230, Apr. 1998. ISSN 1084-4309. 10.1145/290833.290843. URL http://doi.acm.org/10.1145/290833.290843.
- Krishnaswamy et al. [2008] S. Krishnaswamy, I. L. Markov, and J. P. Hayes. On the Role of Timing Masking in Reliable Logic Circuit Design. In Proceedings of the 45th Annual Design Automation Conference, DAC ’08, pages 924–929, New York, NY, USA, 2008. ACM. ISBN 978-1-60558-115-6. 10.1145/1391469.1391703. URL http://doi.acm.org/10.1145/1391469.1391703.
- Lee and Lysecky [2015] J. C. Lee and R. Lysecky. System-Level Observation Framework for Non-Intrusive Runtime Monitoring of Embedded Systems. ACM Trans. Des. Autom. Electron. Syst., 20(3):42:1–42:27, June 2015. ISSN 1084-4309. 10.1145/2717310. URL http://doi.acm.org/10.1145/2717310.
- McKechnie et al. [2009] P. E. McKechnie, M. Blott, and W. A. Vanderbauwhede. Debugging FPGA-based Packet Processing Systems Through Transaction-level Communication-centric Monitoring. SIGPLAN Not., 44(7):129–136, June 2009. ISSN 0362-1340. 10.1145/1543136.1542470. URL http://doi.acm.org/10.1145/1543136.1542470.
- Milner et al. [1990] R. Milner, M. Tofte, and R. Harper. The Definition of Standard ML. MIT Press, 1990.
- Mittal [2014] S. Mittal. A survey of techniques for improving energy efficiency in embedded computing systems. International Journal of Computer Aided Engineering and Technology, 6(4):440–459, 2014.
- Mockapetris [1987] P. Mockapetris. Domain names – concepts and facilities, Nov. 1987. https://tools.ietf.org/html/rfc1034.
- Monson and Hutchings [2015] J. S. Monson and B. L. Hutchings. Using Source-Level Transformations to Improve High-Level Synthesis Debug and Validation on FPGAs. In Proceedings of the 2015 ACM/SIGDA International Symposium on Field-Programmable Gate Arrays, FPGA ’15, pages 5–8, New York, NY, USA, 2015. ACM. ISBN 978-1-4503-3315-3. 10.1145/2684746.2689087. URL http://doi.acm.org/10.1145/2684746.2689087.
- Mytkowicz et al. [2008] T. Mytkowicz, P. F. Sweeney, M. Hauswirth, and A. Diwan. Observer Effect and Measurement Bias in Performance Analysis. Technical Report 1042-08, University of Colorado at Boulder, 6 2008.
- Neville-Neil [2014] G. V. Neville-Neil. Outsourcing Responsibility. Commun. ACM, 57(10):28–29, Sept. 2014. ISSN 0001-0782. 10.1145/2661051. URL http://doi.acm.org/10.1145/2661051.
- Panjkov et al. [2015] Z. Panjkov, A. Wasserbauer, T. Ostermann, and R. Hagelauer. Hybrid FPGA debug approach. In 2015 25th International Conference on Field Programmable Logic and Applications (FPL), pages 1–8, Sept 2015. 10.1109/FPL.2015.7294023.
- Pauli [2016] D. Pauli. ‘Pork Explosion’ flaw splatters Foxconn’s Android phones. Oct 2016. http://www.theregister.co.uk/2016/10/14/pork_explosion_foxconn_flaw/.
- Potkonjak et al. [1995] M. Potkonjak, S. Dey, and K. Wakabayashi. Design-for-debugging of Application Specific Designs. In Proceedings of the 1995 IEEE/ACM International Conference on Computer-aided Design, ICCAD ’95, pages 295–301, Washington, DC, USA, 1995. IEEE Computer Society. ISBN 0-8186-7213-7. URL http://dl.acm.org/citation.cfm?id=224841.225054.
- Putnam [2014] A. Putnam. Large-Scale Reconfigurable Computing in a Microsoft Datacenter. In Proceedings of the 26th IEEE HotChips Symposium on High-Performance Chips (HotChips 2014). IEEE, August 2014.
- Putnam et al. [2014] A. Putnam, A. M. Caulfield, E. S. Chung, D. Chiou, K. Constantinides, J. Demme, H. Esmaeilzadeh, J. Fowers, G. P. Gopal, J. Gray, M. Haselman, S. Hauck, S. Heil, A. Hormati, J. Y. Kim, S. Lanka, J. Larus, E. Peterson, S. Pope, A. Smith, J. Thong, P. Y. Xiao, and D. Burger. A reconfigurable fabric for accelerating large-scale datacenter services. In 2014 ACM/IEEE 41st International Symposium on Computer Architecture (ISCA), pages 13–24, June 2014. 10.1109/ISCA.2014.6853195.
- Ramsey and Hanson [1992] N. Ramsey and D. R. Hanson. A Retargetable Debugger. In Proceedings of the ACM SIGPLAN 1992 Conference on Programming Language Design and Implementation, PLDI ’92, pages 22–31, New York, NY, USA, 1992. ACM. ISBN 0-89791-475-9. 10.1145/143095.143112. URL http://doi.acm.org/10.1145/143095.143112.
- Sansom and Peyton Jones [1997] P. M. Sansom and S. L. Peyton Jones. Formally Based Profiling for Higher-order Functional Languages. ACM Trans. Program. Lang. Syst., 19(2):334–385, Mar. 1997. ISSN 0164-0925. 10.1145/244795.244802. URL http://doi.acm.org/10.1145/244795.244802.
- Sari et al. [2014] A. Sari, D. Agiakatsikas, and M. Psarakis. A Soft Error Vulnerability Analysis Framework for Xilinx FPGAs. In Proceedings of the 2014 ACM/SIGDA International Symposium on Field-programmable Gate Arrays, FPGA ’14, pages 237–240, New York, NY, USA, 2014. ACM. ISBN 978-1-4503-2671-1. 10.1145/2554688.2554767. URL http://doi.acm.org/10.1145/2554688.2554767.
- Schäfer et al. [2008] M. Schäfer, T. Ekman, and O. de Moor. Challenge Proposal: Verification of Refactorings. In Proceedings of the 3rd Workshop on Programming Languages Meets Program Verification, PLPV ’09, pages 67–72, New York, NY, USA, 2008. ACM. ISBN 978-1-60558-330-3. 10.1145/1481848.1481859. URL http://doi.acm.org/10.1145/1481848.1481859.
- Shepherdson and Sturgis [1963] J. C. Shepherdson and H. E. Sturgis. Computability of Recursive Functions. J. ACM, 10(2):217–255, Apr. 1963. ISSN 0004-5411. 10.1145/321160.321170. URL http://doi.acm.org/10.1145/321160.321170.
- Singh and Greaves [2008] S. Singh and D. J. Greaves. Kiwi: Synthesis of FPGA Circuits from Parallel Programs. In Field-Programmable Custom Computing Machines, pages 3–12, 2008.
- Smith and van Leeuwen [1974] C. H. Smith and J. van Leeuwen. Microprogrammed Random Access Stored Program Machines. SIGACT News, 6(3):23–32, July 1974. ISSN 0163-5700. 10.1145/1008311.1008315. URL http://doi.acm.org/10.1145/1008311.1008315.
- So et al. [2002] B. So, M. W. Hall, and P. C. Diniz. A Compiler Approach to Fast Hardware Design Space Exploration in FPGA-based Systems. In Proceedings of the ACM SIGPLAN 2002 Conference on Programming Language Design and Implementation, PLDI ’02, pages 165–176, New York, NY, USA, 2002. ACM. ISBN 1-58113-463-0. 10.1145/512529.512550. URL http://doi.acm.org/10.1145/512529.512550.
- Sosič and Abramson [1997] R. Sosič and D. Abramson. Guard: A relative debugger. Software: Practice and Experience, 27(2):185–206, 1997.
- Sosič [1992] R. Sosič. Dynascope: A Tool for Program Directing. SIGPLAN Not., 27(7):12–21, July 1992. ISSN 0362-1340. 10.1145/143103.143110. URL http://doi.acm.org/10.1145/143103.143110.
- Sosič [1995] R. Sosič. A Procedural Interface for Program Directing. Software: Practice and Experience, 25(7):767–787, 1995. ISSN 1097-024X. 10.1002/spe.4380250704. URL http://dx.doi.org/10.1002/spe.4380250704.
- Thompson [1984] K. Thompson. Reflections on Trusting Trust. Commun. ACM, 27(8):761–763, Aug. 1984. ISSN 0001-0782. 10.1145/358198.358210. URL http://doi.acm.org/10.1145/358198.358210.
- Todman et al. [2015] T. Todman, S. Stilkerich, and W. Luk. In-circuit Temporal Monitors for Runtime Verification of Reconfigurable Designs. In Proceedings of the 52Nd Annual Design Automation Conference, DAC ’15, pages 50:1–50:6, New York, NY, USA, 2015. ACM. ISBN 978-1-4503-3520-1. 10.1145/2744769.2744856. URL http://doi.acm.org/10.1145/2744769.2744856.
- Tripp et al. [2002] J. L. Tripp, P. A. Jackson, and B. L. Hutchings. Sea Cucumber: A Synthesizing Compiler for FPGAs, pages 875–885. Springer Berlin Heidelberg, Berlin, Heidelberg, 2002. ISBN 978-3-540-46117-3. 10.1007/3-540-46117-5_90. URL http://dx.doi.org/10.1007/3-540-46117-5_90.
- Wang et al. [2011] D. Wang, N. E. Jerger, and J. G. Steffan. DART: A Programmable Architecture for NoC Simulation on FPGAs. In Proceedings of the Fifth ACM/IEEE International Symposium on Networks-on-Chip, NOCS ’11, pages 145–152, New York, NY, USA, 2011. ACM. ISBN 978-1-4503-0720-8. 10.1145/1999946.1999970. URL http://doi.acm.org/10.1145/1999946.1999970.
- Winterbottom [1994] P. Winterbottom. ACID: A Debugger Built From A Language. In USENIX Winter Conference, pages 211–222, 1994.
- Zhu [2001] M.-Y. Zhu. Formal Specifications of Debuggers. SIGPLAN Not., 36(9):54–63, Sept. 2001. 10.1145/609769.609778. URL http://doi.acm.org/10.1145/609769.609778.
- Zilberman et al. [2014] N. Zilberman, Y. Audzevich, G. A. Covington, and A. W. Moore. NetFPGA SUME: Toward 100 Gbps as Research Commodity. IEEE Micro, 34(5):32–41, 2014.
Appendix A More program direction commands
Program-level predicates and functions mentioned in these definitions are given in §B.
A.1 Tracing
We continue from §3.5.2, where the symbols we use here are introduced (such as and ).
) ∈C p p
where
Next we add the command to check whether the trace buffer is full. {mathpar} \inferrule() ∈C p p
where
Finally the command to retrieve the contents of the trace buffer. Here we first find out the current index value for the trace buffer, then we work back and extract the buffer’s contents. {mathpar} \inferrule() ∈C p p
A.2 Watching
This bears some similarity to the rule to start tracing (in §3.5.2) since we inspect the variable after it’s updated, and carry out some action. When tracing, this action consists of writing to the trace buffer. When watching, it consists of breaking.
X ∈Var_p
∀L ∈X_L. L /∈p
Positions_p’(X_L) = PostUpdate_p’(X)
p <_X_L p’
p
p’
where
Unwatching a variable follows a pattern we’ve encountered before, when stopping
tracing for instance.
{mathpar}
\inferrule() ∈C
Positions_p(X_L) = PostUpdate_p(X)
p
p
where
A.3 Profiling
We could profile programs to count the number of writes and reads of variables, or function calls. We show the rule for counting the number of writes; counting variable reads and function calls are similar, differing in the positioning of labels. That is, to count writes we position labels immediately after each line that updates that variable–this is similar to tracing (§3.5.2) and watching (§A.2). To count variable reads we position after lines in which those variables appear. To count function calls we position just before the first line in the function.
X ∈Var_p
∀L ∈X_L. L /∈p
Positions_p’(X_L) = PostUpdate_p’(X)
p <_X_L p’
p
p’
where
Stopping the count, clearing it, printing the current count, and checking whether the maximum value has been reached, is done in a very similar way to the rules for tracing (§3.5.2).
Appendix B Program analyses and transformations
A position of statement in program is a vector where . Intuitively, the first position of the vector refers to the function in which the statement is positioned. The second until the last positions indicate statements (and substatements, in the case of if-then statements) in which the statement is positioned, moving from the outermost to the innermost containing statement. Within the innermost containing statement, if the statement number is , then the last component of the vector is either or , depending on whether it points to just before or just after the statement.
Definition B.1 (Positions).
Let
Then
where is , the number of function declarations in .
Let and . Then
Finally,
Next we define a function maps a position in to the corresponding statement , in symbols: .
Definition B.2 (Statement at a position).
Let
Then we define
Let and . Then
Finally,
Definition B.3 (Program contains label ).
We write iff .
Note that a label may only be used at most once in a program. We expect the following to hold for all programs. We do not include this as a premise to any of the rules, to reduce clutter.
We now formalise the predicate that programs and are identical save for the addition of in one of the extension points.
Definition B.4 (Program identity modulo label ).
We define a related predicate that formalises whether two programs are related by the above predicate through an ‘interpolation’ of labels drawn from a set.
Definition B.5 (Program identity modulo set of labels).
Let is a set of labels. Then,
Definition B.6 (Set of variables in program ).
Let and . Then
Definition B.7 (Set of variables in program ).
where if then .
The positions in which a label occurs. This should be a singleton set.
Definition B.8 (Positions of label ).
We lift this to work on sets of labels and overload the notation: if is a set of labels then
Appendix C Language semantics
C.1 CASP machines
The specification of CASP machines was given in §3.2.
The machine’s configuration consists of the triple , where indicates whether the machine is operating in batch or interactive modes respectively, and indicates the machine’s memory: are the counters, the arrays, and the stored procedures.
The machine’s big-step operational semantics are described using the notation to indicate that the machine operates in the context of a specific label to evaluate program into numeral , and possibly updating the other components of its configuration. We use the notation to abbreviate when and are unaffected by the evaluation.
The semantic rules are given in Figure 6. We use the notation to denote a total injective map from labels to numerals. Thus we can identify which label is being executed. If in interactive mode the director sends “break” to the controller, the director learns the label that broke.
Note that the “continue” and “break” commands change the state of the component of the configuration, switching it to batch (resuming the program) and interactive respectively.
Note also that placement () is only allowed during interactive mode (i.e., ) since we do not want the controller to normally run code that updates other extension points’ code.
N = {1 (op = (=) ∧N1= N2)∨(op = (<) ∧N1< N2)-1 o/w
M = {N + 1 op = incN - 1 op = dec
S(C, X) = N
S(R[A], N) = M
P = {P1N = 1P2N = -1
ia/= ia’
ia= ia’
C.2 Example language
The syntax for the example language was given in §3.4.1. In this language we have a valuation function for identifiers , and a configuration for the reduction semantics consists of a triple where is either a statement, a ‘return’ statement, or an expression: . denotes a sequence of 1 or more such : where . We define the concatenation operator such that if where , then .
Intuitively, describes a configuration where is to be evaluated “now”, and is to be executed after has been evaluated. The evaluation rules are given in Figure 7.
To reduce clutter in the rules, we assume two pieces implicit state, that we avoid threading around the configurations. The first is a mapping from function names to their bodies, and the second is the state of the CASP machine , which includes the valuation that models the store for program variables.
We use the following evaluation context for syntactic objects in (statements, ‘return’ statements, and expressions):
We handle ‘extend’ by expanding it to a sequence of singleton extends, and invoking the rule in Figure 8.
N ≤0
N > 0
M = {N1+ N2op = +N1- N2op = -1 op = (==) ∧N1= N20 op = (==) ∧N1/= N21 op = (<) ∧N1< N20 op = (<) ∧N1≥N2
(, ¯s;) ∈F
Rules for model the interactive mode between the director and the controller. In these semantics we only see evaluation from the point of view of the program: the program’s evaluation yields to the controller at extension points, which either yields back to the program (in case of continue) or else switches to interactive mode (in case of break), leading to an interleaving between (obtaining a command from the director) and (executing it). Note that the rules for are side-effecting, and are formalised as such similar to streams as used by Milner et al. [1990]. In the rules for , is a command obtained from the director, and is a result sent back to the director.
L ⊢(S, ∙) ↷(S’, ∘)
L ⊢(S’, ∙) ↷(S”, ∘)
L ⊢(S, ∙) ↷(S”, ∘)
L ⊢(S, ∙) ↷(S’, ∘)