Improved I-vector-based Speaker Recognition for Utterances with Speaker Generated Non-speech sounds
Abstract
Conversational speech not only contains several variants of neutral speech but is also prominently interlaced with several speaker generated non-speech sounds such as laughter and breath. A robust speaker recognition system should be capable of recognizing a speaker irrespective of these variations in his speech. An understanding of whether the speaker-specific information represented by these variations is similar or not helps build a good speaker recognition system. In this paper, speaker variations captured by neutral speech of a speaker is analyzed by considering speech-laugh (a variant of neutral speech) and laughter (non-speech) sounds of the speaker. We study an i-vector-based speaker recognition system trained only on neutral speech and evaluate its performance on speech-laugh and laughter. Further, we analyze the effect of including laughter sounds during training of an i-vector-based speaker recognition system. Our experimental results show that the inclusion of laughter sounds during training seem to provide complementary speaker-specific information which results in an overall improved performance of the speaker recognition system, especially on the utterances with speech-laugh segments.
Index Terms: speaker recognition, i-vector, neutral speech, laughter, speech-laugh, non-speech sounds
1 Introduction
The flexibility of the human speech production system not only allows production of several variants of neutral speech depending on the emotional and physical state of the speaker, but also allows production of several non-speech sounds such as laughter, cry, cough, etc. These variations being produced by the speech production system of the same speaker might carry certain speaker-specific information. However, it is not immediately clear if these variations in speech carry the same speaker-specific information or not.
Speaker recognition refers to the task of identifying the speaker using speech as the only cue [1]. In recent years, speaker recognition systems have gained a significant improvement in performance making them more viable for commercial applications. Current state-of-the-art speaker recognition systems employ i-vector-based approaches, where the feature sequence representing the speech signal are characterized by low-dimensional fixed length vectors called identity-vectors (i-vectors in short) [2], [3], [4], [5]. These i-vectors are obtained by projecting the speech signal onto a subspace , referred to as “total variability space”, which contains both speaker and channel variabilities, simultaneously [2]. I-vector-based approaches are well established as they have shown a significant improvement in speaker recognition performances. However, it is not immediately clear the relationship between different types of speech produced by a speaker on the performance of an i-vector-based speaker recognition system. More explicitly, there is a need to identify if the neutral speech of a speaker is sufficient to represent the speaker-specific characteristics completely, irrespective of the variations in speech produced by the speaker. This information is essential for developing good and robust speaker recognition and diarization systems.
Only a few studies have analyzed the effect of considering different variations in speech, especially the non-speech sounds such as breath, whistle, scream, and breathy speech (a variant of neutral speech produced when breath co-occurs with speech) on the performance of the speaker recognition systems trained using neutral speech, for example [6], [7], [8] and more recently [9]. It is evident from earlier studies that the performance of the speaker recognition system trained using only neutral speech of the speaker degrades, if these variations in speech are a part of the testing phase of the system. However, most of these studies considered traditional Gaussian mixture models with universal background model (GMM-UBM) for their study but not the state-of-the-art i-vector-based systems. Also, these studies considered only non-speech sounds (such as breath, whistle etc.) but not their speech co-occurring counterparts such as speech-laugh. In natural conversations, a significant part of the non-speech sounds co-occur with speech to produce variants of neutral speech such as speech-laugh, breathy speech, etc., [9], [10], [11]. This emphasizes the need to analyze the robustness of the i-vector-based systems to such variations. Furthermore, to the best of our knowledge, none of the previous studies have analyzed the effect of including these non-speech sounds in the enrollment phase of i-vector-based speaker recognition systems. Although, recent studies show that the inclusion of breath sounds in the training phase improves the performance of GMM-UBM and deep neural network based speaker recognition systems on breathy speech [9], it is to be systematically verified whether this observation holds true for other non-speech sounds, and even on i-vector-based systems.
The main objectives of this analysis are twofold. They are
-
1.
To investigate whether the i-vectors extracted from the neutral speech of a speaker are robust to the various variations in speech produced by the speaker.
-
2.
To analyze the performance of i-vector-based speaker recognition systems when non-speech sounds along with neutral speech of the speaker are included in the enrollment phase of the systems.
To achieve these objectives, speech-laugh (a variant of neutral speech) segments of the speaker are considered to evaluate the performance of speaker recognition system developed using neutral speech. Further, laughter sounds collected from the speaker are included in the enrollment phase of the system. These systems are evaluated on both neutral speech and speech-laugh of the speaker to find the presence of any complimentary speaker-specific information provided by laughter. The significance of this analysis is evident from the fact that laughter is one of the most common non-speech sound which occurs very frequently in natural conversations [12], and more than % of these laughter sounds happen to be speech-laughs [13].
The organization of the paper is as follows. Section 2 explains the approach followed for analysis. Section 3 summarizes the dataset and the i-vector-based speaker recognition system considered. Experimental results are given in Section 4. Summary along with conclusions are given in Section 5

2 Background
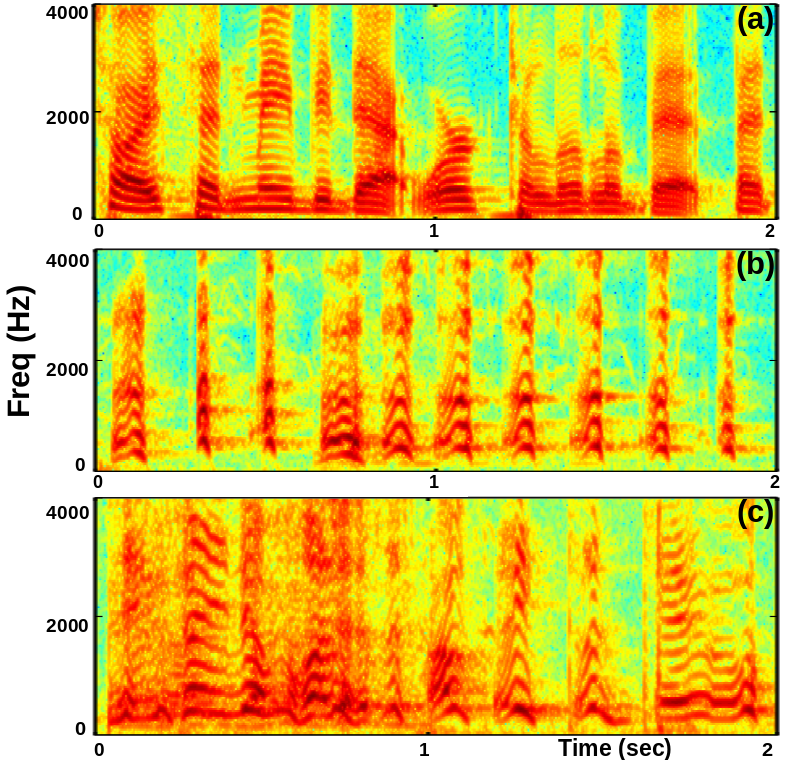
Analysis is performed by considering neutral speech, speech-laugh and laughter sounds produced by the speakers. Here, neutral speech refers to the normal/regular speech of the speaker. Laughter is a highly variable non-speech sound which is typically produced by a series of sudden bursts of air through the vocal tract system [14]. Laughter sounds can be either voiced or unvoiced [15], [16]. In this analysis, both, voiced and unvoiced laughter sounds of the speaker are considered. In conversational speech, laughter sounds frequently co-occur with neutral speech to produce segments called speech-laugh [17], [18]. Speech-laugh is not produced by simply superimposing laughter on speech but its production involves a complex vocal configuration, which exhibits characteristics of both laughter and neutral speech [13], [19]. The spectral features obtained for laughter, speech-laugh and neutral speech form a continuum, with laughter exhibiting higher formant frequencies (particularly, first formant frequency) followed by speech-laugh and then neutral speech [18], [20]. This can be observed from the spectrograms obtained for neutral speech, laughter and speech-laugh samples of the same speaker (as shown in Figure 1). This variation in formant frequencies, which might carry speaker-specific information [21], can effect the performance of the speaker recognition systems trained on neutral speech but tested on speech-laugh and laughter segments. The effect of such variations on speaker recognition systems is analyzed in this study.
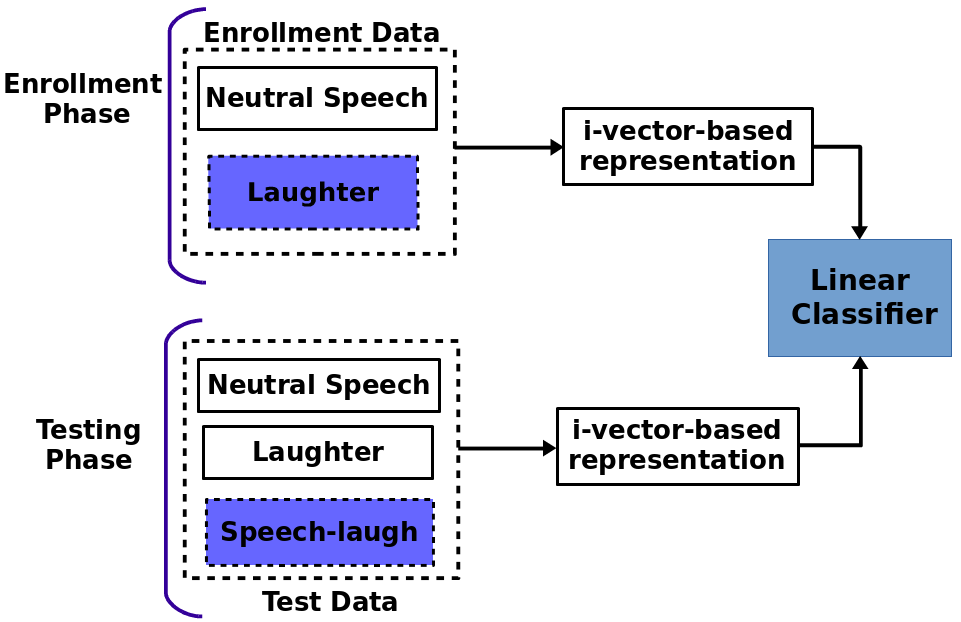
The approach followed for the analysis is depicted in Figure 2. It can be observed from Figure 2 that apart from neutral speech, laughter data collected from the speakers is also included in the enrollment phase of the speaker recognition system. For analysis, two different i-vector-based systems are developed, one using only neutral speech, and the other is developed considering both, laughter and neutral speech of the speakers. The effect of including laughter in the enrollment phase is analyzed by evaluating the performance of both systems when speech-laugh of the speakers (which is not available in the enrollment phase of either of the two systems) is provided as input apart from laughter and neutral speech of the speakers.

3 Experimental details
For this analysis, GMM-UBM and i-vector statistics provided in the Voice biometry standardization (VBS) [22] toolkit are used. In VBS toolkit, GMM-UBM with 2048 components was trained using NIST SRE 2004-2008 data and the T matrix required for i-vector extraction was trained using Fisher English (Part and ), NIST SRE , and Switchboard corpus (Phase , Phase , cellular part and cellular part ). But standard speaker recognition corpus such as NIST SRE does not include speech transcripts, especially for non-speech sounds. Hence, the enrollment and the test i-vectors used in this analysis are obtained using Buckeye corpus of conversational speech [23]. Buckeye corpus of conversational speech, contains several hours of high quality recordings collected from speakers ( male and female). This high quality conversational speech data was collected from the speakers in the form of informal interactions between the speaker and an interviewer. The corpus is phonetically labeled. Additionally, the laughter and speech-laugh segments produced by the speaker are separately labeled along with their timestamps. In this work, we considered a subset of Buckeye corpus data collected from speakers ( male and female), whose recordings have a significant amount of laughter and speech-laugh content.
3.1 Data Organization
For the purpose of analysis, we organized the Buckeye corpus into different datasets as shown in Table 1. The speech of the speaker, in the corpus, is marked as neutral speech (Ns), laughter (L) and speech-laugh (Sl). It can be observed from Table 1 that enrollment sets (namely, Es1 and Es2) of Dset1 (Ns) and Dset2 (Ns + L) are used in enrollment phase of the speaker recognition system, whereas test sets of all datasets (i.e., Ts1 through Ts7) are used in the testing phase. The enrollment set in Dset2 (namely, Es2) consists a total of utterances ( Ns utterances and L utterances) each of sec to sec in duration. But every utterance in Ts2 contains both Ns and L. Similarly, every utterance in test set of Dset3, Dset4 and Dset7 (namely, Ts3, Ts4 and Ts7) contains the speech types as specified in Table 1. It is to be noted that Sl is not used in the enrollment phase but only in the testing phase to analyze the effect of considering laughter sounds in the enrollment phase of speaker recognition systems.
| # Utterances/speaker | ||||
| Dataset | Contents | Enrollment (Es) | Test (Ts) | Duration (sec) |
| Dset1 | Neutral speech (Ns) | Es1 = 50 | Ts1 = 25 | 2.5-3 |
| Dset2 | Neutral speech and laughter (Ns + L) | Es2 = 50 | Ts2 = 15 | 2.5-3 |
| Dset3 | Neutral speech and speech-laugh (Ns + Sl) | - | Ts3 = 15 | 2.5-3 |
| Dset4 | Neutral speech, laughter and speech-laugh (Ns + L + Sl) | - | Ts4 = 15 | 2.5-3 |
| Dset5 | Laughter (L) | - | Ts5 = 10 | 2.5-3 |
| Dset6 | Speech-laugh (Sl) | - | Ts6 = 10 | 2.5-3 |
| Dset7 | Laughter and speech-laugh (L + Sl) | - | Ts7 = 10 | 2.5-3 |
3.2 System description
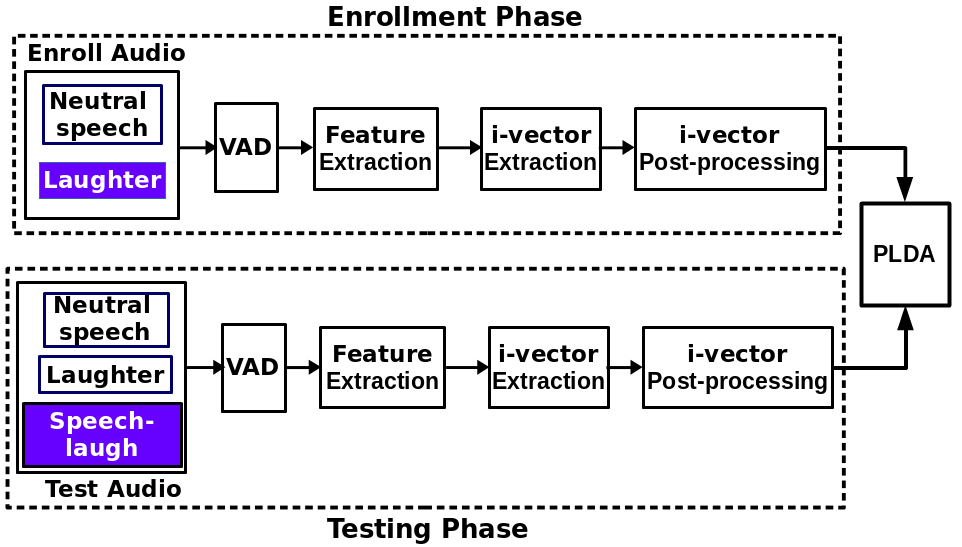
The i-vector-based speaker recognition systems considered for analysis are implemented using the VBS [22] toolkit. Figure 3 shows the schematic of the system implementation using VBS and consists of the audio, voice activity detection (VAD), feature extraction, i-vector extraction and post processing. We use probabilistic linear discriminant analysis (PLDA) as the metric to measure the performance of the speaker recognition system. We describe these blocks in more detail [22].
Audio: The audio data considered in the enrollment phase (see Enroll Audio in Figure 3) consists of Ns and L sounds of each speaker. Whereas the audio data in the testing phase (see Test Audio in Figure 3) consists of Ns, L and Sl. All the audio samples are down sampled to kHz and are in -bit PCM format as required by the VBS.
Voice activity detection (VAD): VAD is used prior to feature extraction to remove the silence and low signal-to-noise ratio (SNR) regions in the audio sample. In this analysis, VAD is performed using the VOICEBOX toolkit [24].
Feature extraction: Regions of the audio signal retained after VAD are represented using mel-frequency cepstral coefficients (MFCCs). MFCCs are extracted using msec Hamming window with msec forward shift. MFCCs are computed by using mel filter banks and limiting the bandwidth to frequency in the Hz - Hz range. Every frame is represented using coefficients (first MFCCs along with the coefficient). This -dimensional feature vector is mean and variance normalized using sec sliding window. Subsequently, the delta and the double delta coefficients are computed to form a -dimensional feature vector to represent each frame.
i-vector extraction: To obtain a low-dimensional fixed-length i-vector-based representation of the sequence of feature vectors, the GMM-UBM and the i-vector statistics (total variability space (T)) are necessary. In this analysis, the GMM-UBM-based i-vectors are extracted using the GMM-UBM and T matrix statistics released by VBS. The gender-independent universal background model (UBM) with components was trained using NIST SRE data ( hours of data). The total variability space ’T’ of -dimension was trained using Fisher English (Part and ), NIST SRE , Switchboard (Phase , Phase , cellular part and cellular part ) which totals to hours of data.

i-vector post-processing: The i-vectors of -dimensions obtained for each audio sample are reduced to -dimensions using linear discriminant analysis (LDA) [2], [25]. Then these i-vectors are further normalized using within-class covariance matrix [25]. Both, LDA and within-class covariance matrix are provided by VBS and are trained on the same data that is used for ‘T’ matrix enrollment. In this analysis, the speaker templates (namely, i-vectors corresponding to each speaker) are generated separately for the two considered cases (namely, Ns and Ns + L) during the enrollment phase, and an i-vector is obtained for each audio sample during the test phase.
PLDA: To compare the enrollment i-vectors to the test i-vectors for speaker recognition, PLDA is used [4], [26]. PLDA is a special case of joint factor analysis (JFA) with single Gaussian component, but is used in the i-vector space. Given a pair of i-vectors, PLDA computes the log-likelihood score for the same-speaker and the different-speaker hypothesis [27]. This score is used to evaluate the speaker recognition system.
| Test-set | System1 (Es1) | System2 (Es2) |
|---|---|---|
| (Baseline) | (Proposed) | |
| Ts1 (Ns) | 2.69 | 2.75 |
| Ts2 (Ns + L) | 9.03 | 4.32 |
| Ts3 (Ns + Sl) | 6.37 | 4.71 |
| Ts4 (Ns + L + Sl) | 8.69 | 5.83 |
| Ts5 (L) | 27.63 | 13.94 |
| Ts6 (Sl) | 13.67 | 9.92 |
| Ts7 (L + Sl) | 17.97 | 12.02 |
4 Experimental results
The performance of the i-vector-based speaker recognition systems considered is evaluated in terms of equal error rate (EER), where lower the EER value, better is the performance of the system. The EER values (in %) obtained for the two considered systems, namely, System1 (trained on Es1 i.e., Ns) and System2 (trained on Es2 i.e., Ns + L), when tested on all the test datasets (Ts1 through Ts7) are shown in Table 2 (refer to Table 1 for dataset details). As observed from Table 2
-
•
Both System1 and System2 perform equally well when tested on Ts1 with EER of and , respectively. This shows that the inclusion of laughter sounds in enrollment phase have little (no effect) on the performance of the speaker recognition system, when test utterances consist of only neutral speech of the speakers.
-
•
A higher degradation in performance is observed for System1 compared to System2, when laughter (L) is included in the test set (Ts2, Ts5). This shows that the i-vector-based speaker representation obtained from neutral speech (Ns) of speaker is different from that of laughter, signifying the variation in speaker-specific information exhibited by neutral speech and laughter.
-
•
System2 performs better than System1, when speech-laugh (which is not present in either Es1 or Es2) is present in the test set (Ts3, Ts4, Ts6, Ts7). This seems to indicate that the laughter sounds provide complementary speaker-specific information when compared with neutral speech, which results in better speaker recognition in case of speech-laugh. For instance when tested on Ts6 (Sl), System2 (EER=) achieved a relative improvement of (in terms of EER) compared to System1 (EER=).
-
•
The importance of considering laughter in enrollment phase is evident from the performance of System2 on Ts4 (EER=), which gained a relative improvement of around (in EER) compared to System1 (EER=), where Ts4 (Ns + L + Sl) is the most common format in conversational speech.
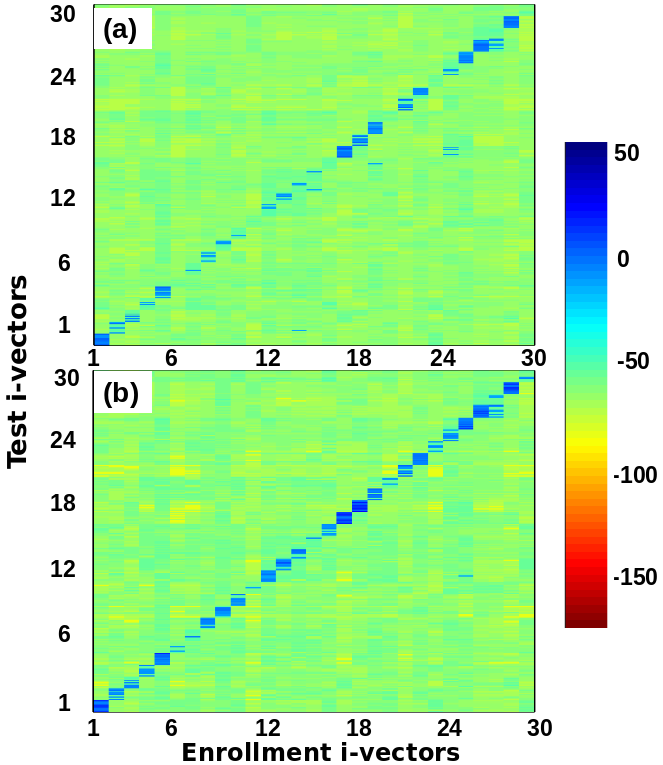
Furthermore, the PLDA scores (log likelihood values) obtained between enrollment i-vectors and test i-vectors are analyzed to justify the EER values shown in Table 2. Figure 4 shows the PLDA scores obtained between enrollment i-vectors (i-vectors obtained from (a) Es1 and (b) Es2) and test i-vectors (i-vectors obtained from Ts6). In this plot, each value represents the PLDA score obtained between an enrollment i-vector (along -axis) and a test i-vector (along -axis). For instance, the value at position refers to the PLDA score obtained between enrollment i-vector (corresponds to enrollment speaker) and test i-vector (corresponds to speaker test utterance). A better performing system (lower EER) will exhibit higher values along the diagonal (namely, ) and lower values at other locations (). It can be observed from Figure 4 that the PLDA scores along the diagonal are higher for System2 (enrollment i-vectors obtained using Es2) compared to the corresponding values obtained for System1 (enrollment i-vectors obtained using Es1), when tested on Ts6 (Sl). Also, the difference between the PLDA scores along the diagonal, and at other locations is higher for System2 compared to that of System1. This explains the lower EER values obtained by System2 for utterances with speech-laugh (Ts3, Ts4, Ts6 and Ts7) compared to the corresponding EER values obtained for System1.

5 Summary and conclusions
Natural conversations between people have significant amount of non-speech events, such as laughter, speech-laugh, interlaced with neural speech. A practical speaker recognition system needs to be able to recognize a speaker in these scenarios. We used the i-vector to represent the speaker characteristic. In this paper, the variation in speaker-specific information captured by different variants of neutral speech and non-speech sounds, produced by the same speaker, was experimentally evaluated by considering neutral speech, speech-laugh and laughter sounds. This analysis is performed on an i-vector-based speaker recognition system. Experimental results show that the i-vector-based speaker representation obtained using neutral speech of a speaker differs from the speaker representation obtained using laughter sounds and speech-laugh segments produced by the same speaker. Further, the complementary speaker-specific information provided by laughter sounds of the speaker will help in improving the performance of i-vector-based speaker recognition systems not only for utterances containing laughter sounds, but also in the case of speech-laugh.
References
- [1] D. A. Reynolds and R. C. Rose, “Robust text-independent speaker identification using gaussian mixture speaker models,” IEEE transactions on speech and audio processing, vol. 3, no. 1, pp. 72–83, 1995.
- [2] N. Dehak, P. J. Kenny, R. Dehak, P. Dumouchel, and P. Ouellet, “Front-end factor analysis for speaker verification,” IEEE Transactions on Audio, Speech, and Language Processing, vol. 19, no. 4, pp. 788–798, 2011.
- [3] G. Saon, H. Soltau, D. Nahamoo, and M. Picheny, “Speaker adaptation of neural network acoustic models using i-vectors.” in ASRU, 2013, pp. 55–59.
- [4] S. J. Prince and J. H. Elder, “Probabilistic linear discriminant analysis for inferences about identity,” in Computer Vision, 2007. ICCV 2007. IEEE 11th International Conference on. IEEE, 2007, pp. 1–8.
- [5] A. K. Sarkar, D. Matrouf, P.-M. Bousquet, and J.-F. Bonastre, “Study of the effect of i-vector modeling on short and mismatch utterance duration for speaker verification.” in Interspeech, 2012, pp. 2662–2665.
- [6] M. K. Nandwana and J. H. Hansen, “Analysis and identification of human scream: implications for speaker recognition.” in INTERSPEECH, 2014, pp. 2253–2257.
- [7] M. K. Nandwana, H. Boril, and J. H. Hansen, “A new front-end for classification of non-speech sounds: a study on human whistle.” in INTERSPEECH, 2015, pp. 1982–1986.
- [8] A. Janicki, “On the impact of non-speech sounds on speaker recognition,” in International Conference on Text, Speech and Dialogue. Springer, 2012, pp. 566–572.
- [9] S. H. Dumpala and S. K. Kopparapu, “Improved speaker recognition system for stressed speech using deep neural networks,” in IEEE International Joint Conference on Neural Networks (IJCNN), 2017, accepted for publication.
- [10] S. H. Dumpala, P. Gangamohan, S. V. Gangashetty, and B. Yegnanarayana, “Use of vowels in discriminating speech-laugh from laughter and neutral speech,” Interspeech 2016, pp. 1437–1441, 2016.
- [11] H. Hirose, “Investigating the physiology of laryngeal structures,” The handbook of phonetic sciences, pp. 130–52, 2010.
- [12] K. P. Truong and D. A. Van Leeuwen, “Automatic detection of laughter.” in INTERSPEECH, 2005, pp. 485–488.
- [13] E. E. Nwokah, H.-C. Hsu, P. Davies, and A. Fogel, “The integration of laughter and speech in vocal communicationa dynamic systems perspective,” Journal of Speech, Language, and Hearing Research, vol. 42, no. 4, pp. 880–894, 1999.
- [14] C. Wallace, “The phonetics of laughter–a linguistic approach,” in Interdisciplinary Workshop on the Phonetics of Laughter, 2007, pp. 4–5.
- [15] A. Batliner, S. Steidl, F. Eyben, and B. Schuller, “On laughter and speech laugh, based on observations of child-robot interaction,” The phonetics of laughing, trends in linguistics. de Gruyter, Berlin, to appear, 2010.
- [16] J.-A. Bachorowski, M. J. Smoski, and M. J. Owren, “The acoustic features of human laughter,” The Journal of the Acoustical Society of America, vol. 110, no. 3, pp. 1581–1597, 2001.
- [17] J. Trouvain, “Phonetic aspects of “speech-laughs”,” in Oralité et Gestualité: Actes du colloque ORAGE, Aix-en-Provence. Paris: L’Harmattan, 2001, pp. 634–639.
- [18] C. Menezes and Y. Igarashi, “The speech laugh spectrum,” Proc. Speech Production, Brazil, pp. 157–164, 2006.
- [19] S. H. Dumpala, K. V. Sridaran, S. V. Gangashetty, and B. Yegnanarayana, “Analysis of laughter and speech-laugh signals using excitation source information,” in Acoustics, Speech and Signal Processing (ICASSP), 2014 IEEE International Conference on. IEEE, 2014, pp. 975–979.
- [20] D. P. Szameitat, C. J. Darwin, A. J. Szameitat, D. Wildgruber, and K. Alter, “Formant characteristics of human laughter,” Journal of voice, vol. 25, no. 1, pp. 32–37, 2011.
- [21] J. Franco-Pedroso and J. Gonzalez-Rodriguez, “Feature-based likelihood ratios for speaker recognition from linguistically-constrained formant-based i-vectors,” Odyssey 2016, pp. 237–244, 2016.
- [22] “Voice biometry standardization (VBS) initiative,” http://voicebiometry.org/, 2015.
- [23] M. A. Pitt, L. Dilley, K. Johnson, S. Kiesling, W. Raymond, E. Hume, and E. Fosler-Lussier, “Buckeye corpus of conversational speech (2nd release),” Columbus, OH: Department of Psychology, Ohio State University, 2007.
- [24] M. Brookes et al., “Voicebox: Speech processing toolbox for matlab,” Software, available [Mar. 2011] from www. ee. ic. ac. uk/hp/staff/dmb/voicebox/voicebox. html, vol. 47, 1997.
- [25] D. Garcia-Romero and C. Y. Espy-Wilson, “Analysis of i-vector length normalization in speaker recognition systems.” in Interspeech, vol. 2011, 2011, pp. 249–252.
- [26] P. Kenny, “Bayesian speaker verification with heavy-tailed priors.” in Odyssey, 2010, p. 14.
- [27] L. Burget, O. Plchot, S. Cumani, O. Glembek, P. Matějka, and N. Brümmer, “Discriminatively trained probabilistic linear discriminant analysis for speaker verification,” in Acoustics, Speech and Signal Processing (ICASSP), 2011 IEEE International Conference on. IEEE, 2011, pp. 4832–4835.