XXXX-XXXX
Measurement of Energy Spectrum of Ultra-High Energy Cosmic Rays
Abstract
Ultra-High Energy Cosmic Rays (UHECRs) are charged particles of energies above eV that originate outside of the Galaxy. Because the flux of the UHECRs at Earth is very small, the only practical way of observing UHECRs is by measuring the extensive air showers (EAS) produced by UHECRs in the atmosphere. This is done by using air fluorescence detectors and giant arrays of particle detectors on the ground. The Pierre Auger Observatory (Auger) and Telescope Array (TA) are two large cosmic ray experiments which use such techniques and cover 3000 km2 and 700 km2 areas on the ground, respectively. In this paper, we present the UHECR spectrum reported by the TA, using an exposure of 6300 km2 sr yr accumulated over 7 years of data taking, and the corresponding result of Auger, using 10 years of data with a total exposure exceeding 50000 km2 sr yr. We review the astrophysical interpretation of the two measurements, and discuss their systematic uncertainties.
1 Introduction
The origin of cosmic rays (CRs) is an important problem in modern astrophysics. Extraterrestrial particles of energies greater than and even exceeding eV are measured at Earth, while their arrival directions seem to be distributed almost randomly. Since the energies of these CRs extend well beyond the energy range of the solar particles and energies attainable by the artificial accelerators, the mechanisms of the CR production and acceleration must be related to unknown, very energetic phenomena in the universe.
The energy spectrum plays a key role in understanding the CRs RNC . The spectrum falls off with energy approximately as a power-law function, with an average power index of , and the CR flux becomes very small above eV. Above this energy, it is only practical to detect the CRs indirectly, by measuring secondary particles, or the extensive air showers (EAS), which are produced by the primary CR particles in the atmosphere.
The ultra-high energy CR spectrum has been measured by a number of cosmic ray experiments Verzi-icrc15 , and is known to have 5 features over 10 orders of magnitude in energy. There is a steepening at eV, known as the knee in the spectrum, a flattening at eV, and a steepening at eV, the so-called the second knee. The flattening at eV is called the low-energy ankle, a feature analogous to the widely recognized ankle at eV. At the highest energies, eV, there is an abrupt suppression of the cosmic ray flux to the level of particle/km2/century. For a historical overview of observational studies of CRs and air showers, see e.g. ReviewKH-Watson .
Although there are indirect evidences from the detection of very high energy gamma-rays from the supernova remnants that suggest the CRs of energies below the knee originate within the Galaxy, the interpretation of CR energy spectrum features remains uncertain. The knee and the second knee are believed to be caused by the maximum acceleration energy available at the Galactic sources, and by the maximum energies of the magnetic confinement of protons and high-Z nuclei in the Galaxy. The gyro-radii of CRs with energies beyond the second knee in the galactic magnetic field become larger than the size of the Galaxy, and therefore the magnetic confinement of CRs in the Galaxy is no longer effective. Consequently, the CRs of energies above eV, the so-called Ultra-High Energy Cosmic Rays (UHECRs), must be of extra-galactic origin.
The UHECRs from distant sources travel tens or hundreds of Mpc before reaching the Earth, and therefore, interactions and propagation effects, and the chemical composition must be taken into account in the interpretation of the CR energy spectrum. Shortly after the discovery of the cosmic microwave background (CMB) radiation, Greisen Greisen , Zatsepin, and Kuz’min ZK in 1966 independently predicted a suppression of cosmic ray flux at the highest energies, as a consequence of photo-pion production from the interaction of the CRs with the low energy CMB photons. This feature is now called the GZK cutoff. In the case of a pure proton composition, the ankle can be explained by the electron-positron pair-production from interactions of the CR protons with the CMB photons Berezinsky1 . In the case of a mixed composition, on the other hand, propagation effects are complicated by the fact that the primary nuclei also suffer interactions that cause a progressive reduction of their mass numbers. Other alternative models assert that a cut-off on the acceleration mechanism at the sources may play some role in the explanation of the observed suppression of the cosmic ray flux Disappointing .
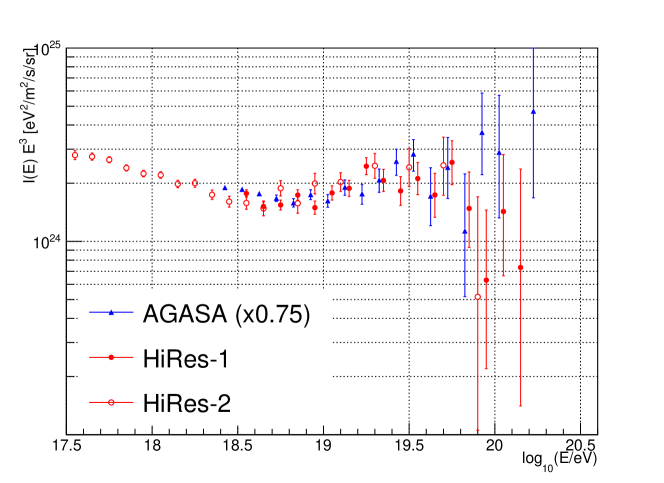
Historically, observation of the cut-off in the energy spectrum was a technically challenging task. Because the rate of CRs of energies greater than eV is as low as event per square kilometer per century, experiments with very large effective areas, long observation periods, and good energy resolution were required to see the effect. AGASA (Akeno Giant Air Shower Array) AGASA and Hi-Resolution Fly’s Eye (HiRes) HiRes were the first cosmic ray detectors large enough to measure the energy spectrum of UHECRs above 1019.0 eV, as shown in Fig. 1. There were two major differences in their results. First, there was a difference in the overall energy scale, which came from the difference in the techniques employed by the two experiments. AGASA used an array of scintillation counters that were detecting EAS particles at the ground level, while HiRes employed fluorescence detectors that were sensitive to fluorescence light emitted due to the energy deposition of the EAS particles in the atmosphere. The systematic uncertainties in determining the CR primary energy were in both experiments. The second important difference was in the shape of the spectrum above the ankle. The HiRes spectrum showed a steepening in the spectrum at eV HiRes as predicted by the GZK theory Greisen ; ZK , whereas the AGASA spectrum extended well beyond the cut-off energy AGASA . The tension between the two major experiments in the 1990’s led to an idea of the hybrid detection of UHECRs, where both surface detectors and fluorescence detectors can be used within a single experiment. The Telescope Array (TA) TA-icrc15-HL and Pierre Auger Observatory (Auger) Auger-icrc15-HL are modern hybrid cosmic ray experiments.
This paper describes recent measurements of the UHECR spectrum by the Telescope Array (TA) experiment TA-icrc15-HL and the Pierre Auger Observatory (Auger) Auger-icrc15-HL . The TA is a cosmic ray observatory that covers an area of about 700 km2 in the northern hemisphere, and Auger has an effective area of 3000 km2 in the southern hemisphere. Both experiments use two types of instruments, surface detectors (SDs) and fluorescence detectors (FDs). The hybrid detection technique, where the CR showers are simultaneously observed with the FDs and SDs at the same site, allows a very precise determination of the CR energies and arrival directions. The FDs measure fluorescence light emitted by the atmospheric molecules excited by the charged particles in the EAS, and observe the longitudinal development of the EAS using mirror telescopes coupled with clusters of photo-multiplier tubes. Because the FDs are mostly sensitive to the calorimetric energy deposition in the atmosphere, the energy determination of the primary CRs is nearly independent of the details of the hadronic interactions within the EAS, where there are considerable uncertainties in different models. The FDs operate at a duty cycle because the FD data can be collected only during nights with low moonlight background and with dry air and clear skies. The SDs, on the other hand, directly measure EAS particles at the ground level at a nearly duty cycle, regardless of the weather conditions.
This paper is organized as follows. The TA and Auger detectors are described in Sec. 2. The details of the energy scale in the two experiments are summarized and discussed in Sec. 3. The latest results of the energy spectrum measurements and their astrophysical interpretations are given in Sec. 4 and 5. Sec. 6 is devoted to the discussion on the current status and future prospects of the UHECR field, as well as the existing plans of extension and upgrade of the detectors foreseen by the TA and Auger collaborations.
2 Telescope Array and Auger Instruments
2.1 TA Detectors
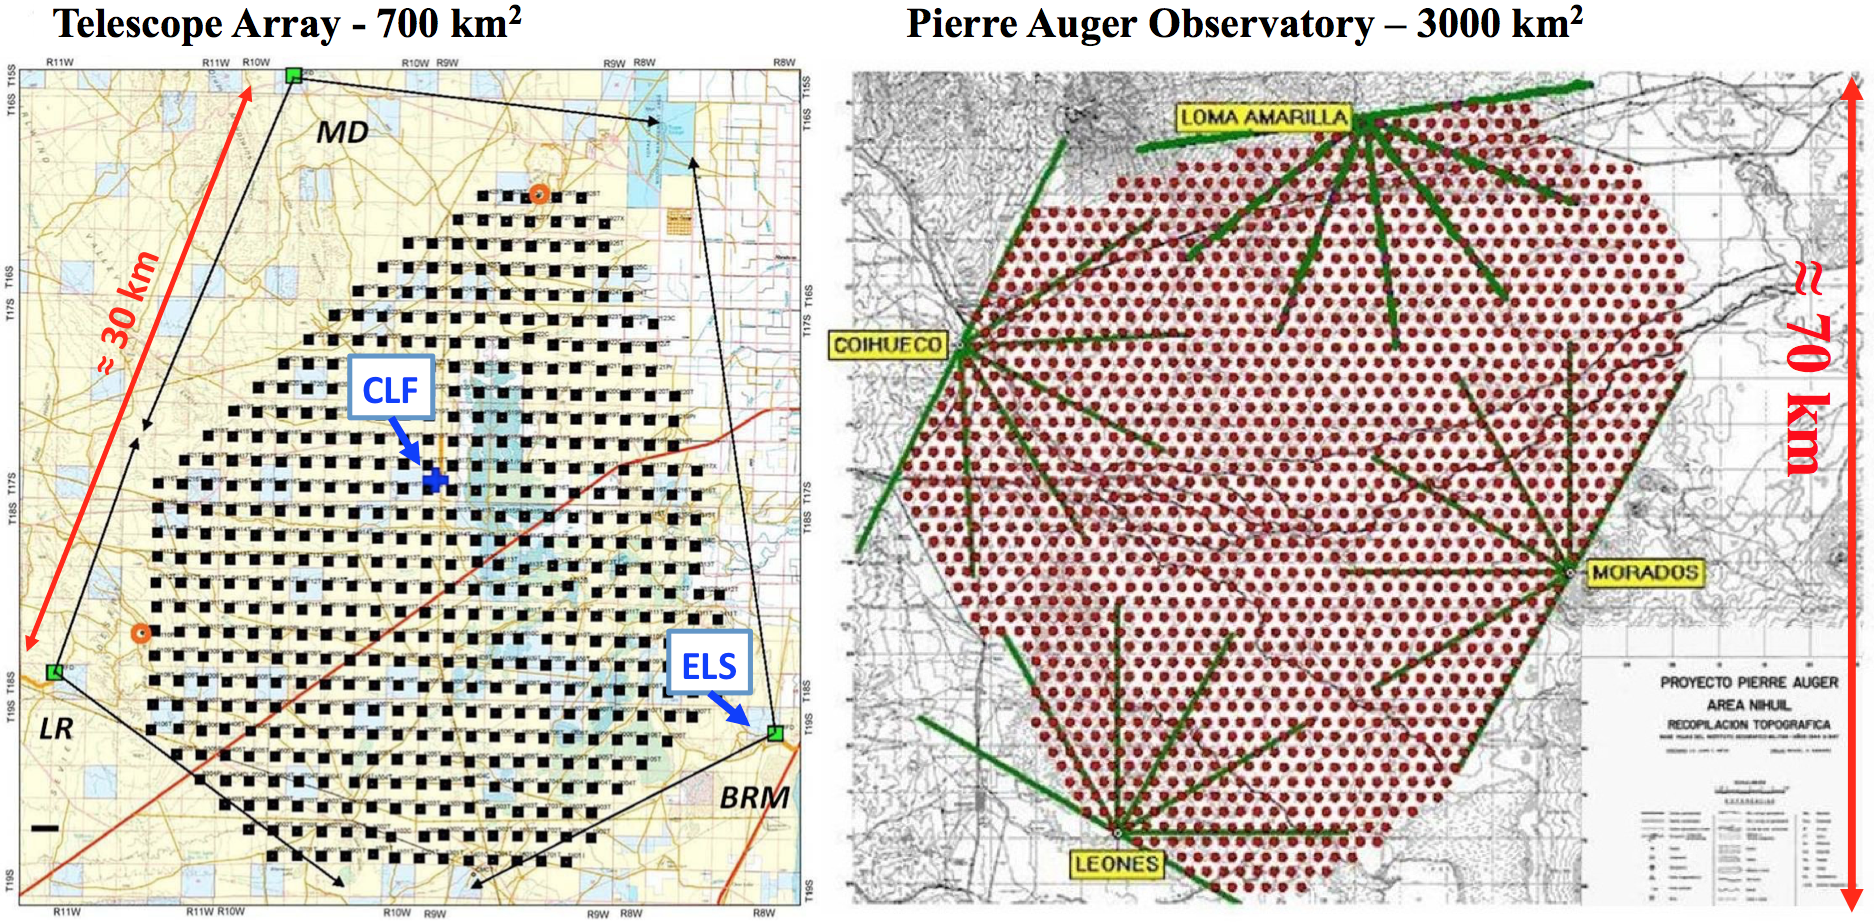
The Telescope Array experiment TA is located in Millard County, Utah (USA) at a 39.3∘ N latitude and 1400 m altitude above sea level. The TA detectors have been in full operation since May 2008. A sketch of the TA site is shown in the left panel of Fig. 2.
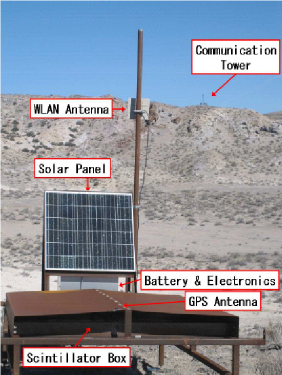
The TA SD consists of 507 particle counters arranged on a 1.2 km spaced square grid and covers an area of 700 km2 on the ground. Each surface detector unit, shown on the left panel of Fig. 3, consists of two layers of 3 , 1.2 cm thick plastic scintillators SD-TA . Scintillation light in each layer is collected and directed to the photo-multiplier tube (PMT) by the wavelength-shifting fibers. There is one PMT for each layer. Outputs of the PMTs of the upper and the lower layers are individually digitized by 12 bit flash analog-to-digital converters (FADCs) at a 50 MHz sampling rate.

The TA includes three fluorescence detector stations that overlook the surface array. Middle Drum (MD) FD is located in the northern part of the TA, and Black Rock Mesa (BR) and Long Ridge (LR) FDs are in the southern part.
The MD station utilizes 14 refurbished telescopes previously used in the High-Resolution Fly’s Eye (HiRes) experiment FD-TA-MD . Each telescope consists of a spherical mirror and an imaging camera of 256 PMTs that uses a sample-and-hold readout system. The telescopes are logically arranged in two layers, called rings, that observe two different elevations. Physically, the MD telescopes are arranged in pairs: ring 2 telescopes that observe higher elevations are placed next to the ring 1 telescopes. The station covers 110∘ in azimuth and 3∘ to 31∘ in elevation.
Black Rock Mesa and Long Ridge stations have each 12 fluorescence telescopes that are also arranged in two rings. The telescopes use a new design shown in the right panel of Fig. 3. Each mirror of the BR and LR telescopes is composed of 18 hexagonal segments. The radius of curvature of each segment is mm, and the total effective area of the mirror is . The imaging camera of a BR-LR telescope consists of 256 PMTs that are read out by a 40 MHz FADC system. Each station covers 108∘ in azimuth and 3∘ to 33∘ in elevation FD-TA-BRM-LR .
The calibration of the TA FDs was carried out by measuring the absolute gains of dozens of “standard” PMTs that are installed in each camera using the CRAYS (Calibration using Rayleigh Scattering) system in the laboratory FD-TA-AbsCal . The rest of the PMTs in the cameras are relatively calibrated to the standard PMTs by using Xe lamps installed at the center of each mirror FD-TA-RelCal1 ; FD-TA-RelCal2 .
2.2 Auger Detectors
The Pierre Auger Observatory Auger is located in a region called Pampa Amarilla, near the small town of Malargüe in the province of Mendoza (Argentina), at 35∘ S latitude and an at altitude of 1400 m above sea level. The observatory is in operation since 2004 and its construction was completed in 2008. A sketch of the site is shown in the right panel of Fig. 2.
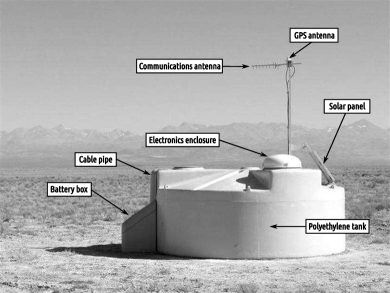
The Auger SD consists of 1660 water-Cherenkov detectors (WCDs) arranged on a hexagonal grid of 1.5 km spacing. The effective area of the array is 3000 . Each WCD unit, shown in the left panel of Fig. 4, is a plastic tank of a cylindrical shape, 10 m2 1.2 m, filled with purified water. Cherenkov radiation, produced by the passage of charged particles through the water, is detected by the three PMTs, 9” in diameter each. The signal of the PMTs is digitized by an FADCs at a 40 MHz sampling rate. Because WCDs extend m in the vertical direction, the Auger SD is sensitive to the cosmic ray showers that are developing at large zenith angles.

The Auger FD consists of 24 telescopes placed in four buildings located along the perimeter of the site. A sketch of a telescope is shown in the right panel of Fig.4. Each telescope has a 3.5 m 3.5 m spherical mirror with a curvature radius of 3.4 m. The coma aberration is eliminated using a Schmidt optics device, which consists of a circular diaphragm of radius 1.10 m and a series of corrector elements mounted in the outer part of the aperture. An ultraviolet transmitting filter is placed at the telescope entrance in order to reduce the background light and to provide the protection from the outside dust. The focal surface is covered by 440 PMTs, 22 rows x 20 columns, and the overall field of view of the telescope is in elevation and in azimuth. The PMTs use photocathodes of an hexagonal shape and are surrounded by light concentrators in order to maximize the light collection and to guarantee a smooth transition between the adjacent pixels. The signal from each PMT is digitized by a 10 MHz FADC with a 12 bit resolution.
The Auger FDs are calibrated using a portable cylindrical diffuser, called the drum Auger-Drum .
During the calibration process, the drum is mounted to the aperture of each telescope, and provides a uniform illumination of the entire surface area that is covered by the PMTs of the telescope. The drum is absolutely calibrated using a NIST-calibrated photodiode, and provides an absolute end-to-end calibration of all pixels and optical elements of every Auger FD telescope. The long-term time variations in the calibration of the telescopes are monitored using LED light sources that are installed in each building.
2.3 Auxiliary Facilities at the TA and Auger
In order to reconstruct the shower energy from the FD information accurately, it is necessary to know the attenuation of the light due to the molecular and aerosol scattering as the light propagates from the shower to the detector. The molecular scattering can be calculated from the knowledge of the air density as a function of height, and the aerosol content of the atmosphere is monitored each night during the FD data collection. The aerosols are measured in the TA and Auger using similar instruments. These include central laser facilities (CLFs) placed in the middle of the arrays, and standard LIDAR (LIght Detection and Ranging) stations TALIDAR ; Auger . Auger CLF has recently been upgraded to include a backscatter Raman LIDAR receiver. Other instruments like infra-red cameras are also employed in both experiments to continuously monitor the cloud coverage.
Both the TA and Auger collaborations have enhanced the baseline configurations of their detectors to lower the minimum detectable shower energies. The TA low energy extension (TALE) consists of 10 additional fluorescence telescopes viewing higher elevation angles TA-icrc15-TALE1 ; TA-icrc15-TALE2 , from to , installed at the MD site, and an infill array of the same scintillation detectors as those used by the main TA SD array. In a similar way, Auger has installed three additional High Elevation Auger Telescopes (HEAT), viewing from 30∘ to 60∘ in elevation, at the Coihueco site (see Fig. 2). HEAT overlooks a 27 km2 region on the ground that is filled with additional WCDs using 750 m spacing Auger .
An important calibration facility, called the Electron Light Source (ELS) TA-ELS , has been implemented by the TA collaboration. The ELS is a linear accelerator installed in front of the TA Black Rock Mesa FD station at a distance of 100 m from the detector. The ELS provides a pulsed beam of 40 MeV electrons that are injected into the FD field of view. The pulse frequency is 1 Hz and each pulse has a duration of 1 and an intensity of about electrons. The ELS beam mimics the cosmic ray air showers and provides an effective test not only for the FD calibration but also for the other kinds of detectors, such as radio antennas.
3 TA and Auger Energy Scale
Both TA and Auger experiments use FD measurements to set their energy scale. The FD measures fluorescence photons produced by de-excitation of the atmospheric molecules (nitrogen and oxygen) that have been excited by the charged particles in the EAS, and provides a nearly calorimetric estimate of the total EAS energy. The fluorescence photons are emitted isotropically in the wavelength range between 290 and 430 nm. The most significant line emission at 337 nm contributes of the total emission intensity. The number of emitted photons is proportional to the energy deposited by the charged particles in the EAS. The proportionality factor, called the fluorescence yield (FY), is measured by several experiments using accelerator beam and radioactive sources (see ArquerosLast for a review on this topic).
As the EAS develops in the atmosphere, fluorescence light emitted at different altitudes triggers the FD pixels (PMTs) at different times. Pointing directions of the triggered pixels and the pixel time information are used to reconstruct the full geometry of the cosmic ray shower event, which includes the event arrival direction and the impact parameter (distance between the FD station and the EAS axis). Additionally, information from the triggered surface detector stations on the ground can be added to constrain the FD timing fit and improve the resolution of the EAS geometry. Events that are reconstructed using FD and SD information simultaneously are called the hybrid events.
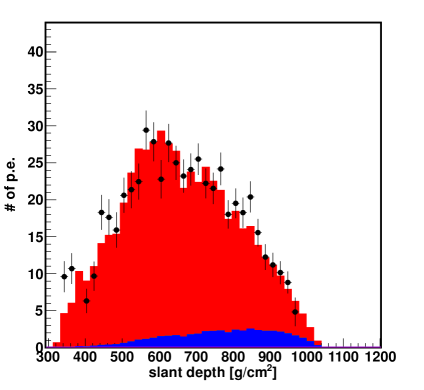
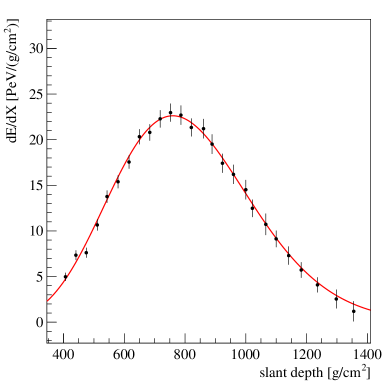
Examples of reconstructed FD longitudinal profiles are shown in Fig. 5. The energy deposition is determined as a function of the slant depth along the shower axis using the intensity of the signal of the triggered pixels. The reconstruction procedure requires the absolute calibration of the FD telescopes, knowledge of the attenuation of the light due to the scattering by the air molecules and the aerosols, and the absolute fluorescence yield. The integral of the profile gives the calorimetric energy of the shower: . The total (and final) energy of the primary cosmic ray is obtained from after the addition of the so called invisible (or equivalently missing) energy , which is the energy that is carried away by the high-energy muons and neutrinos that do not deposit their energies in the atmosphere and thus cannot be seen by the FD. For a typical EAS, is of the order of 10 to 15% of the total primary energy. Further details on the energy scale and invisible energy corrections in TA and Auger will be discussed in Sec. 3.2 and 3.3.
3.1 Surface Detector Energy Reconstruction
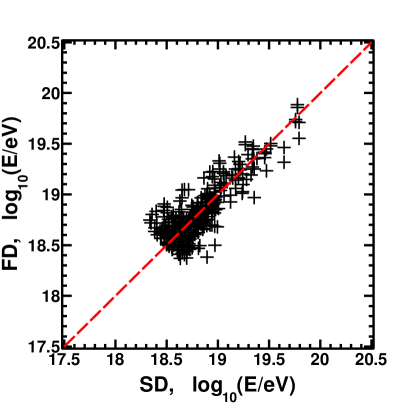
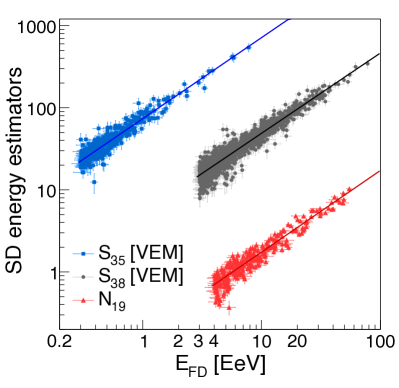
The SD energy scale in both TA and Auger is calibrated by the FDs using well reconstructed hybrid events. This is done by comparing the SD energy estimators with the energies obtained from the corresponding FD longitudinal profiles on an event by event basis.
The SD energy estimators in TA and Auger are obtained using conceptually similar analyses TA-EnSp-Comb ; Auger-EnSp . The energy of the primary CR particle, arriving at a given fixed zenith angle , is assumed to be directly related to the intensity of the shower front at a certain distance from the shower core. This relation depends on because the effective amount of the air material that the EAS propagates through, before reaching the ground level, increases as .
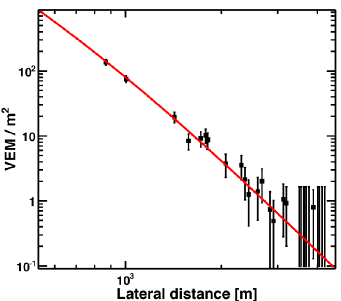
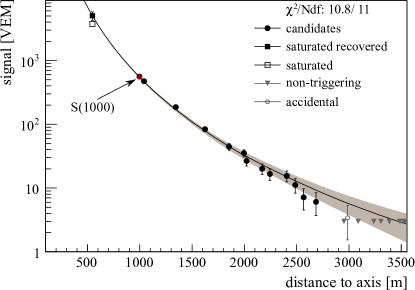
The shower axis and the point of impact on the ground are determined from the timing and the intensity of the signal in the triggered SD stations. The best energy estimator is obtained by evaluating the intensity of the shower front at an optimum distance from the shower core. This is done using analytic functions with parameters determined from the fit to the intensity of the signal as a function of the distance from the shower core (see Fig. 6). The optimal energy determination distance for the TA SD with 1200 m spacing is m. For Auger, whose spacing is 1500 m, is 1000 m. A similar reconstruction technique is used for the Auger events detected by the 750 m array placed in front of the HEAT telescopes (see Sec. 2.3). In this case is 450 m.
Next, the intensity of the signal at the optimal distance is corrected for the zenith angle attenuation. In TA, this correction is made using a detailed Monte Carlo simulation TA-SDsp2013 ; DmitriThesis , and an energy estimator is obtained. represents the reconstructed TA SD energy prior to the calibration of the energy scale by the FD. Standard TA SD reconstruction uses events with .
In the case of Auger, the zenith angle attenuation is derived from the data using the “Constant Integral Intensity Cut” method CIC . The resulting Auger energy estimators are called for the 1500 m array and for the 750 m and array, and represent the signal values the EAS would have produced if it arrived at the zenith angles of and , respectively. These numbers correspond to the median values of the event zenith angle distributions of the Auger 1500 m and 750 m arrays.
In Auger, the reconstruction technique described above is applied to the showers of for the 1500 m array and for the 750 m array. A different reconstruction technique is used for the Auger 1500 m array in the case of inclined showers () Auger-HASrec . In these showers, the electromagnetic component is largely absorbed by the atmosphere and the signal in the WCDs is dominated by muons. The muon patterns (maps) are asymmetric because of the deflections of the muons in the magnetic field of the Earth. These maps are calculated for different zenith and azimuth angles using Monte Carlo simulations. The normalization of the maps, called , is fitted to the data and provides an energy estimator for the inclined showers.
| Auger SD Analysis Type | |||
| 1500 m Vertical | 1500 m Inclined | 750 m | |
| Number of Hybrid Events | 1731 | 255 | 469 |
| [EeV] | |||
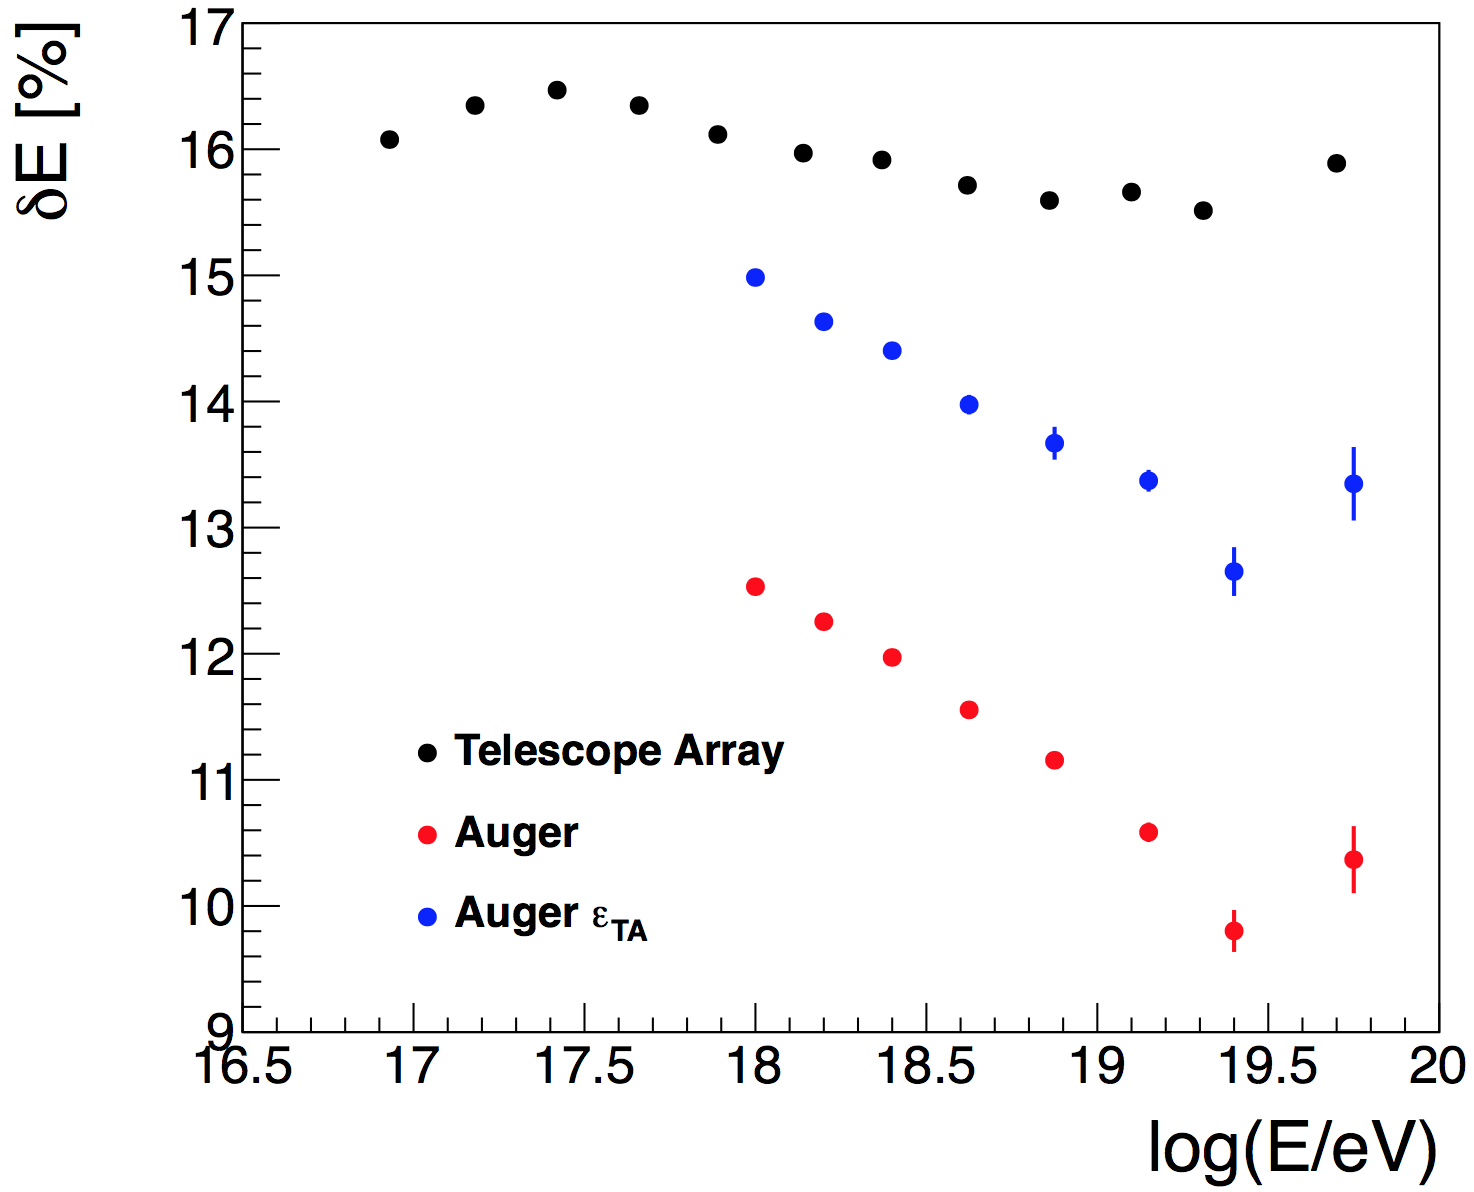
| Energy Resolution | 15.3%, E 3 EeV | 19%, E 4 EeV | 13%, E 0.3 EeV |
| Number of Hybrid Events | 551 |
|---|---|
| 1/1.27 | |
| 19%, | |
| Energy Resolution | 29%, |
| 36%, |
Correlations between the SD energy estimators and the FD energies are shown in Fig. 7. In TA, the final event energy is determined by scaling the result from the Monte Carlo simulations by a factor , to match the FD energy scale TA-EnSp-Comb . The same factor is used for all energies in TA. In Auger, the correlations between the SD energy estimators and the FD energies are well described by a power law function , where is , depending on the type of the Auger SD analysis. The parameters and are obtained from the fits to the data Auger-EnSp . Quantities relevant for the TA and Auger SD energy calibration are summarized in Tables 1 and 2. The TA and Auger SD energy resolution is summarized in the last rows of the tables.
3.2 Systematic Uncertainties of the Energy Scale
Since both experiments calibrate their surface detectors to the FDs, the systematic uncertainties of their energy scales reduce to those of the FDs. Therefore, an effort has been made in both TA and Auger collaborations to understand the uncertainties that affect the reconstruction of fluorescence detector events TA-EnergyScale2011 ; TA-SDsp2013 ; Auger-EnSc . Table 3 shows a summary of the TA and Auger FD systematic uncertainties in terms of five major contributions: fluorescence yield, atmospheric modeling, FD calibration, determination of the longitudinal profile of the shower, and the invisible energy correction.
| Systematic Uncertainties on the Energy Scale | ||
| TA | Auger | |
| Fluorescence Yield | 11% | 3.6% |
| Atmosphere | 11% | 3.4%6.2% |
| FD Calibration | 10% | 9.9% |
| FD Reconstruction | 9% | 6.5% 5.6% |
| Invisible Energy | 5% | 3%1.5% |
| Other Contributions | 5% | |
| Total | 21% | 14% |
The fluorescence yield model used by the TA collaboration is based on a combination of the measurements of the absolute yield by Kakimoto et al. FY-Kakimoto , in the 300 to 400 nm range, and the fluorescence spectrum measured by FLASH FY-FLASH . Temperature and pressure dependencies of the absolute FY in TA are taken into account by the Kakimoto et al. FY-Kakimoto model also. Auger uses all FY measurements performed by the Airfly experiment. Airfly results include a precise measurement of the absolute intensity at the 337 nm emission band FY-Airfly_AbsYield , with an uncertainty of , the wavelength spectrum FY-Airfly_spectrum , and the dependence on pressure FY-Airfly_spectrum , temperature, and humidity FY-Airfly_T_h ; FY-Airfly_Th_Martina of the emission bands at different wavelengths. Contributions of the FY models to the systematic uncertainty on the energy scale are 11% for TA and 3.6% for Auger. In both cases, the FY model contributions are dominated by the systematic uncertainties on the absolute FY.
In TA, the aerosol transmission is estimated using a median value of the aerosol optical depth profiles measured by the LIDAR TALIDAR . The uncertainty on the shower energy determination, obtained by propagating the standard deviation of the LIDAR measurements, is under 10%. The Auger collaboration uses hourly estimates of the aerosol profile provided by the laser facilities placed in the middle of the SD array Auger-CLF1 ; Auger-CLF2 . Uncertainties of these measurements contribute less than 6% to the reconstructed shower energy. A minor contribution to the systematic uncertainty arises from an imprecise knowledge of the atmospheric density profiles. Both TA and Auger use the Global Data Assimilation System (GDAS) that provides atmospheric data in grid points in longitude and latitude () all over the world, with a time resolution of 3 h GDAS . A detailed discussion on the implementation of the GDAS atmospheric profiles in the Auger FD event reconstruction can be found in Auger-GDAS .
The uncertainties due to the calibration of the FD telescopes contribute 10% for both TA and Auger. They are dominated by the uncertainties on the absolute calibration described in Sec. 2. The uncertainties from the relative calibration systems, which allow one to track the short and long term changes of the detector response, are taken into account in both experiments, and are small in comparison to those due to the absolute calibration.
The uncertainties arising from the reconstruction of the longitudinal shower profiles are obtained by comparing different reconstruction techniques, as well as from studying the energy reconstruction biases with Monte Carlo simulations. Contributions due to the shower profile reconstruction are 9% for TA and 6% for Auger.
The last important contribution is the uncertainty due to the determination of the invisible energy . The TA collaboration mainly estimates from Monte Carlo simulations of the proton air showers, using the QGSJetII-03 hadronic interaction model. For TA, the contribution to the systematic uncertainty on due to the missing energy correction is estimated to be 5%. The Auger collaboration derives the invisible energy correction using data Auger-Einv . This is done by exploiting the WCDs sensitivity to the muons of the showers. The muons are mostly originating from the pion decays, with an associated muon neutrino (or muon antineutrino), and therefore, the signal in the WCDs is sensitive to the muon size of the shower, and it is well correlated with the . This analysis allows to keep the uncertainty from the invisible energy estimate on the Auger energy scale well under 3%. Recently, the TA collaboration has also performed a check of the missing energy calculation by using inclined showers of the data, following this method Auger-Einv .
The total uncertainty on the energy scale is obtained by adding in quadrature all individual contributions. It is found to be 21% for TA, and 14% for Auger. In addition, for Auger, the total uncertainty includes a further contribution of 5%, which has been evaluated by studying the stability of the energy scale in different time periods and/or under different conditions.
3.3 Energy Scale Comparison between the TA and Auger
Understanding all contributions to the difference in the energy scale between the two experiments is a difficult task, since many factors are related to the performance of the detectors and to the differences of the analyses techniques used by the two collaborations. On the other hand, two important contributions, the fluorescence yield and the invisible energy, can be considered as external parameters of the experiments, in the sense that they are related to the general properties of the atmospheric showers and thus they can be easily implemented in the CR event reconstruction chains in both collaborations. Therefore, the difference in the energy assignment can be addressed by studying the differences in the fluorescence yield (FY) model and in the invisible energy corrections.
The impact of the FY on the reconstruction of the fluorescence events has been studied in detail since many years WG1 ; JoseRamon-icrc13 ; JoseRamonThesis . In the left panel of Figure 8, we report the results of the studies performed in JoseRamonThesis . Red points describe the effect (on Auger shower energies) of changing the fluorescence yield model from the FY model used by Auger to the FY model used by TA. The energy shift is at 1 EeV and is slightly smaller at the highest energies.
This energy shift is the result of the combined effect to change the absolute intensity of the fluorescence yield and all parameters describing the relative intensities of the spectral lines and their dependence on the atmospheric conditions. The effects of the single components can be disentangled by the following argument. The absolute FY from Kakimoto et al. FY-Kakimoto , when normalized to the intensity of the 337 nm line, where the Airfly experiment made a precise measurement of the absolute FY, differs from that of the Airfly measurement FY-Airfly_AbsYield by (Airfly FY is higher) ArquerosLast . If the absolute FY from Kakimoto et al. FY-Kakimoto was used in the reconstruction of the Auger events, while retaining all other parameters of the Airfly model, one would expect the Auger energies to increase by . From this, we conclude that the effects of the FY parameters, other than the absolute FY, are of the order of . About half of this effect is due to the removal of the temperature and humidity dependence of the quenching cross sections (see also Auger-atm-showers ), effects that are properly accounted for in Auger experiment. We note that the difference between the Kakimoto et al. and Airfly absolute FYs is outside of the range defined by the uncertainties stated by the two measurements, FY-Kakimoto and FY-Airfly_AbsYield , respectively.

The right panel of the Figure 8 describes the effect of changing the fluorescence yield model in the reconstruction of the fluorescence detector events seen by TA WG2 . If TA were to use the FY model of Auger, the TA energy scale would be reduced by . The inverse of this energy shift is directly comparable with the energy shift that is expected in the case of Auger using the TA FY, as shown in the left panel of the Figure 8 using black points.
It is not surprising that the results of the TA and Auger (black and red points in figure 8 on the left) are different. For each experiment, the spectrum of the fluorescence photons detected by the FD is necessarily different from the one emitted at the axis of the cosmic ray shower: the fluorescence photon spectrum is folded with the FD spectral response, and the atmospheric transmission also dependents on the wavelength. Since the Auger and TA FD spectral responses and atmospheric transmission conditions are generally different, we expect larger differences for the higher energy showers that are occurring farther away from the telescopes. A better agreement between the energy shifts can be obtained by correcting the Auger energy shift for the effects due to the different spectral response. The results of this analysis are shown in the left panel of Figure 8 JoseRamonThesis with blue dots, which are now in a better agreement with the TA energy shift (black points).
Following the above studies we conclude that, despite the above mentioned inconsistency between the Airfly FY-Airfly_AbsYield and Kakimoto et al. FY-Kakimoto absolute FYs, the difference in the energy scales of TA and Auger due to the use of a different FY model are at the level of and are roughly consistent with the estimated uncertainties presented in Sec. 3.2.
The validity of the estimations of the uncertainties on the FY has been also addressed by the ELS facility at the TA experiment. Preliminary results of several ELS runs, under different atmospheric conditions, have been presented in ELS-ICRC15 . The ELS results are in a better agreement with the Airfly FY model.
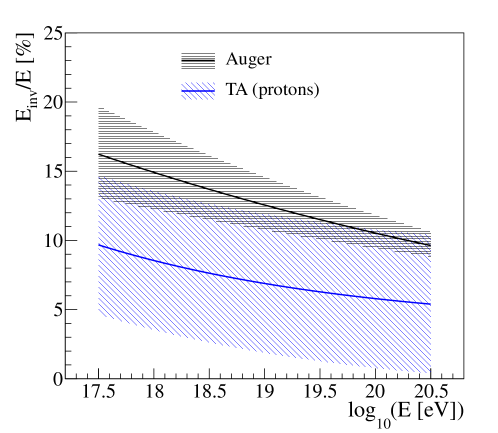
The invisible energy (Einv) corrections implemented by the TA and Auger are shown in Figure 9 TA-EnergyScale2011 ; TA-SDsp2013 ; Auger-EnSc . They are presented in terms of the percent contribution to the total shower energy . At eV, the TA invisible energy correction is 7%, while that of the Auger is 13%. The difference between the two corrections is about 6% (slightly smaller at higher energies). The two corrections agree within the systematic uncertainties quoted by the two collaborations that are shown using dashed bands in Fig. 9.
As already addressed in Sec. 3.2 the invisible energy of TA has been estimated using Monte Carlo simulations of proton primaries with the QGSJetII-03 hadronic interaction model. For a heavier composition, the invisible energy correction would be larger. The assumption of the proton primaries is consistent with the light composition observed by TA through the measurement of the mean value of the maximum of the shower development () TA-mass . It is worthwhile noting that the inference on mass composition strongly depends on the hadronic interaction models used to interpret Unger-rev . The Auger measurements of Auger-mass are consistent with those of the TA TA-Auger-mass , but they generally support a heavier mass composition.
The Auger invisible energy correction has the advantage to be essentially insensitive to the hadronic interaction models since it is derived from the data. It has rather high values, even higher than the one predicted by the simulations for iron primaries. These higher values are due to the excess of muons measured by Auger in highly inclined events Auger-muons .
We can conclude this section by estimating the energy shifts of the Auger and TA energy scales by changing both the FY and the invisible energy. As a first approximation they can be obtained by combining the two energy shifts previously presented. The energies of the TA events would be decreased by about 9% () while the energies of Auger would be increased by about +5% ().
4 TA and Auger Energy Spectrum
Energy spectrum is obtained by dividing the energy distribution of cosmic rays by the accumulated exposure of the detector. The calculation of the exposure for the surface detector is generally robust, especially above the energy threshold where the array is fully efficient regardless of the event arrival direction. For the fluorescence detector, on the other hand, the calculation of the exposure should take into account the detector response as a function of energy and distance between the shower and the telescope, conditions of the data collection, and the state of the atmosphere. Large exposures accumulated by the surface detectors of Auger and TA experiments make it possible to study the UHECR flux at very high energies in different declination bands, and the measurements can be used to constrain the astrophysical models.
4.1 Energy Spectrum Measurement
4.1.1 TA Data
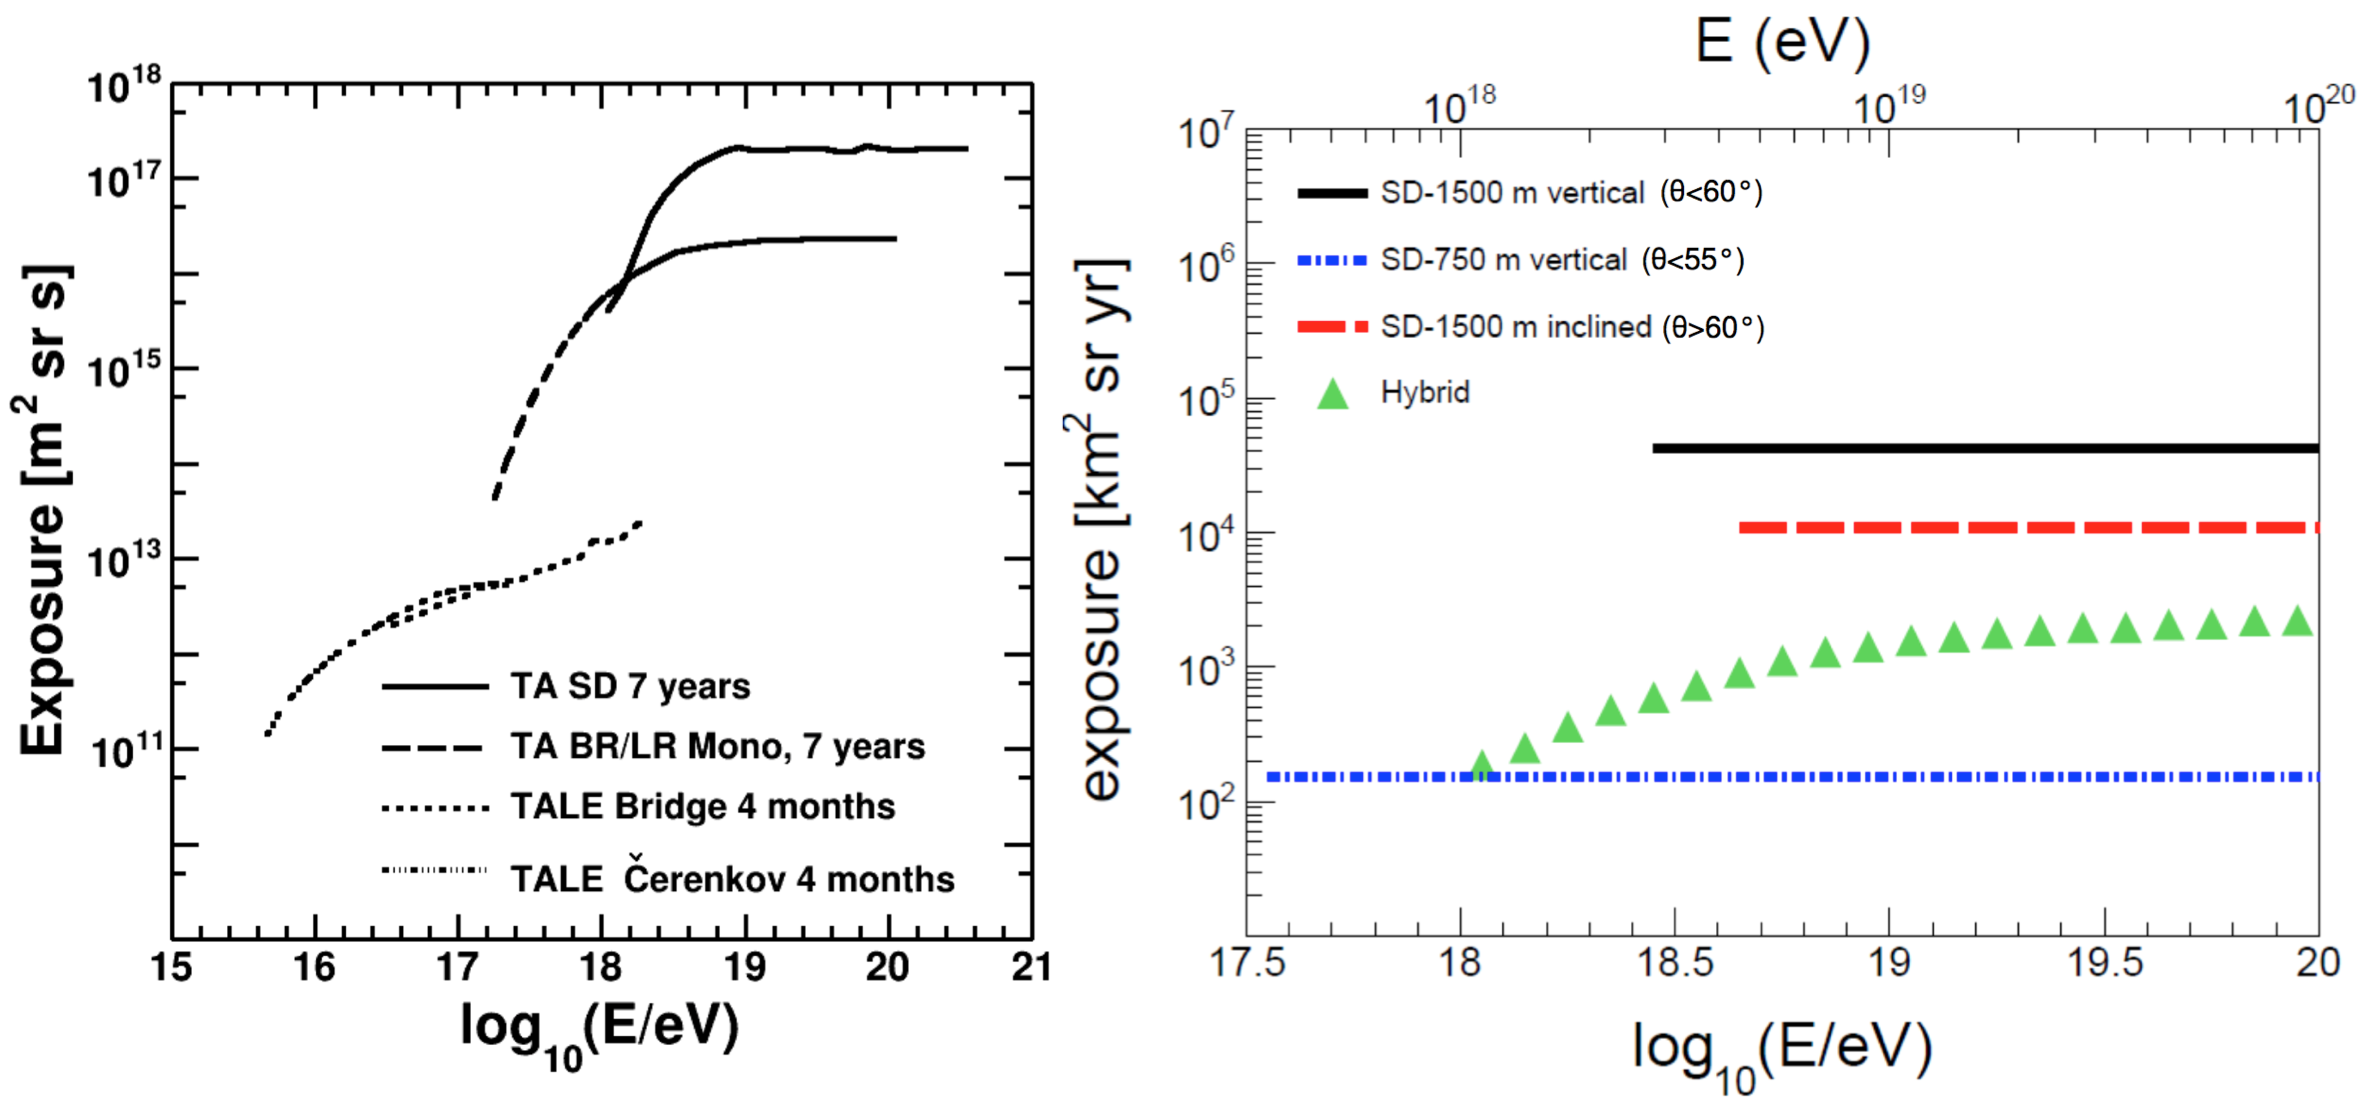
The TA collaboration has measured four independent energy spectra TA-EnSp-Comb . The highest energies are covered by the SD, the intermediate energies are covered by the BR and LR telescopes TA-EnSp-Mono ; TA-EnSp-Mono-paper , and the lowest energies are measured by the TALE telescopes using Cherenkov light. The TALE events have been divided into two categories, one in which the fluorescence light is dominating the flux of photons detected by the telescopes (TALE Bridge) TA-icrc15-TALE2 , and another one where the Cherenkov light is the dominant component (TALE Cherenkov) TA-icrc15-TALE1 . The exposures for the four different reconstruction methods are shown in the left panel of Fig. 10 and the energy spectra are shown in the left panel of Fig. 11. The spectrum obtained by combining the four measurements is presented in the right panel of Fig. 11.
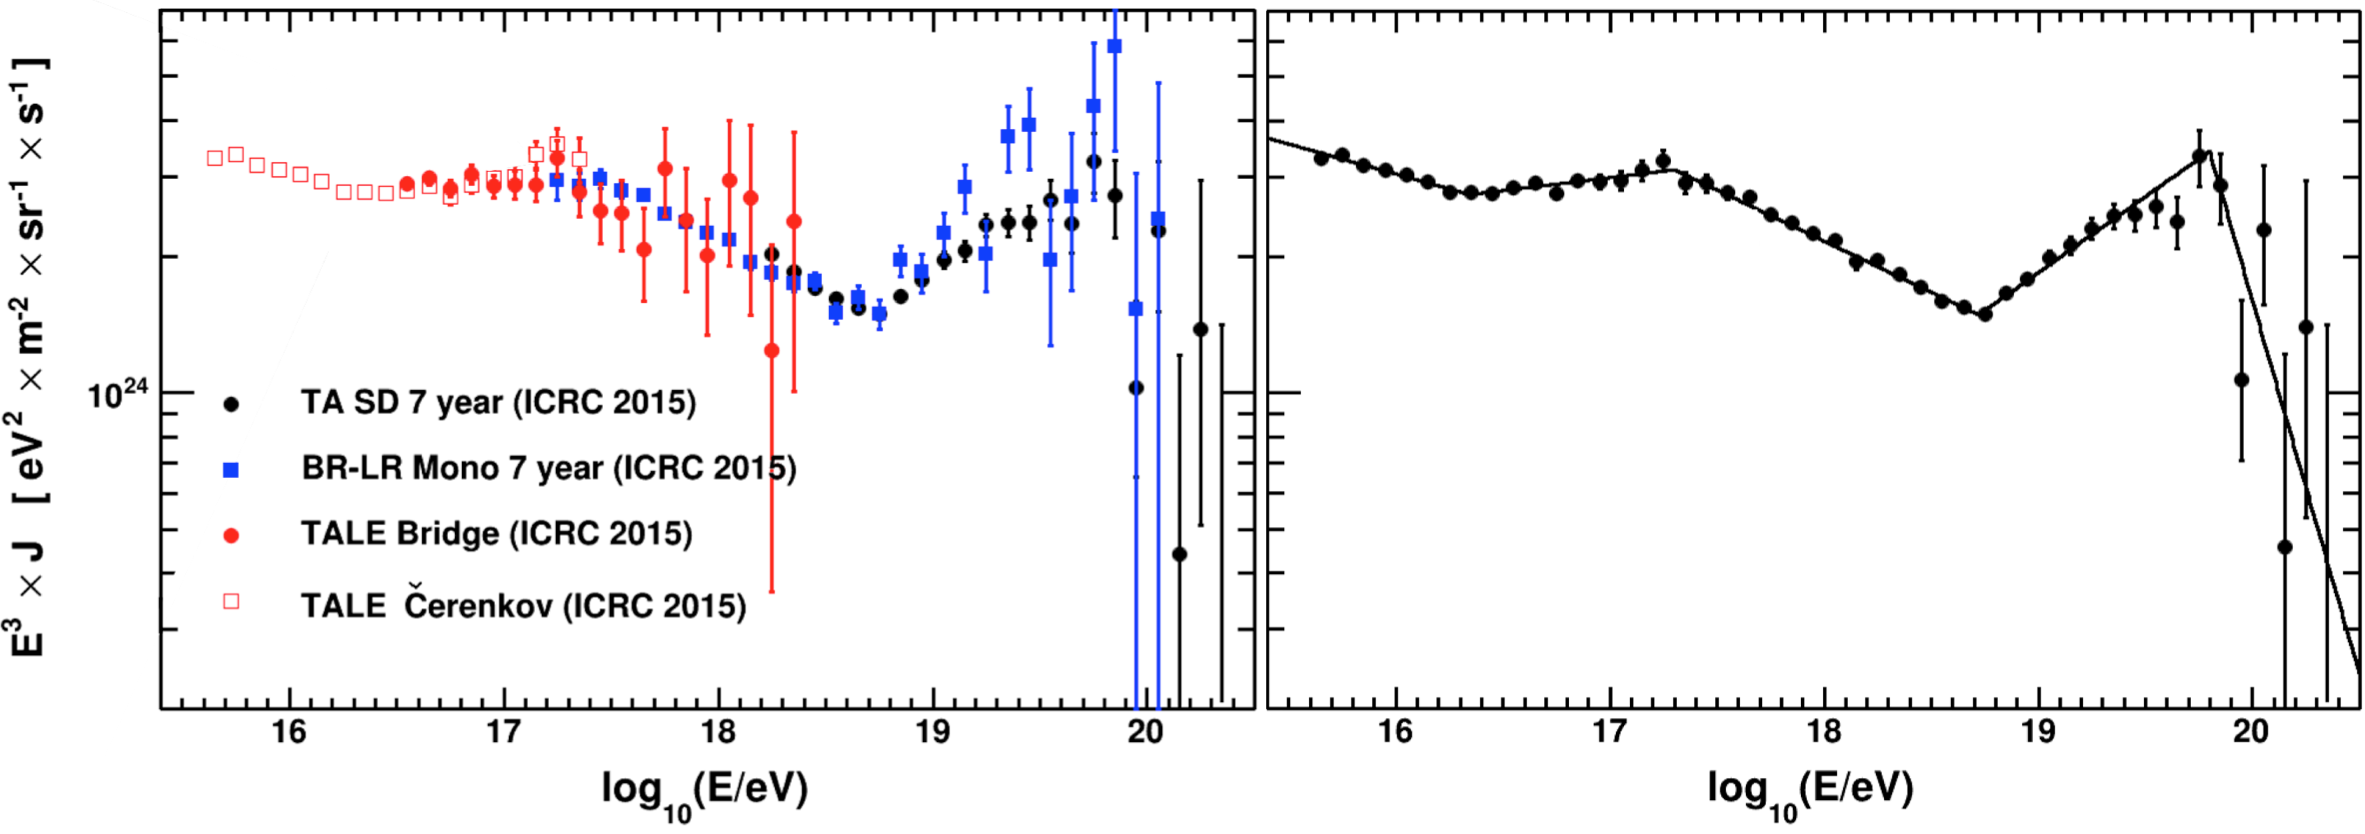
The TA spectrum, including the TA low energy extension, covers over 4.7 orders of magnitude in energy, starting at eV, just above the knee. The analysis of the TALE data has allowed to observe the low energy ankle at eV and the second knee at eV. The ankle and the cut-off of the UHECR spectrum are confirmed with the improved statistics by the BR and LR FD and by the SD. At the very high energies the combined spectrum is dominated by the SD measurements. The TA SD is fully efficient above eV and its energy scale is fixed by the FD as described in Sec. 3.1. The TA SD exposure accumulated over 7 years of data taking is 6300 km2 sr yr. This is estimated using a detailed Monte Carlo simulation that takes into account the detector effects and includes the unfolding corrections that have to be applied to the observed event energy distribution to take into account the bin-to-bin migrations due to the finite resolution of the detector DmitriThesis . Due to the steepness of the spectrum, the effects of the resolution would otherwise be causing a positive bias in the observed flux, since the upward fluctuations of the energies are not fully compensated by downward fluctuations.
It is customary to characterize the shape of the spectra using suitable functional forms. As seen in Fig. 11, the TA collaboration uses power laws with break points that correspond to the energies at which the spectral indexes change their values. Above eV the function is expressed as
and the values of the fitted parameters are shown in Table 4.
| TA spectrum parameters | ||||
|---|---|---|---|---|
| [EeV] | [EeV] | |||
4.1.2 Auger Data
Auger collaboration has measured the energy spectrum using four different techniques. The first two measurements cover the highest energies. The measurements consist of two data sets of vertical and inclined events seen by Auger surface detector array of 1500 m spacing. Intermediate energies are covered by a set of hybrid events seen by the Auger FD and SD. Auger 750 m spacing array covers the low energies down to eV. The energy calibration of these showers is done using the fluorescence detector, as explained in Sec. 3.1. The four energy spectra are shown in the left panel of Fig. 12 and the corresponding exposures are shown in the right panel of Fig. 10. The energy spectrum obtained by combining all four measurements is presented in the right panel of Fig. 12.
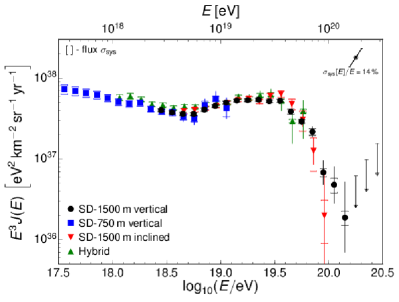
Large size of Auger water tanks as well as the overall surface area coverage are the key factors that enabled the Auger collaboration to perform a high precision measurement of the UHECR energy spectrum with relatively high statistics. All four Auger spectra overlap in the region of the ankle. The cut-off is precisely measured by the 1500 m array with an exposure of 42500 km2 sr yr for the vertical and 10900 km2 sr yr for the inclined showers. The data covers a period of about 10 years. The SD exposure is a purely geometrical quantity, which is based on the calculation of the number of active elemental hexagon cells of the array as a function of time, with an uncertainty of better than 3% Auger-Exposure .
As can be seen in Fig.12, Auger collaboration characterizes the energy spectrum using a functional form that is different from that used by the TA. The function used by Auger consists of a power law below the ankle and a power law with a smooth suppression at the highest energies
Here and are the spectral indexes below and above , respectively, and therefore they have the same meaning as the corresponding TA parameters. is, with a good approximation, the energy at which the spectrum drops to a half of what would be expected in the absence of the cutoff, and is the increment of the spectral index beyond the suppression region. is the overall normalization factor, that is conventionally chosen to be the value of the flux at . The values of the parameters are shown in Table 5.
| Auger spectrum parameters | |||
|---|---|---|---|
| [eV-1km-2sr-1yr-1] | |||
| [EeV] | Es [EeV] | ||
Auger SD spectrum is corrected for the effects of the detector resolution using a forward-folding approach. First, a Monte-Carlo simulation of the detector is used to calculate the resolution bin-to-bin migration matrix. Next, the measured Auger spectrum (before it has been corrected for the effects of the resolution) is fitted to the convolution of the functional form (described above) and the bin-to-bin migration matrix. Once the best fit parameters (Table 5) are obtained, the resolution correction factor is calculated by dividing the fitted spectrum function by the convolution of the fitted spectrum function and the bin-to-bin migration matrix. The final Auger spectrum result is obtained by applying this resolution correction factor to the initial measurement of the spectrum.
4.2 Comparison of the TA and Auger Results
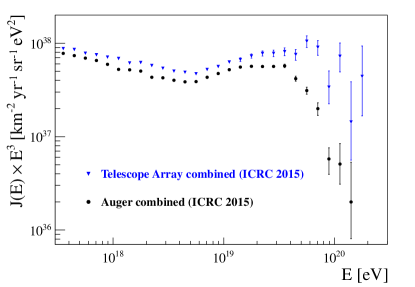
It is customary, in both TA and Auger, to present the cosmic ray spectrum as flux multiplied by the third power of energy () (see Fig. 11 and 12). In this representation, the low energy ankle and the ankle are clearly seen as the local minima, while the second knee and the high energy suppression appear as the local maxima. Figure 13 shows superimposed TA and Auger spectra simply as vs . Stronger features, ankle and the suppression, are still seen in the two results, even without multiplying them by .
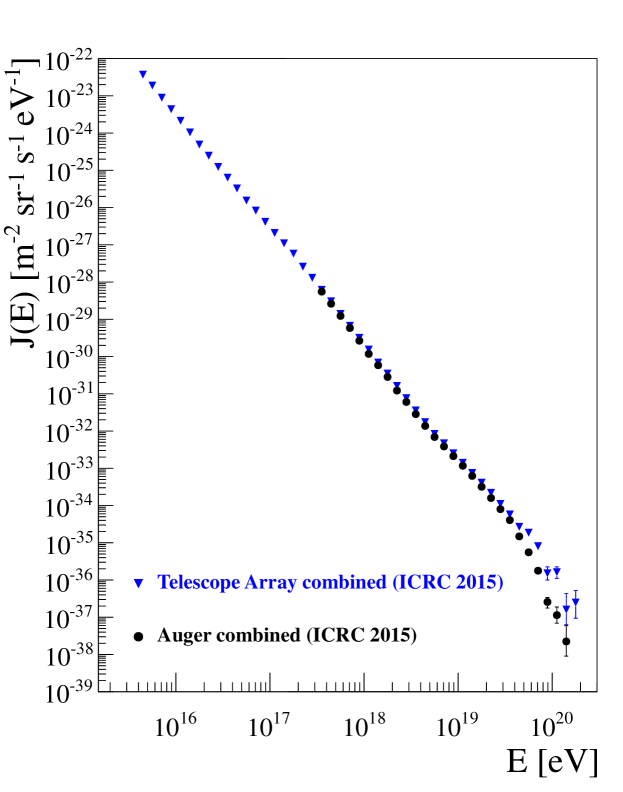
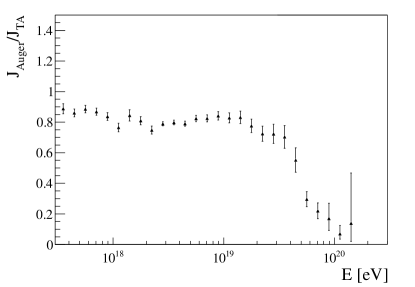
Combined energy spectra of TA and Auger above eV are presented in Fig. 14 (left panel). There is clearly an overall energy scale difference between the two measurements, which is emphasized by the multiplication of the two results by the third power of the energy. The offset appears to be constant below the cut-off energy, above which the TA flux becomes significantly higher than that of Auger.
A more quantitative statement can be made by considering the ratio of the Auger and TA fluxes, shown in the right panel of Fig. 14. Below eV, the Auger flux is 20% lower than the TA flux and the difference between the two measurements becomes large for eV. It should be noted that below eV, the two spectra agree within the systematic uncertainties of the two experiments: a shift in the energy scale of less than 20% (a negative energy shift for TA or a positive energy shift for Auger) would bring the two measurements to an agreement. This shift is well within the uncertainties described in Sec. 3.2, and it can be attributed to the different models of the fluorescence yield and/or the invisible energy correction used by the two collaborations (see Sec. 3.3).
Another way to address the differences between the two measurements is to compare the fitting parameters of the functional forms that describe the shapes of the spectra (see Sec. 4.1). The energy of the ankle and the spectral indices below () and above () the ankle presented in Table 4 and 5 can be compared directly. As expected, they are in good agreement. In the region of the cut-off, on the other hand, the comparison is more difficult, since the parameters that define the two functional forms have different meanings. However, an unambiguous comparison can be made using the parameter suggested in Berezinsky1 that defines the position of the observed cutoff. This is the energy , at which the integral spectrum drops by a factor of two below that which would be expected in the absence of the cutoff. has been calculated by both collaborations. For TA, EeV (statistical error only) TA-EnSp-Comb and for Auger, EeV Auger-EnSp (statistical and systematic error). The two values of are significantly different, even after taking into account the systematic uncertainties in the energy scales of the two experiments.
The difference between the TA and Auger spectra in the region of the cut-off is very intriguing. Because the TA experiment is in the Northern hemisphere and Auger is in the Southern hemisphere and the two experiments look at different parts of the sky, this could be a signature of anisotropy of the arrival directions of the ultra-high energy cosmic rays. Moreover the highest energies are the most promising for the identification of the sources of cosmic rays since the deflections of the trajectories of the primaries in the galactic and extra-galactic magnetic fields are minimized. However the measurement of the spectrum at the cut-off is affected by large uncertainties. In addition to the poor statistics, the analysis is complicated by the steepness of the flux: large spectral index amplifies the uncertainty of the energy scale and it increases the unfolding corrections required to take into account the bin-to-bin migrations due to the finite energy resolution. A continuous and increasing effort is being made by the two collaborations at establishing a better control of these effects and evaluation of the systematic uncertainties.
5 Discussion
The TA and Auger collaborations have developed analyses to constrain the astrophysical models using measurements of the energy spectrum. Observed features in the UHECR spectrum can reveal astrophysical mechanisms of production and propagation of the UHECRs. Moreover, thanks to the unprecedented statistics accumulated by the two experiments, the collaborations have started studying the energy spectrum in different regions of the sky. This represents a big step forward in the cosmic ray field: combined analyses of anisotropies of the arrival directions of cosmic rays, using high statistics whole-sky data, and the features in the energy spectrum can significantly improve our understanding of the nature of the UHECRs.
5.1 Fitting Energy Spectrum to Astrophysical Models
The basic assumption of the models developed by the TA and Auger is that UHECRs are accelerated at the astrophysical sources (the bottom-up models). In fact, most of the so-called top-down models, in which the primaries are generated by the decay of the super heavy dark matter, or topological defects, or exotic particles have been excluded by strong upper limits on ultra-high energy photons and neutrino fluxes Auger-icrc15-HL ; TA-PhotonLimit .
The basic approach developed by TA and Auger to interpret the UHECR spectrum consists of assuming a distribution of identical sources, a mass composition and an energy spectrum at the sources. Then the spectrum at Earth is simulated taking into account the interactions of the primaries with the cosmic radiation (CMB, infrared, optical and ultraviolet) and the magnetic fields encountered during their path. The models are characterized by the parameters whose values are determined from the fit to the experimental data.
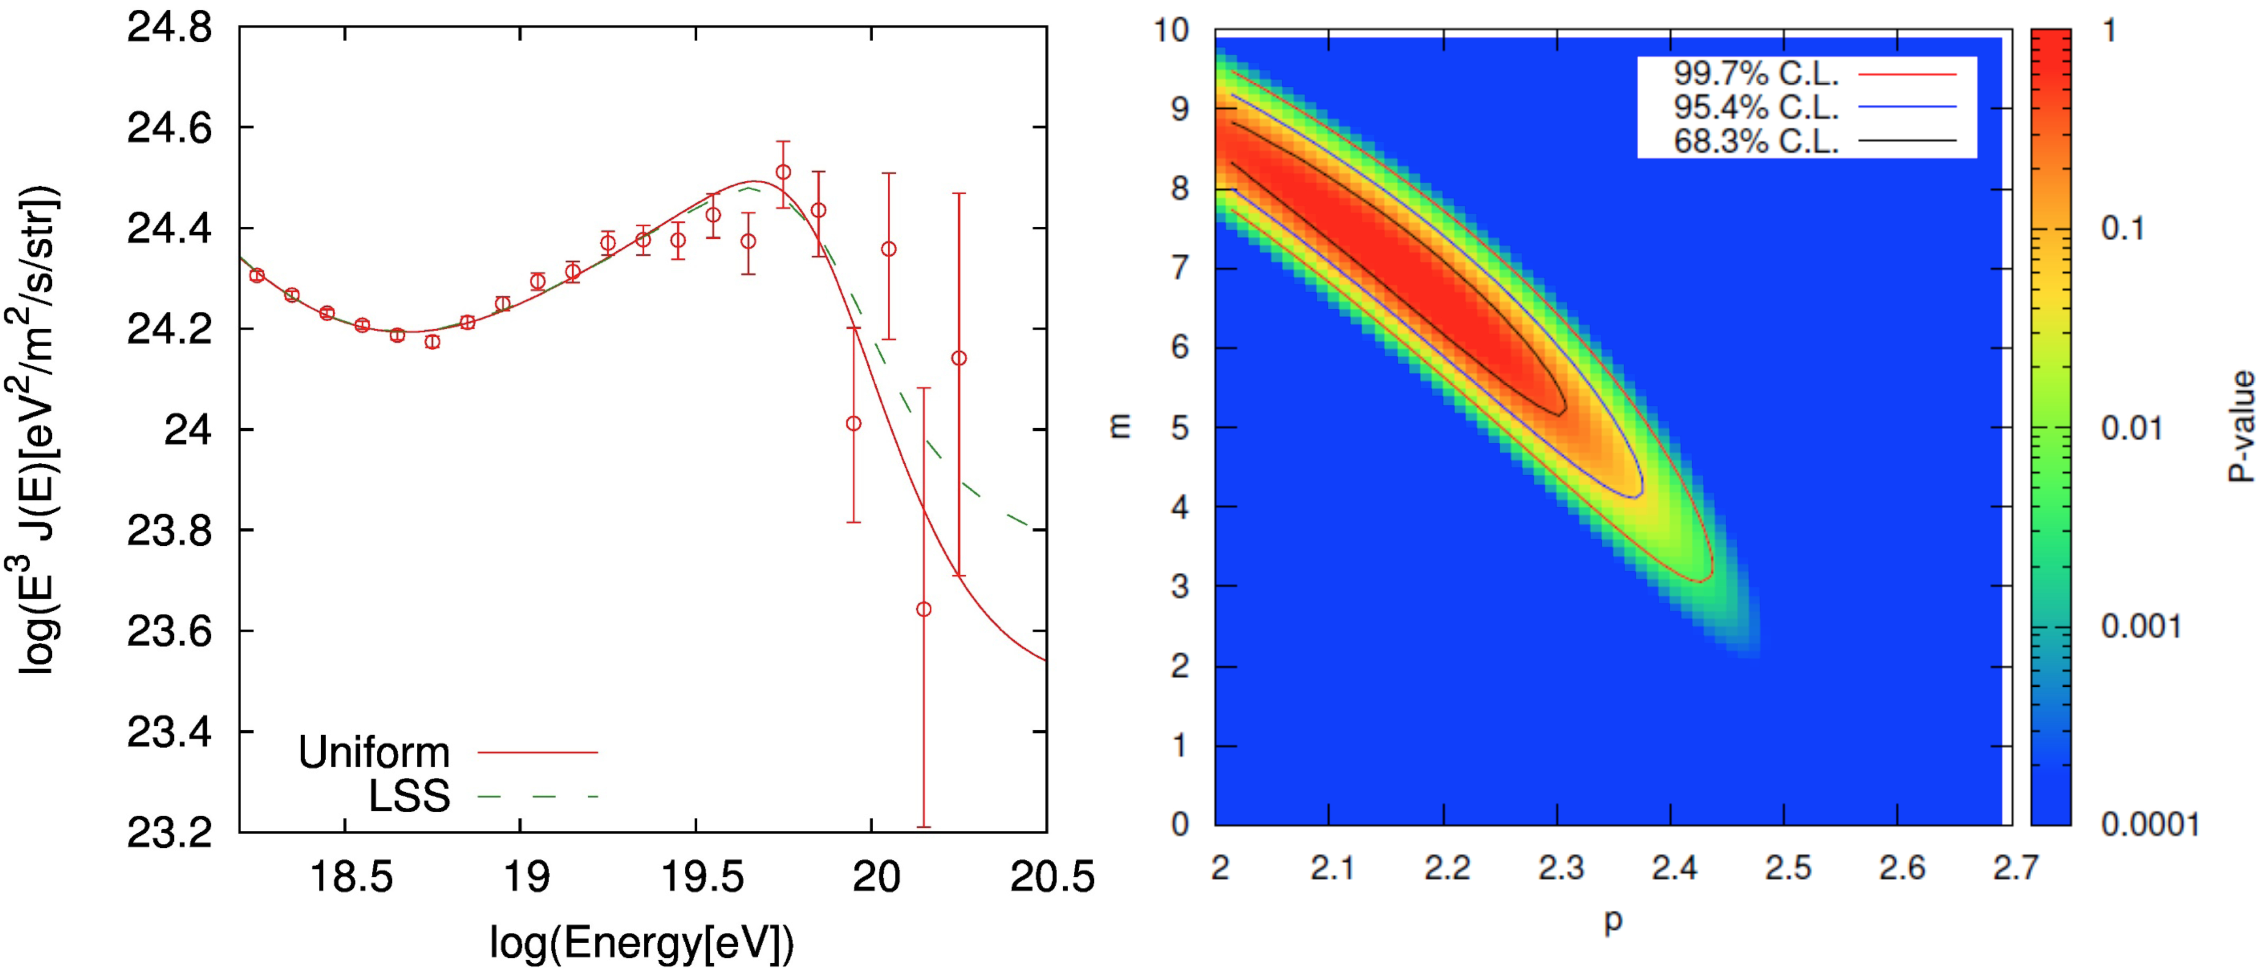
In the TA model TA-EnSp-Interpretation the sources are distributed either uniformly or according to the large-scale structure (LSS) described by the distribution of the galaxies from the Two Micron All Sky Survey TwoMASS . Only proton primaries are simulated. This composition assumption is justified by measurements of the mean made with the TA FD TA-mass . The spectrum of cosmic rays at the sources is parametrized using , where is the redshift and the parameter describes the cosmological evolution of the source density (for the source density is constant per comoving volume). The maximum energy at which the primaries are accelerated is fixed at eV, well above the energy of the GZK effect.
The results of the TA analysis are shown in Fig. 15. The model that fits the SD spectrum TA-EnSp-Comb well is shown using solid and dashed lines, for uniform and LSS density distribution of the sources, respectively. The confidence regions of the model parameters are shown in the right figure. The fitted parameters are and TA-EnSp-Interpretation . The latter indicates a very strong evolution of the sources. The conclusion of the analysis is that the TA spectrum is well described by the interaction of the protons with the CMB: the GZK cut-off Greisen ; ZK , due to the photo-pion production, and the ankle due to the electron-positron pair production Berezinsky1 .

In Auger model Auger-EnSp-Interpretation ; Auger-EnSp-Interpretation-paper , the UHECR mass composition is not fixed, but is fitted to the Auger data Auger-mass , simultaneously with the fit to the UHECR energy spectrum Auger-EnSp . The sources have an isotropic distribution in a comoving volume. The nuclei are accelerated with a rigidity-dependent mechanism up to the maximum energy ( is the charge of the nuclei and is a free parameter of the model). The spectrum of the sources is parametrized with .
The results of the analysis are presented in Fig. 16. The model that fits the measured spectrum and the mean and the standard deviation of best is shown using solid lines in the left panel. The model describes the measurements at energies above the ankle. The deviance (equivalent to a per degree of freedom) as a function of the fitted parameters is shown in the right figure. The absolute minimum corresponds to a very hard injection spectrum () and a low maximum acceleration energy, which is below the energy of the GZK cut-off. This suggests that the observed break of the spectrum is mainly due to a cut-off at the sources rather than to the effects of propagation. There is another less significant minimum at . In this case, the value of is larger and the propagation effects contribute to the break in the spectrum.
The TA and Auger analyses lead to different conclusions. This is due to the difference in energies at which the cut-off is observed and to the different primary mass composition assumptions in the models. In TA, the primaries are protons, while in Auger, the composition is mixed and has a trend with energy toward heavier elements in the suppression region. It is worth mentioning that the Auger and TA measurements of agree within the systematic uncertainties TA-Auger-mass but the inferred mass composition results are different because different hadronic interaction models and Monte Carlo codes have been used to interpret the data in the two experiments. Moreover, the sensitivity of the experiments to the mass composition measurements in the suppression region is strongly limited by the reduced FD duty cycle, a limitation that the Auger Collaboration plans to overcome with an upgrade of the SD detector as described in Sec 6.
5.2 Study of the Declination Dependence of the Energy Spectrum
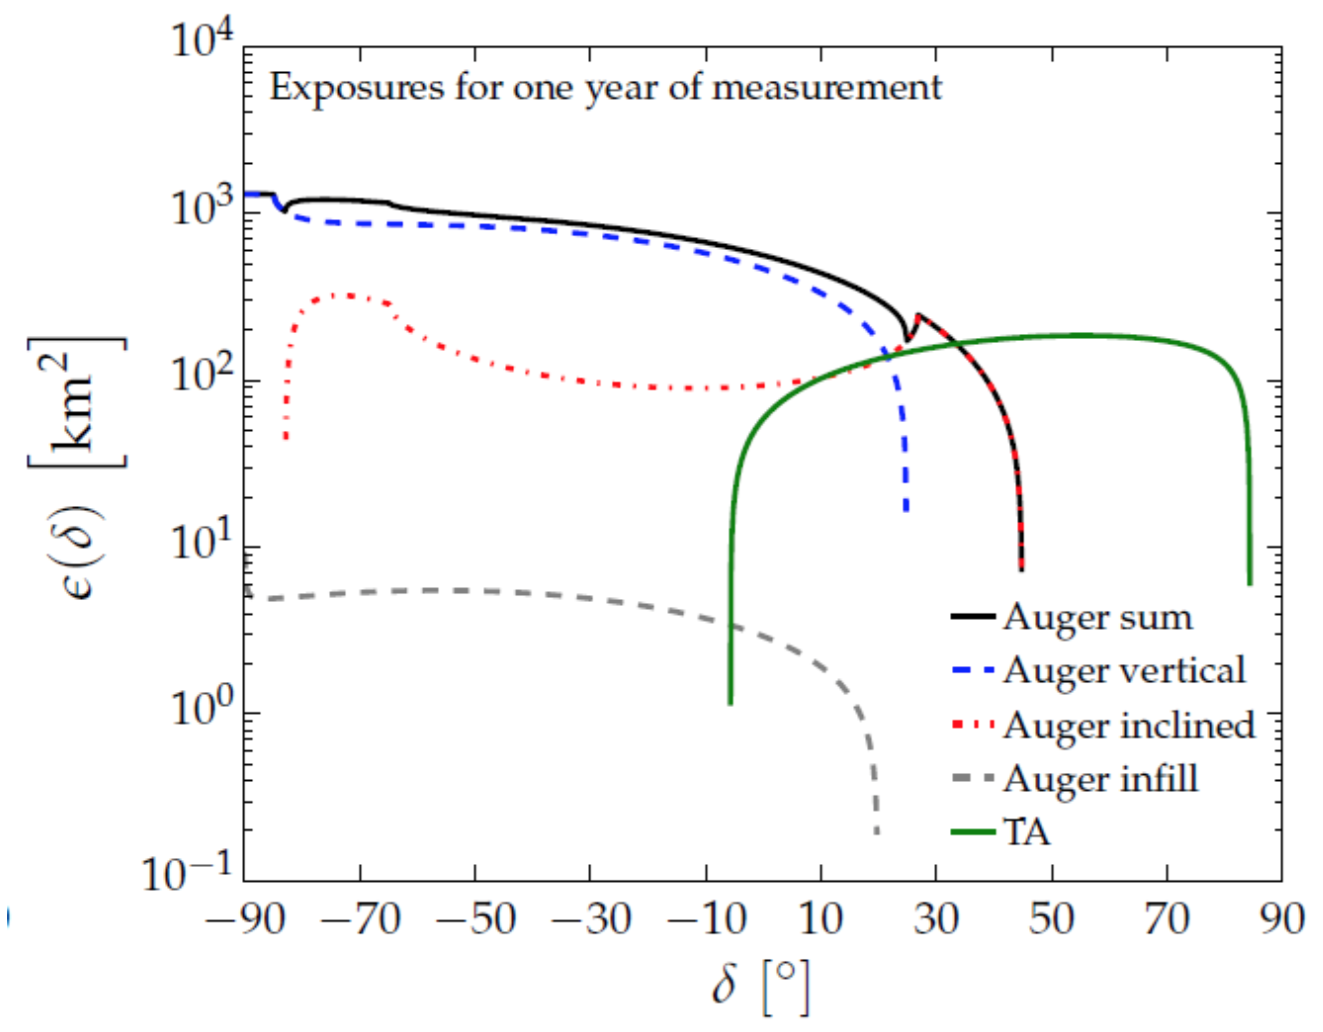
The TA and Auger collaborations have started studying the energy spectrum in different declination bands. The exposures of the two SD detectors versus declination, for one year of data taking, are shown in Fig. 17 Auger-EnSp . For TA, the exposure refers to the events detected by the SD with zenith angles below . For Auger, the exposures are for the 750 m () and 1500 m ( and ) arrays. The Auger exposure obtained by adding the three contributions is also shown.
The study of the spectrum in different declination bands became possible due to the large statistics accumulated by the two experiments. The study is motivated by the recent indications of anisotropy of the arrival direction of cosmic rays. The TA collaboration has found an excess of events of eV in the so called hot spot, an angular region of radius in the direction of ( - right ascension and declination), near the Ursa Major TA-HotSpot-publ ; TA-Anisotropy . The Auger collaboration reported an indication of a dipole amplitude in right ascension for the events of energies above eV, which corresponds to a reconstructed dipole with . Also, Auger has found another, less significant dipole amplitude, at the lower energies Auger-LargeScale .
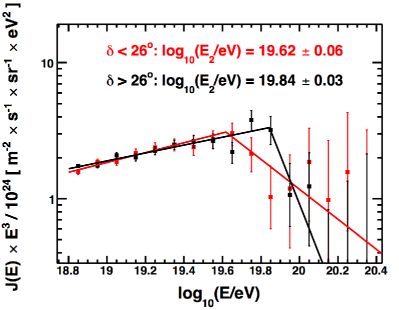
The TA collaboration has measured the SD energy spectrum in two declination bands, and . For this analysis, TA events with zenith angle () up to have been selected. In comparison to the standard SD spectrum calculation, which is done using events with , this analysis allows to increase the statistics and to lower the minimum declination of the events from about to . However it requires an higher energy threshold at eV, which is above the ankle. It has been shown that the two TA spectra calculations are fully consistent above eV WG3 .
The declination dependence of the TA spectrum using 6 years of data WG2 is shown in the left panel of Fig. 18. Solid lines represent the (fitted) power laws with one breaking point. The definition of the so-called second break point energy () is equivalent to of Table 4. The corresponding values are: EeV, for , and EeV, for . Even if the sensitivity of the analysis is low due to the limited statistics, it is interesting to note that the tension with Auger data (which observes the suppression at a significantly lower energy - see Sec. 4.2) persists in the band at larger values of declinations, , while at the lower declinations, , where the TA and Auger fields of view partially overlap, the experiments see very similar energies of the suppression.
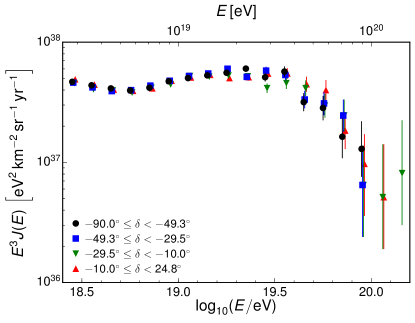
The Auger collaboration has measured the energy spectrum in four declination bands with an exposure of about 42500/4 km2 sr yr each Auger-EnSp . The results are presented in the right panel of Fig. 18. There is no significant declination dependence of the flux. It has been demonstrated that the small differences between the fluxes are consistent with the expectation from the dipole anisotropy Auger-LargeScale . The analysis is limited to the declinations up to since it uses only the events detected by the 1500 m array with zenith angles .
A systematic study of the difference of the spectra measured by the two experiments in the same declination band is of crucial importance, since it will help to understand whether the differences between the spectra addressed in Sec. 4.2 have been caused by the systematic uncertainties of the experiments or these differences are due to an anisotropy signal. It is worth noting that, even if the spectra are compared in a declination band accessible by the two experiments, such analysis would not allow to arrive to a definitive conclusion if the shapes of the directional exposures in the common declination band are not similar, because the spectra would be affected by a potential anisotropy signal in different ways. As shown in Fig. 17, this is the case of the comparison of the TA spectrum with the Auger one obtained with the vertical events (). In fact, the two directional exposures have an opposite trend, increasing function of the declination for TA and decreasing for Auger.
At the time of writing this paper, the Auger collaboration has not presented the declination dependence of the energy spectrum obtained using the inclined events (). We remark the importance of this measurement, since in the common declination band, the directional exposure for the Auger inclined events is of a similar shape to that of TA. Moreover, the comparison could be extended to higher declinations, up to , whereas the vertical event Auger analysis goes only up to degrees.
At the 2016 Conference on Ultra-High Energy Cosmic Rays, Kyoto (Japan) the two collaborations have presented a new and promising analysis method WG3 , proposed by the members of the working group, aimed at combining the results of the anisotropy searches within the TA and Auger WG-Olivier . It consists of comparing the results of an alternative flux estimate, obtained by counting the numbers of events in the energy bins and weighting them by the inverse of the directional exposure. The resulting flux does not depend on the shape of the directional exposure and therefore, it should be same for TA and Auger. If a difference is found, it is to be ascribed to the experimental effects, and it should be consistent with the systematic uncertainties 3.2.
The analysis presented in WG3 is still preliminary. However, it has marked the road that should be followed to understand the differences in the measurements of the energy spectrum at the highest energies. It is worth to note that the application of this method requires a very good control of the systematic uncertainties. This alternative flux estimate should be consistent with the standard flux calculation if the arrival directions of cosmic rays are distributed isotropically, and this is possible only if the systematic uncertainties on the event reconstruction and the exposure calculations are well understood. The TA collaboration has shown that the two flux estimation methods are consistent in the declination band accessible by Auger with vertical events () and in the full declination band (which includes the hot spot).
6 Conclusions and Outlook
The Telescope Array and the Pierre Auger Observatory are the two largest cosmic ray detectors built so far. Their large exposures have allowed an observation of the suppression of the flux of cosmic rays at the very high energy with unprecedented statistics and precision.
Both experiments combine the measurements of a surface array with the fluorescence detector telescopes. The hybrid system allows to measure the cosmic rays with an almost calorimetric energy estimation, which is less sensitive to the large and unknown uncertainties due to limited knowledge in the hadronic models, that are extrapolated well beyond the energies attainable in laboratory experiments. Having a precise estimate of the energy scale is of crucial importance for the measurement of the energy spectrum. In fact, the uncertainty in the energy estimation (), when propagated to the energy spectrum (), is amplified by the power index with which the flux falls off with energy ().
The TA and Auger measure the cosmic rays in the northern and southern hemispheres, respectively. At energies below the suppression, the fluxes are expected to be the same because of the high level of isotropy in the arrival directions of the cosmic rays TA-icrc15-HL ; Auger-icrc15-HL . A good control of the systematic uncertainties of the energy scale of the two experiments is demonstrated by a remarkable agreement attained in the determination of the ankle at about eV. The energy of the ankle measured by TA is only +8% larger than the one measured by Auger (see Tables 4 and 5), which is roughly in agreement with the 20% difference in the flux normalization below the cut-off shown in Fig. 14. The difference in the ankle positions is fully consistent with the uncertainties in the energy scales quoted by the two experiments (21% and 14% for TA and Auger, respectively) and, it is expected to be reduced if the two collaborations adopt the same model for the fluorescence yield and for the invisible energy correction (see Sec. 3.3).
Despite the good agreement in the region of the ankle and even at the lower energies, the TA and Auger spectra differ significantly in the region of the suppression (see Fig. 14). As discussed in Sec. 4.2, this discrepancy can be also quantified comparing the values of the parameter Berezinsky1 that describes the position of the cut-off. The values reported by the two collaborations differ by a factor 2.5, which is well beyond the systematic uncertainties of the energy determination.
Understanding the difference between the two spectra in the region of the cut-off is one of the major issues in the study of the UHECRs. At these extreme energies the deflections of the trajectories of the primaries in the galactic and extra-galactic magnetic fields are minimized, allowing the source identification, and therefore the spectra at Earth detected in the two different hemispheres could be different. The two collaborations have started studying their spectra in different declination bands. For TA, these studies are very relevant because of the hot spot near the Ursa Major constellation TA-HotSpot-publ ; TA-Anisotropy . As shown in Sec. 5.2, these studies have a great potential but are currently limited by the statistics.
Another important finding of these studies is that the declination range of the exposures of the two experiments partially overlap. This offers the possibility of making a comparison of the spectra in the same region of the sky WG1 ; WG2 ; WG3 . Any discrepancy found would be indicative of an experimental effect that’s due to the systematic uncertainties. One should note that the spectrum steepness in the energy region of the suppression amplifies the uncertainties in the energy scale and the event bin-to-bin migration that is due to the finite energy resolution. These effects, in addition to the limited statistics, make the measurement of the flux at the energies of the suppression very challenging.
The features of the energy spectrum at very high energies are sensitive to the production and the propagation of the UHECRs and have been used to constrain astrophysical models. As shown in Sec. 5.1, the TA spectrum is well fitted by a model in which the primaries are protons (hypothesis consistent with the TA FD measurement of the mean TA-mass ) and therefore the ankle is explained by the proton interactions with the CMB via electron-positron pair production Berezinsky1 and the cut-off is explained by the GZK effect Greisen ; ZK . The Auger interpretation of their energy spectrum is more complicated. The inclusion of the trend toward heavier nuclei at the highest energies inferred from the FD measurements Auger-mass leads to a scenario in which the observed break of the spectrum is not due to the effects of propagation. In this model the nuclei are accelerated by a rigidity-dependent mechanism with a cut-off that is observed in the spectrum measured at Earth.
The studies presented by the TA and Auger demonstrate that the knowledge of the chemical composition plays an important role in the interpretation of the features of the energy spectrum. The results on of the two experiments are consistent TA-Auger-mass , but the inferred mass composition answers are different because the two collaborations have assumed different hadronic interaction models and used different Monte Carlo procedures. Extrapolation of the hadronic models beyond the energies attainable by accelerator physics is one of the major issues in understanding the air showers produced by the UHECRs. The shower development is mainly influenced by the particle production in the forward region, where the accelerator data are available only for energies up to a few hundreds of GeV Engel-HadInt . A big improvement in this field will be possible by building a fixed target experiment using the beam of the LHC collider.
The two collaborations will be taking data in the next years and are working on improving their detectors. The TA collaboration will quadruple the area of the SD array to approximately the current size of Auger, which is km2. This extension is called the TA4 TAx4 and it will be realized by adding 500 surface detectors using 2.08 km spacing. The aim is to improve the measurement of the cosmic rays beyond the suppression energy, as well as the sensitivity to the hot spot and other astrophysical sources. Also, two additional FD stations will be constructed to overlook the new SD array and to improve the composition studies at the highest energies.
The Auger collaboration will upgrade the SD array by mounting scintillator detectors on the top of each WCD station. The upgrade of the Pierre Auger Observatory is called AugerPrime AugerPrime . The combined analysis of the signal of the two detectors will allow to extract the muonic shower component and to extend the composition sensitivity of the detector into the flux suppression region, where the FD measurements are limited by the duty cycle. This will allow to improve the understanding of the origin of the cut-off and to select light primaries for the anisotropy studies.
Even if the primary scope of TA and Auger is to study cosmic rays at the highest energies, an effort has been made with the TALE and Infill detectors to lower the minimum detectable shower energy threshold. The TALE FD energy spectrum has made it possible to observe the low energy ankle and the second knee. A similar result could be obtained with the HEAT telescopes of Auger. Building surface arrays of closer spacing is feasible for large collaborations such as TA and Auger and it would allow to extend the measurements down to the energies of the knee.
The next decade will offer many opportunities to understand the origin of the UHECRs. TA4 and Auger will view the full sky with a total collection area of 6000 km2. The two collaborations are working together on combining their measurements. The declination band accessible by the two experiments is instrumental in achieving a better understanding of the systematic uncertainties and the differences in the energy scales. This will allow us to measure the energy spectrum from the knee up to the suppression and beyond in the entire sky with an unprecedented statistics and precision, which in turn will allows us to measure the energy spectra of cosmic rays in different declination bands or sky patches. So far, anisotropy studies using small (a few degree) or intermediate angular scales were carried out independently from the energy spectrum studies, although there were several studies of the energy dependencies of anisotropies. We emphasize here that the energy spectrum, the number of cosmic ray particles per time in a unit area from a given direction in a given energy range is, by definition, a function of the direction. The measurement of the full-sky energy spectrum by the future Auger and TA will make a crucial contribution to identifying the sources of ultra- high energy cosmic rays.
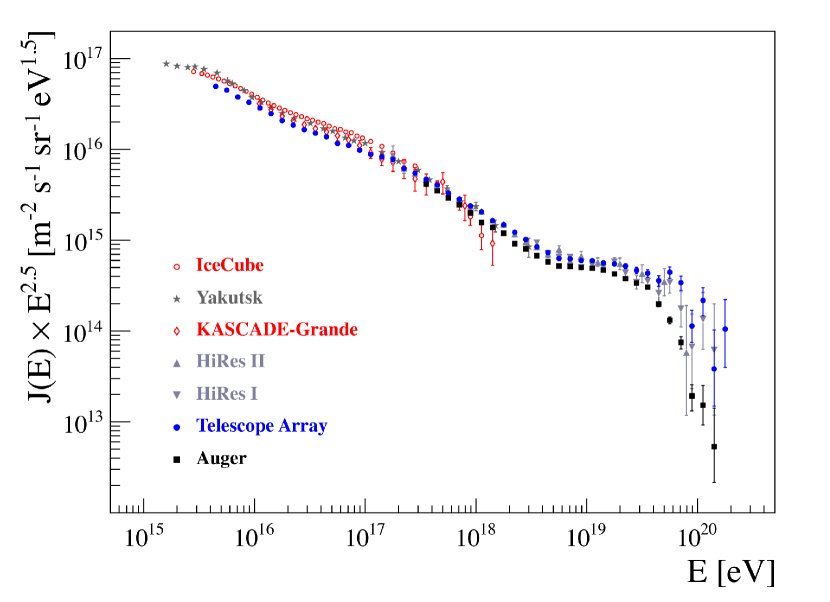
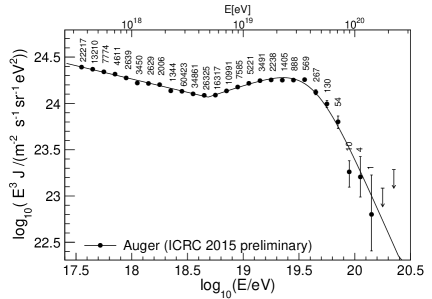
We conclude this review with a compilation of recent experimental data on the energy spectrum presented in Fig. 19.
References
- (1) G. Matthiae and V. Verzi, Riv. Nuovo Cimento 38 N.2 (2015) 73 and references therein.
- (2) V. Verzi, Rapporteur Report of 34th ICRC 2015, The Hague, The Netherlands, PoS (ICRC2015) 015.
- (3) K-H. Kampert and A. Watson, Euro. Phys. J. H, 37 (2012) 359-412
- (4) K. Greisen, Phys. Rev. Lett. 16 (1966) 183
- (5) G. T. Zatsepin and V. A. Kuz’min, Sov. Phys. JETP Lett. 4 (1966) 114.
- (6) V. Berezinsky et al., Phys. Rev. D 74 (2006) 043005.
- (7) R. Aloisio et al., J. Phys. Conf. Ser. 337 (2012) 012042.
- (8) R.U. Abbasi et al., Phys. Rev. Lett., 100 (2008) 101101.
- (9) M. Takeda et al., Astropart. Phys 19 (2003) 447; K. Shinozaki et al., Nucl. Phys. B (Proc. Suppl.) 151 (2006) 3.
- (10) C. Jui, for the Telescope Array Collaboration, in Proc. 34th ICRC 2015, The Hague, The Netherlands, PoS (ICRC2015) 035.
- (11) P. Ghia, for the Pierre Auger Collaboration, in Proc. 34th ICRC 2015, The Hague, The Netherlands, PoS (ICRC2015) 034.
- (12) M. Fukushima et al., Prog. Theor. Phys. Suppl. 151 (2003) 206.
- (13) T. Abu-Zayyad et al., Nucl. Instrum. Methods A 689 (2012) 87.
- (14) J. Boyer et al., Nucl. Instrum. Meth. A482 (2002) 457.
- (15) H. Tokuno et al., Nucl. Instrum. Meth. A 676 (2012) 54.
- (16) S. Kawana et al., Nucl. Instrum. Meth. A 681 (2012) 68.
- (17) H. Tokuno et al., Nucl. Instrum. Meth. A 601 (2009) 364.
- (18) B. K. Shin et al., Nucl. Instrum. Meth. A 768 (2014) 96.
- (19) The Pierre Auger Collaboration, Nucl. Instrum. Meth. A 798 (2015) 172.
- (20) J. Brack et al., J. of Instrum. 8 (2013) P05014.
- (21) T. Tomida et al., Nucl. Instrum. Methods A 654 (2011) 653-660.
- (22) T. AbuZayyad, for the Telescope Array Collaboration, in Proc. 34th ICRC 2015, The Hague, The Netherlands, PoS (ICRC2015) 422.
- (23) Z. Zundel, for the Telescope Array Collaboration, in Proc. 34th ICRC 2015, The Hague, The Netherlands, PoS (ICRC2015) 455.
- (24) T. Shibata et al., Nucl. Instrum. Meth. A 597 (2008) 61-66.
- (25) J. Rosado et al., Astropart. Phys. 55 (2014) 51.
- (26) The Telescope Array Collaboration, Astropart. Phys. 61 (2015) 93.
- (27) M. Unger et al., Nucl. Instrum. Meth. A 588 (2008) 433.
- (28) D. Ivanov, for the Telescope Array Collaboration, in Proc. 34th ICRC 2015, The Hague, The Netherlands, PoS (ICRC2015) 349.
- (29) I. Valiño, for the Pierre Auger Collaboration, in Proc. 34th ICRC 2015, The Hague, The Netherlands, PoS (ICRC2015) 271.
- (30) D. Ivanov, Energy Spectrum Measured by the Telescope Array Surface Detector, doctoral thesis, New Brunswick, New Jersey, October, 2012.
- (31) T. Abu-Zayyad et al., Astrophys. J. Lett., 768 (2013) L1.
- (32) J. Hersil et al., Phys. Rev. Lett. 6 (1961) 22.
- (33) The Pierre Auger Collaboration, JCAP 08 (2014) 019.
- (34) Y. Tsunesada et al., in Proc. 32nd ICRC 2011, Beijing, China, 1227.
- (35) V. Verzi, for the Pierre Auger Collaboration, in Proc. 34th ICRC 2013, Rio de Janeiro, Brazil, arXiv:1307.5059 [astro-ph.HE].
- (36) F. Kakimoto et al., Nucl. Instrum. Meth. A 372 (1996) 527.
- (37) R. Abbasi et al., Astropart. Phys. 29 (2008) 77.
- (38) M. Ave et al., Astropart. Phys. 42 (2013) 90.
- (39) M. Ave et al., Astropart. Phys. 28 (2007) 41.
- (40) M. Ave et al., Nucl. Instrum. Meth. A 597 (2008) 50.
- (41) M.Bohacova, for the Airfly Collaboration, talk given at the 6th Air Fluorescence Workshop, LNGS, Assergi, l’Aquila (Italy) (2009).
- (42) The Pierre Auger Collaboration, Astropart Phys. 33 (2010) 108.
- (43) The Pierre Auger Collaboration, JINST 8 (2013) P04009.
- (44) https://ready.arl.noaa.gov/gdas1.php
- (45) The Pierre Auger Collaboration, Astropart Phys. 35 (2012) 591.
- (46) M. Tueros, for the Pierre Auger Collaboration, in Proc. 34th ICRC 2013, Rio de Janeiro, Brazil, arXiv:1307.5059 [astro-ph.HE].
- (47) B.R. Dawson et al., for the Telescope Array and Pierre Auger Collaborations, EPJ Web of Conferences 53 (2013) 01005.
- (48) J.R. Vázquez Peñas et al., in Proc. 34th ICRC 2013, Rio de Janeiro, Brazil, paper 0871.
- (49) J.R. Vázquez Peñas, Impact of the air fluorescence yield on the energy scale of the Pierre Auger Observatory, doctoral thesis, Universidad Complutense De Madrid, Madrid, Spain (2015).
- (50) I. Mariş et al., for the Telescope Array and Pierre Auger Collaborations, talk given at the 2014 Conference on Ultrahigh Energy Cosmic Rays, Springdale, Utah (USA).
- (51) The Pierre Auger Collaboration, Astropart Phys. 32 (2009) 89.
- (52) B. Shin et al., for the Telescope Array Collaboration, in Proc. 34th ICRC 2015, The Hague, The Netherlands, PoS (ICRC2015) 640.
- (53) The TA Collaboration, Astropart Phys. 64 (2014) 49.
- (54) K.-H. Kampert and M. Unger, Astropart Phys. 35 (2012) 660.
- (55) The Pierre Auger Collaboration], Phys. Rev. D 90 (2014) 122005.
- (56) M. Unger, for the Telescope Array and Pierre Auger Collaborations, in Proc. 34th ICRC 2015, The Hague, The Netherlands, PoS (ICRC2015) 307.
- (57) The Pierre Auger Collaboration, Phys. Rev. D 91 (2015) 032003; Erratum: Phys. Rev. D 91 (2015) 059901.
- (58) T. AbuZayyad et al., Phys. Rev. D, 88 (2013) 112005.
- (59) E. Kido and O. E. Kalashev, for the Telescope Array Collaboration, in Proc. 34th ICRC 2015, The Hague, The Netherlands, PoS (ICRC2015) 258.
- (60) J.P. Huchra, L.M. Macri, K.L. Masters, et al. Astrophys. J. Suppl., 199 (2012) 26
- (61) T. Fujii, for the Telescope Array Collaboration, in Proc. 34th ICRC 2015, The Hague, The Netherlands, PoS (ICRC2015) 320.
- (62) The Telescope Array Collaboration, Astropart Phys. 80 (2016) 131.
- (63) The Pierre Auger Collaboration, Nucl. Instr. and Methods A 613 (2010) 29.
- (64) P. Tinyakov et al., for the Telescope Array Collaboration, in Proc. 34th ICRC 2015, The Hague, The Netherlands, PoS (ICRC2015) 326.
- (65) The Telescope Array Collaboration, Astrophys. J. 790 (2014) L21.
- (66) I. Al Samarai, for the Pierre Auger Collaboration, in Proc. 34th ICRC 2015, The Hague, The Netherlands, PoS (ICRC2015) 372.
- (67) V. Verzi et al., for the Telescope Array and Pierre Auger Collaborations, talk given at the 2016 Conference on Ultrahigh Energy Cosmic Rays, Kyoto (Japan).
- (68) O. Deligny et al., for the Telescope Array and Pierre Auger Collaborations, in Proc. 34th ICRC 2015, The Hague, The Netherlands, PoS (ICRC2015) 395.
- (69) A. di Matteo, for the Pierre Auger Collaboration, in Proc. 34th ICRC 2015, The Hague, The Netherlands, PoS (ICRC2015) 249.
- (70) The Pierre Auger Collaboration, submitted to JCAP, arXiv:1612.07155 [astro-ph.HE].
- (71) J. Aublin, for the Pierre Auger Collaboration, in Proc. 34th ICRC 2015, The Hague, The Netherlands, PoS (ICRC2015) 310.
- (72) R. Engel, in Proc. 34th ICRC 2015, The Hague, The Netherlands, PoS (ICRC2015) 007.
- (73) H. Sagawa, for the Telescope Array Collaboration, in Proc. 34th ICRC 2015, The Hague, The Netherlands, PoS (ICRC2015) 657.
- (74) R. Engel, for the Pierre Auger Collaboration, in Proc. 34th ICRC 2015, The Hague, The Netherlands, PoS (ICRC2015) 686.
- (75) K. Rawlins and T. Feusels, for the IceCube Collaboration, in Proc. 34th ICRC 2015, The Hague, The Netherlands, PoS (ICRC2015) 334.
- (76) I. Petrov et al., for the IceCube Collaboration, in Proc. 34th ICRC 2015, The Hague, The Netherlands, PoS (ICRC2015) 252.
- (77) The KASCADE-Grande Collaboration, Astropart. Phys. 36 (2012) 183.
- (78) R.U. Abbasi et al., Phys. Rev. Lett., 100 (2012) 101101.