HD 46487 is Now a Classical B Star
Abstract
We present the first observations of hydrogen line emission detected around the B-type star HD 46487, a well-studied star in the CoRoT field of view. The emission is only evident in the H line, for which the observed violet-red peak separation () is typical of a B star with a circumstellar disk. The absence of dust emission from the infrared spectral energy distribution excludes the possibility of a very young star. The star’s magnitude (V) and regular use in the literature for a variety of studies suggests that the line emission had a high probability of being found previously, had it been evident; since such was not the case, we believe that the B phenomenon for HD 46487 has only very recently “turned on.” We therefore recommend that this star be spectroscopically and photometrically monitored to track continued changes to its circumstellar morphology.
1 Introduction
Main sequence and giant B-type stars are often fast rotators. Classical B stars are universally so, and most are believed to rotate at speeds near critical (Townsend et al., 2004). Unlike “normal” B-type stars, however, B stars experience nonradial pulsational modes that eject matter from the surface, allowing them to form a circumstellar decretion disk at the star’s equator (Rivinius et al., 2013). It is therefore interesting that stars have become B stars after decades of appearing normal, or else have ceased to exhibit the B phenomenon (Chojnowski et al., 2015, 2017). In fact, observations of the transition between normal B-type and B star are becoming quite common; many examples exist in the more than decade-long archive of the B Star Spectra (BeSS) Database111BeSS may be accessed online at http://basebe.obspm.fr/basebe/Accueil.php?flag_lang=en (Neiner et al., 2011). With the help of BeSS, data are being collected that illustrate the timescales on which disks build up and decrete, track violet-to-red emission peak separation (VR) variability due to one-armed global oscillations (Okazaki, 1991), and variability due to outbursts.
But in spite of this growing collection of data, little is known about why they begin to exhibit emission when they do (Porter & Rivinius, 2003). McSwain et al. (2009) showed that B stars rotate faster on average than normal B-type stars, and their near-critical speeds make it easier for B stars to lose mass to their surroundings. The difference in rotation rate for roughly 75% of B stars is likely due to the transfer of angular momentum during binary interactions (McSwain & Gies, 2005; de Mink et al., 2013), and evidence suggests that such interactions are most common within the first 100 Myr of the star’s life.
HD 46487, unlike many recently discovered B stars, has been well-studied of late; partly this is because it is a bright source (V) but also because it resides in the CoRoT field of view, which was targeted for exoplanet discoveries and asterseismology studies Auvergne et al. (2009). At the time that the CoRoT field of view was being searched for B stars, HD 46487 was not one, and so was not included in Neiner et al. (2005) or Frémat et al. (2006). However, other publications from this time allow us to search for any evidence of extant or forming circumstellar matter in the past couple of decades. Its far-ultraviolet (FUV) spectrum exhibited no resonance lines in 2003, as we might have expected for a B star (Jo et al., 2016; Rountree & Sonneborn, 1991). It also showed no evidence of any photospheric pulsation (Lefever et al., 2010); photometric variability, due to either periodic variability or outbursts, is a common feature of B stars (Labadie-Bartz et al., 2017; Rivinius, 2013). Other more recent uses for HD 46487 in the literature, such as being used as a calibrator in interferometric observations (e.g., Ellerbroek et al., 2015), further suggest that the star was still normal until as late as 2013.
Several studies have provided us with fundamental physical parameters. HD 46487 was classified as a B5 Vn star in Abt et al. (1990), where the “n” designation suggests broad absorption lines. Its projected rotational speed, where is the inclination angle, is likely between 285-300 km/s (Abt, et al., 2002; Huang et al., 2010). This high speed has lead to a bulging out of the equator, such that the equator has a substantially lower surface gravity than its poles (log() of 3.63 at the equator, compared to 3.95 at the poles; Huang et al., 2010). There is no observed binary companion (Abt et al., 1990; Eggleton & Tokovinin, 2008; Gullikson et al., 2016a). Recent spectra of HD 46487 are reported in Gullikson et al. (2016a, b). Presented in these works there is a high-resolution (R60,000) spectrum in the wavelength range 3400Å-10000Å taken with the cross-dispersed echelle spectrograph (TS23) at the Harlan J. Smith 2.7-meter telescope222http://www.as.utexas.edu/mcdonald/facilities/2.7m/cs2.html on 2014-01-11, as well as two near-infrared (1.45-2.5) spectra taken with IGRINS (Park et al., 2014) on the same telescope taken on 2014-10-16 and 2015-03-03. These three spectra together cover wavelengths for Balmer, Paschen, and Brackett series hydrogen lines, and would all have clearly exhibited that HD 46487 was an emission-line source, had it been evident.
We present the first known observations, taken in March 2017, of the onset of the B phenomenon in the well-studied star HD 46487. We will describe our observations and data reduction in Section 2, present and analyze our spectra in Section 3, briefly discuss the results in Section 4, and then conclude in Section 5.
2 Observations and data reduction
The Adams Observatory sits atop the IDEA Center science building at Austin College in Sherman, TX. This facility provides opportunities for research, introductory and advanced astronomy classes, and public star-gazing events. Built by DFM Engineering in 2013, the 0.61-m Ritchey-Chrétien telescope is used primarily for spectroscopy, photometry, and imaging. Instruments are located at Cassegrain focus.
The spectrograph used for these observations is a long-slit LhiresIII spectrograph designed for commercial sale by Shelyak Instruments. It is a modular spectrograph for which the dispersion grating can easily be switched. Collimation and focusing are performed by the same optic, a simple doublet with and a diameter of 30 mm.
The CCD camera being used is a Finger Lakes Instrumentation (FLI) Microline with a thermoelectric cooler that can reach C below ambient. It contains a back-illuminated e2V 42-10 CCD that is coated for enhanced broadband transmittance (75-95% quantum efficiency from Å- 7000Å) and the array of 5122048 pixels are each 13.5 square. Considering the demagnification of the spectrograph camera, the effective pixel size at the slit mask is 16. We therefore choose a 35 slit as the best resolution match (a 32 slit is not available for sale through Shelyak). The camera and spectrograph can be used to observe stars as faint as .
Dispersion with the 2400 gr/mm dispersion grating is 0.168Å per pixel around 6500Å, and 0.235Å per pixel around 4300Å. The resultant resolutions vary with wavelength. Typically we see resolutions in the range around H (4341Å) and around H (6563Å). With the 1200 gr/mm grating, dispersion is 0.54Å per pixel in between Å and Å, with the resolution varying between .
A log of observational data, including exposure times and signal-to-noise ratios (SNR) is provided in Table 1. HD 46487 was first observed as a telluric standard for another project, so only a single spectrum was acquired on the first night. Flatfield, dark current, bias, and neon-argon lamp images are observed every night. The gain and read noise are computed using the bias and flatfield images; gain is 1.5 ADU and read noise is 13.1 pixel. Dark current and bias are removed from the science images, and they are then divided by the normalized flatfield. All data reduction and spectral extraction is performed in PYTHON using the author’s own routines.
| Table 1. HD 46487 Observations Data | |||||
| MJD | Disp. | Range | Exp | sec Z | SNR |
| (Å/pix) | (Å) | (sec) | |||
| 57826.10 | 0.168 | 6380-6722 | 1800 | 1.3 | 196 |
| 57827.05 | 0.168 | 6380-6722 | 1800 | 1.2 | 151 |
| 57827.10 | 0.235 | 4182-4673 | 1800 | 1.3 | 339 |
| 57827.14 | 0.543 | 3820-4942 | 900 | 1.4 | 304 |
The reduced science images are collapsed in the wavelength direction, and the star’s dispersion is fit with a Gaussian to determine an extraction center and width. The spectrum is then extracted between 2 of the Gaussian’s center, rounded out to the nearest pixel. The pixels on either side of the spectrum’s extraction window are used to compute a local sky value that is then subtracted away from the star’s spectrum, removing any background. Wavelength values are determined using known lines from the neon-argon lamp spectrum. The SNR is computed at every pixel using the CCD equation from Merline & Howell (1995), and are then propagated to compute errors at every wavelength value in the spectrum.
3 Analysis
3.1 Disk emission
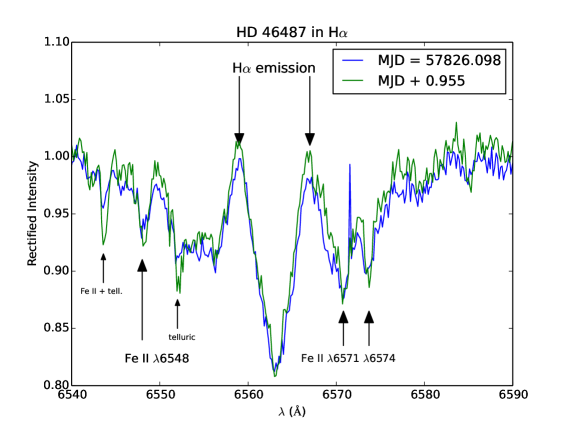
The H spectrum of HD 46487 is shown in Figure 1, as it was observed on the nights of 13 and 14 March, 2017. There are noticeable differences between the two spectra. The telluric absorption features are substantially stronger in the second observation. The hydrogen emission is markedly more pronounced as well. Variations in emission strength on the order of days is not uncommon for B stars, particularly during a phase of disk build-up (e.g., Rivinius et al., 2013, and references therein).
The peak separation in the H emission is 7.9Å, which translates to an orbital speed of 180 km/s. If we take 290 km/s as a rough average of the available literature values (see Section 1 above), then according to Huang’s Law (Huang, 1972):
| (1) |
where is the emission peak separation, then the H line-emitting radius is 19 .
3.2 Spectral typing
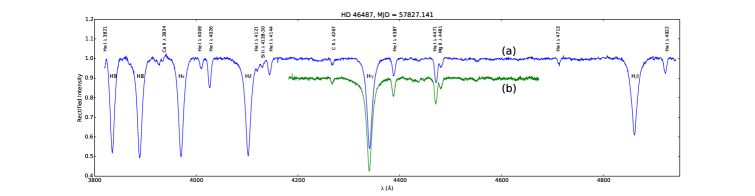
The optical spectrum of HD 46487 in the wavelength range 3820Å - 4950Å is shown in Figure 2 at two resolutions. The strengths of the He i lines, the presence of Si ii , its strength relative to He i , and the He i /Mg ii ratio all confirm a spectral type of B5. The lines are very broad, suggesting that this is a main sequence star, and that the “nebular” designation is justified. We conclude that the spectral type based on visual inspection is B5 Vn, and that emission is not evident in the optical spectrum.
We measured the equivalent widths for the helium and metal absorption lines observed in the optical spectra. Results are given in Table 2, along with plane-parallel model predictions from Frémat et al. (2006) for comparison. Most notably, all of the line equivalent widths would suggest an earlier spectral type than what is visually observed.
| Table 2. Equivalent Width Measurements | ||||
|---|---|---|---|---|
| Line ID | Equivalent Widths (mÅ) | |||
| Low-resaafootnotemark: | Med-resbbfootnotemark: | B2Vccfootnotemark: | B5Vccfootnotemark: | |
| He i | – | 613 | 217 | |
| He i | – | 1541 | 878 | |
| He i | – | 765 | 322 | |
| C ii | 270 | 97 | ||
| He i | 950 | 378 | ||
| He i | 1442 | 667 | ||
| Mg ii | 198 | 272 | ||
| a Data taken with the 1200 gr/mm dispersion grating. | ||||
| b Data taken with the 2400 gr/mm dispersion grating. | ||||
| c Model values from Frémat et al.(2006). | ||||
3.3 The spectral energy distribution
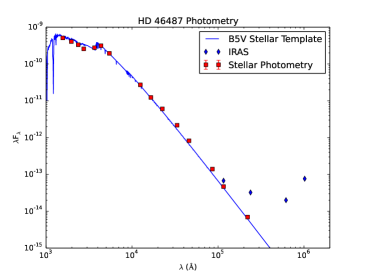
The spectral energy distribution (SED) from ultraviolet to infrared is plotted against a B5 V stellar template in Figure 3. The stellar template is taken from Castelli & Kurucz (2003). Data points were collected using VizieR and sources include Thompson et al. (1978) for the ultraviolet, Crawford, et al. (1971) and Høg et al. (2000) for the optical, and the 2MASS survey (Skrutskie et al., 2006), the WISE Survey (Wright et al., 2010), the AKARI All-Sky Survey (Ishihara et al., 2010), and the IRAS survey (Neugebauer et al., 1984) for the infrared. The IRAS data points suffer from a very large point spread function () and it is no surprise that they contain emission from nearby interstellar gas; this is the source of the discrepancy between the IRAS and WISE data points. There is no evidence of dust emission around HD 46487, and out to 22 µm, there is no substantial deviation from the stellar Rayleigh-Jeans tail.
4 Discussion
The H line-emitting radius is calculated to be 19 R∗, as discussed in Section 3.1. This is consistent with the average H line-emitting radii for B stars in Hanuschik (1988) and in Slettebak, et al. (1992), which quote R∗ and R∗ respectively.
The spectral type determined upon visual inspection should be treated with skepticism. Fast-rotating stars bulge at the equator, which both increases their surface area and creates a gradient in surface temperature from equator to pole. As a result, fast-rotating stars have higher luminosities and lower average surface temperatures (i.e., later spectral types) than their slow-rotating counterparts (Gray & Corbally, 2009). There is also the effect of rotation on the perceived depths of the absorption lines themselves. Fast rotation will broaden the helium and metal absorption lines, so that they appear shallower than they would for another star of the same spectral type. These broadening effects are, in some cases, asymmetric, as is the case with the Mg ii line, which is intrinsically narrower than the He i line. The Mg ii /He i line ratio is one of several used in spectral typing for which intrinsic line width differences can be an issue. Since issues related to rapid rotation affect our perception of a star’s intrinsic spectral type, some work has been done to spectral type fast-rotating stars (e.g., Garrison & Gray, 1994). At this time, however, there exist no fast-rotating spectroscopic standards earlier than B7 in the literature that can be used for visual comparisons.
The spectral type inferred from equivalent width measurements can also be problematic for B stars. Continuum emission originating within the disk can partially fill in the absorption lines in a process known as line damping. This means that a B star’s actual spectral type will be earlier than that measured. This is in addition to the effects of scattered light from within the spectrograph itself, which will also fill in absorption signatures. Since the equivalent width measurements in Table 2 already suggest that the spectral type is earlier than what is inferred from visual inspection, we may consider line damping and scattered light as exaggerating effects, and can confidently conclude that HD 46487 has an earlier spectral type (B4 or B3) than is determined from visual inspection.
Pre-main sequence stars such as Herbig B stars exhibit hydrogen line emission due to a circumstellar disk just like classical B stars (Herbig, 1960). They should additionally possess a broad infrared excess due to circumstellar free-free emission (which is expected for classical B stars as well; Gehrz et al., 1974) and thermally-radiating dust (Malfait et al., 1998). Indeed, McDonald et al. (2012) found 1 magnitude of infrared excess for HD 46487 out to 22 . As illustrated in Figure 3, we cannot confirm such a large infrared excess, and what little infrared excess is seen is certainly not due to dust emission. HD 46487 is therefore not a pre-main sequence source, and what infrared excess exists is most likely due to circumstellar gaseous material and/or winds that would be responsible for free-free emission.
Due to the recent IGRINS and TS23 spectra of HD 46487 published in Gullikson et al. (2016a), we can state that HD 46487 was observed to be a normal main sequence B-type star as late as March 2015. All of the data used to compile the SED in Figure 3 was published earlier than 2013. It was additionally used in 2013 as a calibrator for interferometric observations in Br (Ellerbroek et al., 2015), an unsatisfactory choice had it exhibited a substantial gaseous circumstellar disk. It therefore seems likely that the B phenomenon became evident no earlier than March 2015.
5 Conclusion
HD 46487 (V) makes an excellent target for small aperture telescopes. Now that it exhibits the B phenomenon, we should expect it to vary like other B stars: with periodic photometric variability, the occasional small outburst, and variations in its line emission on timescales anywhere from hours to years. There are three specific areas that will be most useful for continued studies of this source.
-
•
Spectroscopic observations of H. Such observations would be useful to track the changing line emission, whether it be due to small outbursts and resultant pockets of gas rotating within the disk, or else long-scale global one-armed oscillations. Spectra submitted to BeSS (as we plan to do) would then be available to the entire community of B star observers.
-
•
Photometric observations at optical wavelengths. Such observations may be useful for tracking periodicity, which is common in B star atmospheres, and may also be useful for catching outbursts.
-
•
Near-infrared photometric observations. Most B stars show an infrared excess due to free-free emission. Now that HD 46487 exhibits the B phenomenon, we expect to see this change mostly to its near-infrared SED.
We recognize the need for collaboration on these observations. Interested parties are encouraged to contact the authors.
References
- Abt et al. (1990) Abt, H. A., Gomez, A. E., & Levy, S. G. 1990, Astrophys. J. Suppl., 74, 551.
- Abt, et al. (2002) Abt, H. A., Levato, H., & Grosso, M. 2002, Astrophys. J., 573, 359.
- Auvergne et al. (2009) Auvergne, M., et al. 2009, Astron. & Astrophys., 506, 411.
- Castelli & Kurucz (2003) Castelli, F., & Kurucz, R. L. 2003, IAU Symp. Np. 210, poster A20.
- Chojnowski et al. (2015) Chojnowski, S. D., Whelan, D. G., Wisniewski, J. P., et al. 2015, Astron. J., 149, 7.
- Chojnowski et al. (2017) Chojnowski, S. D., Wisniewski, J. P., Whelan, D. G., Labadie-Bartz, J., Borges Fernandes, M., Chien-Cheng, L., Majewski, S. R., Stringfellow, G. S., Mennickent, R. E., Roman-Lopes, A., Tang, B., Hearty, F. R., Holtzman, J. A., Pepper, J., & Zasowski, G. 2017, Astrophys. J., 153, 174.
- Crawford, et al. (1971) Crawford, D. L., Barnes, J. V., & Golson, J. C. 1971, Astron. J., 76, 1058.
- Eggleton & Tokovinin (2008) Eggleton, P. P., & Tokovinin, A. A. 2008, Mon. Not. Roy. Astron. Soc., 389, 869.
- Ellerbroek et al. (2015) Ellerbroek, L. E., Benisty, M., Kraus, S., Perraut, K., Kluska, J., le Bouquin, J. B., Borges Fernandes, M., Domiciano de Souza, A., Maaskant, K. M., Kaper, L., Tramper, F., Mourard, D., Tallon-Bosc, I., ten Brymmelaar, T., Sitko, M. L., Lynch, D. K., & Russell, R. W. 2015, Astron. & Astrophys., 573, 77.
- Frémat et al. (2006) Frémat, Y., Neiner, C., Hubert, A.-M., Floquet, M., Zorec, J., Janot-Pacheco, E., & Renan de Medeiros, J. 2006, Astron. & Astrophys., 451, 1053.
- Garrison & Gray (1994) Garrison, R. F., Gray, R. O. 1994, Astrophys. J., 107, 1556.
- Gehrz et al. (1974) Gehrz, R. D., Jackwell, J. A., & Jones, T. W. 1974, Astrophys. J., 191, 675.
- Gray & Corbally (2009) Gray, R. O., & Corbally, C. J. Stellar Spectral Classification. Princeton: Princeton University Press, 2009.
- Gullikson et al. (2016a) Gullikson, K., Kraus, A., Dodson-Robinson, S., Jaffe, D., Lee, J.-E., Mace, G. N., MacQueen, P., Park, S., & Riddle, A. 2016, Astron. J., 151, 3.
- Gullikson et al. (2016b) Gullikson, K., Kraus, A., & Dodson-Robinson, S. 2016, Astron. J., 152, 40.
- Hanuschik (1988) Hanuschik, R. W. 1988, Astron. & Astrophys., 190, 187.
- Herbig (1960) Herbig, G. H. 1960, Astrophys. J. Suppl., 4, 337.
- Høg et al. (2000) Høg, E., Fabricius, C., Makarov, V. V., Urban, S., Corbin, T., Wycoff, G., Bastian, U., Schwekendiek, P., & Wicenec, A. 2000, Astron. & Astrophys., 355, 27.
- Huang (1972) Huang, S.-S. 1972, Astrophys. J., 171, 549.
- Huang et al. (2010) Huang, W., Gies, D. R., & McSwain, M. V. 2010, Astrophys. J., 722, 605.
- Ishihara et al. (2010) Ishihara, D., Onaka, T., Kataza, H., et al. 2010, Astron. & Astrophys., 514, 1.
- Jo et al. (2016) Jo, Y.-S., Seon, K.-I., Min, K.-W., Choi, Y.-J., Lim, T.-H., Lim, Y.-M., Edelstein, J., & Han, W. 2016, Mon. Not. Roy. Astron. Soc., 456, 417.
- Labadie-Bartz et al. (2017) Labadie-Bartz, J., Pepper, J., McSwain, M. V., Bjorkman, J. E., Bjorkman, K. S., Lund, M. B., Rodriguez, J. E., Stassun, K. G., Stevens, D. J., James, D. J., Kuhn, R. B., Siverd, R. J., & Beatty, T. G. 2017, Astron. J, 153, 252.
- Lefever et al. (2010) Lefever, K., Puls, J., Morel, T., Aerta, C., Devin, L., & Briquet, M. 2010, Astron. & Astrophys., 515, 74.
- Malfait et al. (1998) Malfait, K., Bogaert, E., & Waelkens, C. 1998, Astron. & Astrophys., 331, 211.
- McDonald et al. (2012) McDonald, I., Zijlstra, A. A., & Boyer, M. L. 2012, Mon. Not. Roy. Astron. Soc., 427, 343.
- McSwain & Gies (2005) McSwain, M. V., & Gies, D. R. 2005, Astrophys. J. Suppl., 161, 118.
- McSwain et al. (2009) McSwain, M. V., Huang, W., & Gies, D. R. 2009, Astrophys. J., 700, 1216.
- Merline & Howell (1995) Merline, W. J., & Howell, S. B. 1995, ExA, 6, 163.
- de Mink et al. (2013) de Mink, S. E., Langer, N., Izzard, R. G., Sana, H., & de Koter, A. 2013, Astrophys. J., 764, 166.
- Neiner et al. (2005) Neiner, C., Hubert, A.-M., & Catala, C. 2005, Astrophys. J. Suppl., 156, 237.
- Neiner et al. (2011) Neiner, C., de Batz, B., Cochard, F., Floquet, M., Mekkas, A., & Desnoux, V. 2011, Astron. J., 142, 149.
- Neugebauer et al. (1984) Neugebauer, G., et al. 1984, Astrophys. J., 278, 1.
- Okazaki (1991) Okazaki, A. T. 1991, Publ. Astron. Soc. Japan, 43, 75.
- Park et al. (2014) Park, C., Jaffe, D. T., Yuk, I.-S., et al. 2014, SPIE, 9147, 1.
- Porter & Rivinius (2003) Porter, J. M., & Rivinius, Th. 2003, Publ. Astron. Soc. Pacific, 115, 1153.
- Rivinius (2013) Rivinius, Th. 2013, ASSP, 31, 253.
- Rivinius et al. (2013) Rivinius, Th., Carciofi, A. C., & Martayan, C. 2013, Ann. Rev. Astron. & Astrophys., 21, 69.
- Rountree & Sonneborn (1991) Rountree, J., & Sonneborn, G. 1991, Astrophys. J., 369, 515.
- Skrutskie et al. (2006) Skrutskie, M. F., Cutri, R. M., Stiening, R., et al. 2006, Astron. J., 131, 1163.
- Slettebak, et al. (1992) Slettebak, A., Collisn, G. W., & Truax, R. 1992, Astrophys. J. Suppl., 81, 335.
- Thompson et al. (1978) Thompson, G. I., Nandy, K., Jamar, C., Monfils, A., Houziaux, L., Carnochan, D. J., & Wilson, R. 1978, Liège University.
- Townsend et al. (2004) Townsend, R. H. D., Owocki, S. P., & Howarth, I. D. 2004, Mon. Not. Roy. Astron. Soc., 350, 189.
- Wright et al. (2010) Wright, E. L., Eisenhardt, P. R. M., Mainzer, A. K., et al. 2010, Astron. J., 140, 1868.