Deep Investigation of Cross-Language Plagiarism Detection Methods
Abstract
This paper is a deep investigation of cross-language plagiarism detection methods on a new recently introduced open dataset, which contains parallel and comparable collections of documents with multiple characteristics (different genres, languages and sizes of texts). We investigate cross-language plagiarism detection methods for 6 language pairs on 2 granularities of text units in order to draw robust conclusions on the best methods while deeply analyzing correlations across document styles and languages.
1 Introduction
Plagiarism is a very significant problem nowadays, specifically in higher education institutions. In monolingual context, this problem is rather well treated by several recent researches Potthast et al. (2014). Nevertheless, the expansion of the Internet, which facilitates access to documents throughout the world and to increasingly efficient (freely available) machine translation tools, helps to spread cross-language plagiarism. Cross-language plagiarism means plagiarism by translation, i.e. a text has been plagiarized while being translated (manually or automatically). The challenge in detecting this kind of plagiarism is that the suspicious document is no longer in the same language of its source. In this relatively new field of research, no systematic evaluation of the main methods, on several language pairs, for different text granularities and for different text genres, has been proposed yet. This is what we propose in this paper.
Contribution. The paper focus is on cross-language semantic textual similarity detection which is the main part (with source retrieval) in cross-language plagiarism detection. The evaluation dataset used Ferrero et al. (2016) allows us to run a large amount of experiments and analyses. To our knowledge, this is the first time that full potential of such a diverse dataset is used for benchmarking. So, the paper main contribution is a systematic evaluation of cross-language similarity detection methods (using in plagiarism detection) on different languages, sizes and genres of texts through a reproducible evaluation protocol. Robust conclusions are derived on the best methods while deeply analyzing correlations across document styles and languages. Due to space limitations, we only provide a subset of our experiments in the paper while more result tables and correlation analyses are provided as supplementary material on a Web link111https://github.com/FerreroJeremy/Cross-Language-Dataset/tree/master/study.
Outline. After presenting the dataset used for our study in section 2, and reviewing the state-of-the-art methods of cross-language plagiarism detection that we evaluate in section 3, we describe the evaluation protocol employed in section 4. Then, section 5.1 presents the correlation of the methods across language pairs, while section 5.2 presents a detailed analysis on only English-French pair. Finally, section 6 concludes this work and gives a few perspectives.
2 Dataset
The reference dataset used during our study is the new dataset222https://github.com/FerreroJeremy/Cross-Language-Dataset recently introduced by Ferrero et al. (2016). The dataset was specially designed for a rigorous evaluation of cross-language textual similarity detection. The different characteristics of the dataset are synthesized in Table 1, while Table 2 presents the number of aligned units by sub-corpus and by granularity.
| Sub-corpus | Alignment | Authors | Translations | Obfuscation | NE (%) |
|---|---|---|---|---|---|
| JRC-Acquis | Parallel | Politicians | Professional translators | No | 3.74 |
| Europarl | Parallel | Politicians | Professional translators | No | 7.74 |
| Wikipedia | Comparable | Average people | - | Noise | 8.37 |
| PAN (Gutenberg Project) | Parallel | Professional authors | Professional authors | Yes | 3.24 |
| Amazon Product Reviews | Parallel | Average people | Google Translate | Noise | 6.04 |
| Conference papers | Comparable | NLP scientists | NLP scientists | Noise | 9.36 |
| Sub-corpus | Languages | # Documents | # Sentences | # Noun chunks |
|---|---|---|---|---|
| JRC-Acquis | EN, FR, ES | 10,000 | 150,000 | 10,000 |
| Europarl | EN, FR, ES | 10,000 | 475,000 | 25,600 |
| Wikipedia | EN, FR, ES | 10,000 | 5,000 | 150 |
| PAN (Gutenberg Project) | EN, ES | 3,000 | 90,000 | 1,400 |
| Amazon Product Reviews | EN, FR | 6,000 | 23,000 | 2,600 |
| Conference papers | EN, FR | 35 | 1,300 | 300 |
More precisely, the characteristics of the dataset are the following:
-
•
it is multilingual: it contains French, English and Spanish texts;
-
•
it proposes cross-language alignment information at different granularities: document level, sentence level and chunk level;
-
•
it is based on both parallel and comparable corpora (mix of Wikipedia, scientific conference papers, amazon product reviews, Europarl and JRC);
-
•
it contains both human and machine translated texts;
-
•
it contains different percentages of named entities;
-
•
part of it has been obfuscated (to make the cross-language similarity detection more complicated) while the rest remains without noise;
-
•
the documents were written and translated by multiple types of authors (from average to professionals);
-
•
it covers various fields.
3 Overview of State-of-the-Art Methods
Textual similarity detection methods are not exactly methods to detect plagiarism.
Plagiarism is a statement that someone copied text deliberately without attribution, while these methods only detect textual similarities.
There is no way of knowing why texts are similar and thus to assimilate these similarities to plagiarism.
At the moment, there are five classes of approaches for cross-language plagiarism detection.
The aim of each method is to estimate if two textual units in different languages express the same message or not.
Figure 1 presents a taxonomy of Potthast et al. (2011), enriched by the study of Danilova (2013), of the different cross-language plagiarism detection methods grouped by class of approaches.
We only describe below the state-of-the-art methods that we evaluate in the paper, one for each class of approaches (those in bold in the Figure 1).
for tree= grow=east, parent anchor=south east, child anchor=south west, align=center, l sep+=50pt, edge path= [draw, rounded corners=0pt, \forestoptionedge] (!u.parent anchor) [out=0, in=180] to (.child anchor)\forestoptionedge label – (.south east); , for root= ellipse, draw, parent anchor=east, , [ [MT-Based Models
Translation + Monolingual Analysis Muhr et al. (2010)] [Comparable Corpora-Based Models
CL-KGA, CL-ESA Potthast et al. (2008)] [Parallel Corpora-Based Models
CL-ASA Pinto et al. (2009), CL-LSI, CL-KCCA] [Dictionary-Based Models
CL-VSM, CL-CTS Pataki (2012)] [Syntax-Based Models
Cross-Language Character N-Gram (CL-CG)
is based on Mcnamee and Mayfield (2004) model. We use the CL-C3G Potthast et al. (2011)’s implementation. Only spaces and alphanumeric characters are kept. Any other diacritic or symbol is deleted and the texts are lower-cased. The texts are then segmented into -grams (sequences of 3 contiguous characters) and transformed into tf.idf vectors of character -grams. The metric used to compare two vectors is the cosine similarity.
Cross-Language Conceptual Thesaurus-based Similarity (CL-CTS)
aims to measure the semantic similarity using abstract concepts from words in textual units. We reuse the idea of Pataki (2012) which, for each sentence, build a bag-of-words by getting all the available translations of each word of the sentence. For that, we use a linked lexical resource called DBNary Sérasset (2015). The bag-of-words of a sentence is the merge of the bag-of-words of the words of the sentence. After, we use the Jaccard distance (Jaccard, 1912) with fuzzy matching between two bag-of-words to measure the similarity between two sentences.
Cross-Language Alignment-based Similarity Analysis (CL-ASA)
was introduced for the first time by Barrón-Cedeño et al. (2008) and developed subsequently by Pinto et al. (2009). The model aims to determinate how a textual unit is potentially the translation of another textual unit using bilingual unigram dictionary which contains translations pairs (and their probabilities) extracted from a parallel corpus. Our lexical dictionary is calculated applying the IBM-1 model Brown et al. (1993) on the concatenation of TED555https://wit3.fbk.eu/ Cettolo et al. (2012) and News666http://www.statmt.org/wmt13/translation-task.html#download parallel corpora. We reuse the implementation of Pinto et al. (2009) that proposed a formula that factored the alignment function.
Cross-Language Explicit Semantic Analysis (CL-ESA)
is based on the explicit semantic analysis model introduced for the first time by Gabrilovich and Markovitch (2007), which represents the meaning of a document by a vector based on the vocabulary derived from Wikipedia, to find a document within a corpus. It was reused by Potthast et al. (2008) in the context of cross-language document retrieval. Our implementation uses a part of Wikipedia, from which our test data was removed, to build the vector representations of the texts.
Translation + Monolingual Analysis (T+MA)
consists in translating suspect plagiarized text back into the same language of source text, in order to operate a monolingual comparison between them.
We use the Muhr et al. (2010)’s implementation which consists in replacing each word of one text by its most likely translations in the language of the other text, leading to a bags-of-words.
We use DBNary Sérasset (2015) to get the translations.
The metric used to compare two texts is a monolingual matching based on strict intersection of bags-of-words.
More recently, SemEval-2016 Agirre et al. (2016) proposed a new subtask on evaluation of cross-lingual semantic textual similarity.
Despite the fact that it was the first year that this subtask was attempted, there were 26 submissions from 10 teams.
Most of the submissions relied on a machine translation step followed by a monolingual semantic similarity, but 4 teams tried to use learned vector representations (on words or sentences) combined with machine translation confidence (for instance the submission of Lo et al. (2016) or Ataman et al. (2016)).
The method that achieved the best performance Brychcin and Svoboda (2016) was a supervised system built on a word alignment-based method proposed by Sultan et al. (2015).
This very recent method is, however, not evaluated in this paper.
| Chunk level | ||||||
|---|---|---|---|---|---|---|
| Methods | ENFR | FREN | ENES | ESEN | ESFR | FRES |
| CL-C3G | 0.5071 | 0.5071 | 0.4375 | 0.4375 | 0.4795 | 0.4795 |
| CL-CTS | 0.4250 | 04116 | 0.3780 | 0.3881 | 0.4203 | 0.4169 |
| CL-ASA | 0.4738 | 0.4252 | 0.4083 | 0.3941 | 0.3736 | 0.3540 |
| CL-ESA | 0.1499 | 0.1499 | 0.1476 | 0.1476 | 0.1520 | 0.1520 |
| T+MA | 0.3730 | 0.3634 | 0.3177 | 0.3279 | 0.3158 | 0.3140 |
| Sentence level | ||||||
| Methods | ENFR | FREN | ENES | ESEN | ESFR | FRES |
| CL-C3G | 0.4931 | 0.4931 | 0.3819 | 0.3819 | 0.4577 | 0.4577 |
| CL-CTS | 0.4734 | 0.4633 | 0.3171 | 0.3204 | 0.4645 | 0.4575 |
| CL-ASA | 0.3576 | 0.3523 | 0.2694 | 0.2531 | 0.3098 | 0.2843 |
| CL-ESA | 0.1430 | 0.1430 | 0.1337 | 0.1337 | 0.1383 | 0.1383 |
| T+MA | 0.3760 | 0.3692 | 0.3505 | 0.3526 | 0.3673 | 0.3525 |
| Chunk level | |||||||
|---|---|---|---|---|---|---|---|
| ENFR | FREN | ENES | ESEN | ESFR | FRES | Overall | Lang. Pair |
| 1.000 | 0.991 | 0.998 | 0.995 | 0.957 | 0.940 | 0.980 | ENFR |
| 1.000 | 0.990 | 0.994 | 0.980 | 0.971 | 0.987 | FREN | |
| 1.000 | 0.996 | 0.967 | 0.949 | 0.983 | ENES | ||
| 1.000 | 0.978 | 0.965 | 0.988 | ESEN | |||
| 1.000 | 0.998 | 0.980 | ESFR | ||||
| 1.000 | 0.970 | FRES | |||||
| Sentence level | |||||||
| ENFR | FREN | ENES | ESEN | ESFR | FRES | Overall | Lang. Pair |
| 1.000 | 1.000 | 0.929 | 0.922 | 0.991 | 0.982 | 0.971 | ENFR |
| 1.000 | 0.931 | 0.924 | 0.989 | 0.981 | 0.971 | FREN | |
| 1.000 | 0.997 | 0.925 | 0.913 | 0.949 | ENES | ||
| 1.000 | 0.928 | 0.922 | 0.949 | ESEN | |||
| 1.000 | 0.997 | 0.971 | ESFR | ||||
| 1.000 | 0.966 | FRES | |||||
4 Evaluation Protocol
We apply the same evaluation protocol as in Ferrero et al. (2016)’s paper. We build a distance matrix of size x , with = 1,000 and = where is the evaluated sub-corpus. Each textual unit of is compared to itself (actually, since this is cross-lingual similarity detection, each source language unit is compared to its corresponding unit in the target language) and to -1 other units randomly selected from . The same unit may be selected several times. Then, a matching score for each comparison performed is obtained, leading to the distance matrix. Thresholding on the matrix is applied to find the threshold giving the best score. The score is the harmonic mean of precision and recall. Precision is defined as the proportion of relevant matches (similar cross-language units) retrieved among all the matches retrieved. Recall is the proportion of relevant matches retrieved among all the relevant matches to retrieve. Each method is applied on each sub-corpus for chunk and sentence granularities. For each configuration (i.e. a particular method applied on a particular sub-corpus considering a particular granularity), 10 folds are carried out by changing the selected units.
5 Investigation of Cross-Language Similarity Performances
5.1 Across Language Pairs
Table 3 brings together the performances of all methods on all sub-corpora for each pair of languages at chunk and sentence level. In both sub-tables, at chunk and sentence level, the overall score over all sub-corpora of one method in one particular language pair is given.
As a preliminary remark, one should note that CL-C3G and CL-ESA lead to the same results for a given language pair (same performance if we reverse source and target languages) due to their symmetrical property. Another remark we can make is that methods are consistent across language pairs: best performing methods are mostly the same, whatever the language pair considered. This is confirmed by the calculation of the Pearson correlation between performances of different pairs of languages, from Table 3 and reported in Table 4. Table 4 represents the Pearson correlations between the different language pairs of the overall results of all methods on all sub-corpora. This result is interesting because some of these methods depend on the availability of lexical resources whose quality is heterogeneous across languages. Despite the variation of the source and target languages, a minimum Pearson correlation of 0.940 for ENFR vs. FRES, and a maximum of 0.998 for ENFR vs. ENES and ESFR vs. FRES at chunk level is observed (see Table 4). For the sentence granularity, it is the same order of magnitude: the maximum Pearson correlation is 0.997 for ESEN vs. ENES and ESFR vs. FRES, and the minimum is 0.913 for ENES vs. FRES (see Table 4). In average the language pair ENFR is 0.975 correlated with the other language pairs (0.980 at chunk-level and 0.971 at sentence-level), for instance. This correlation suggests the possibility to tune a method on one language and apply it to another language if needed.
Table 5 synthesizes the top 3 methods for each language pair observed in Tables 3 and 4. No matter the source and target languages or the granularity, CL-C3G generally outperforms the other methods. Then CL-ASA, CL-CTS and T+MA are also closely efficient but their behavior depends on the granularity. Generally, CL-ASA is better at the chunk granularity, followed by CL-CTS and T+MA. On the contrary, CL-CTS and T+MA are slightly more effective at sentence granularity. One explanation for this is that T+MA depends on the quality of machine translation, which may have poor performance on isolated chunks, while a short length text unit benefits the CL-CTS and CL-ASA methods because of their formula which will tend to minimize the number of false positives in this case. Anyway, despite these differences in ranking, the gap in term of performance values is small between these closest methods. For instance, we can see that when CL-CTS is more efficient than CL-C3G (ESFR column at sentence level in Table 3 and Table 5 (b)), the difference of performance is very small (0.0068).
| ENFR | ESFR |
| ENES | |
| CL-C3G | CL-C3G |
| CL-ASA | CL-CTS |
| CL-CTS | CL-ASA |
| ENFR | ENES | ESFR |
|---|---|---|
| FRES | ||
| CL-C3G | CL-C3G | CL-CTS |
| CL-CTS | T+MA | CL-C3G |
| T+MA | CL-CTS | T+MA |
| Lang. Pair | Correlation |
|---|---|
| ENFR | 0.907 |
| FREN | 0.946 |
| ENES | 0.833 |
| ESEN | 0.838 |
| ESFR | 0.932 |
| FRES | 0.939 |
| Methods | Correlation |
|---|---|
| CL-C3G | 0.996 |
| CL-CTS | 0.970 |
| CL-ASA | 0.649 |
| CL-ESA | 0.515 |
| T+MA | 0.780 |
| Chunk level | ||||||
|---|---|---|---|---|---|---|
| Methods | Wikipedia (%) | TALN (%) | JRC (%) | APR (%) | Europarl (%) | Overall (%) |
| CL-C3G | 62.91 0.815 | 40.90 0.500 | 36.63 0.826 | 80.30 0.703 | 53.29 0.583 | 50.71 0.655 |
| CL-CTS | 58.00 0.519 | 33.71 0.382 | 29.87 0.815 | 67.51 1.050 | 44.95 1.157 | 42.50 1.053 |
| CL-ASA | 23.33 0.724 | 23.39 0.432 | 33.14 0.936 | 26.49 1.205 | 55.50 0.681 | 47.38 0.781 |
| CL-ESA | 64.89 0.664 | 23.78 0.613 | 14.03 0.997 | 23.14 0.777 | 14.19 0.590 | 14.99 0.709 |
| T+MA | 58.22 0.756 | 39.13 0.551 | 28.61 0.597 | 73.14 0.666 | 36.95 1.502 | 37.30 1.200 |
| Sentence level | ||||||
| Methods | Wikipedia (%) | TALN (%) | JRC (%) | APR (%) | Europarl (%) | Overall (%) |
| CL-C3G | 48.25 0.349 | 48.08 0.538 | 36.68 0.693 | 61.10 0.581 | 52.72 0.866 | 49.31 0.798 |
| CL-CTS | 46.68 0.437 | 38.67 0.552 | 28.21 0.612 | 50.82 1.034 | 53.21 0.601 | 47.34 0.632 |
| CL-ASA | 27.63 0.330 | 27.25 0.341 | 35.17 0.644 | 25.53 0.795 | 36.55 1.139 | 35.76 0.978 |
| CL-ESA | 51.14 0.875 | 14.25 0.334 | 14.44 0.341 | 13.93 0.714 | 13.91 0.618 | 14.30 0.551 |
| T+MA | 50.57 0.888 | 37.79 0.364 | 32.36 0.369 | 61.94 0.756 | 37.92 0.552 | 37.60 0.518 |
Table 6 shows the Pearson correlations of the results (of all methods on all sub-corpora) by language pair between the chunk and the sentence granularity (correlations calculated from Table 3, between the ENFR column at chunk level with the ENFR column at sentence level, and so on). We can see a strong Pearson correlation of the performances on the language pair between the chunk and the sentence granularity (an average of 0.9, with 0.907 for the ENFR pair, for instance). This proves that all methods behave along a similar trend at chunk and at sentence level, regardless of the languages on which they are used. However, we can see in Table 7 that if we collect correlation scores separately for each method (on all sub-corpora, on all language pairs) between chunk and sentence granularity performances (correlations also calculated from Table 3, between the CL-C3G line at chunk level with the CL-C3G line at sentence level, and so on), we notice that some methods exhibit a different behavior at both chunk and sentence granularities: for instance, this is the case for CL-ASA which seems to be really better at chunk level. In conclusion, we can say that the methods presented here may behave slightly differently depending on the text unit considered (chunk or sentence) but they behave practically the same no matter the languages of the compared texts are (as long as enough lexical resources are available for dealing with these languages).
5.2 Detailed Analysis for English-French
The previous sub-section has shown a consistent behavior of methods across language pairs (strongly consistent) and granularities (less strongly consistent). For this reason, we now propose a detailed analysis for different sub-corpora, for the English-French language pair - at chunk and sentence level - only. Providing these results for all language pairs and granularities would take too much space. Moreover, we also run those state-of-the-art methods on the dataset of the Spanish-English cross-lingual Semantic Textual Similarity task of SemEval-2016 Agirre et al. (2016) and SemEval-2017 Cer et al. (2017), and propose a shallower but equally rigorous analysis. However, all those results are also made available as supplementary material on our paper Web page.
Table 8 shows the performances of methods on the ENFR sub-corpora. As mentioned earlier, CL-C3G is in general the most effective method. CL-ESA seems to show better results on comparable corpora, like Wikipedia. In contrast, CL-ASA obtains better results on parallel corpora such as JRC or Europarl collections. CL-CTS and T+MA are pretty efficient and versatile too. It is also interesting to note that the results of the methods are well correlated between certain types of sub-corpora. For instance, the Pearson correlation of the performances of all methods between the TALN sub-corpus and the APR sub-corpus, is 0.982 at the chunk level, and 0.937 at the sentence level. This means that a method could be optimized on a particular corpus (for instance APR) and applied efficiently on another corpus (for instance TALN which is made of scientific conference papers).
Beyond their capacity to correctly predict a (mis)match, an interesting feature of the methods is their clustering capacity, i.e. their ability to correctly separate the positives (cross-lingual semantic textual similar units) and the negatives (textual units with different meaning) in order to minimize the doubts on the classification. To verify this phenomenon, we conducted another experience with a new protocol. We built a data subset by concatenating some documents of the previously presented dataset Ferrero et al. (2016). More precisely we used 200 pairs of each sub-corpora at sentence level only. We compared 1000 English textual units to their corresponding unit in French, and to one other (not relevant) French unit. So, each English textual unit must strictly leads to one match and one mismatch, i.e. in the end, we have exactly 1000 matches and 1000 mismatches for a run. We repeat this experiment 10 times for each method, leading to 10 folds for each method.
| Methods | T | P | R | |
|---|---|---|---|---|
| Random baseline | 0.003 | 0.501 | 0.999 | 0.668 |
| Length Model | 0.203 | 0.566 | 0.970 | 0.714 |
| CL-C3G | 0.087 | 0.972 | 0.953 | 0.962 |
| CL-CTS | 0.010 | 0.986 | 0.808 | 0.888 |
| CL-ASA | 0.762 | 0.937 | 0.772 | 0.847 |
| T+MA | 0.157 | 0.928 | 0.646 | 0.762 |
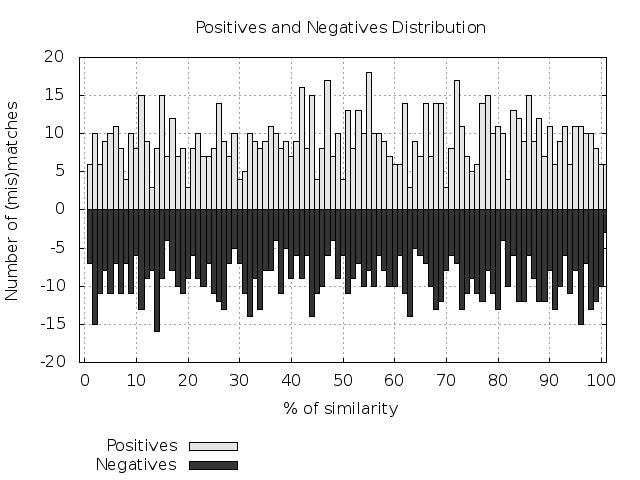
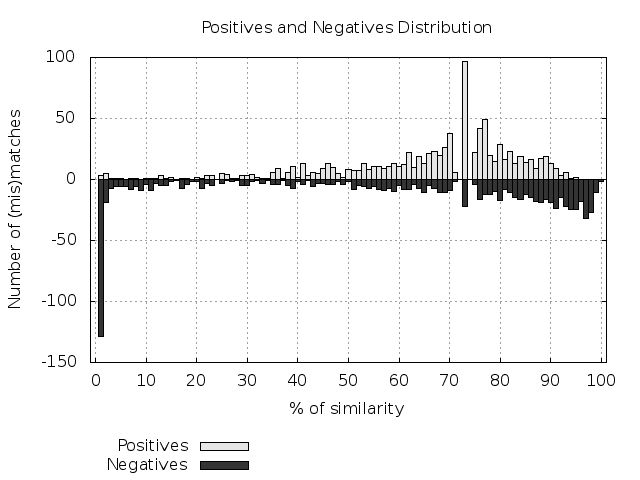
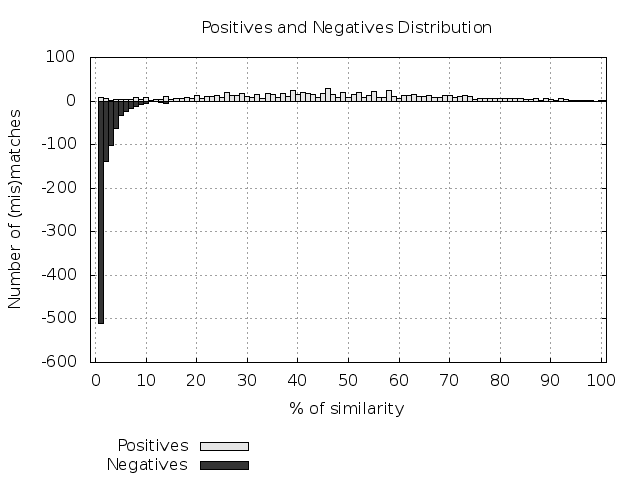
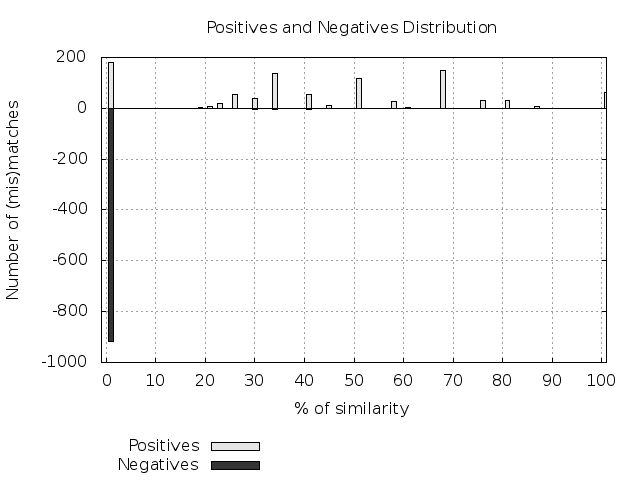
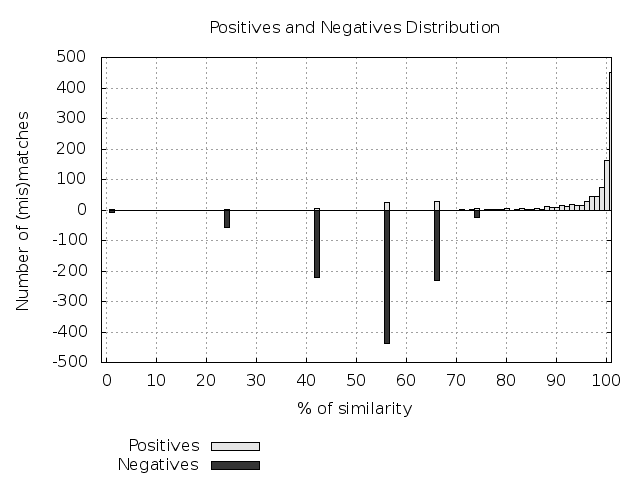
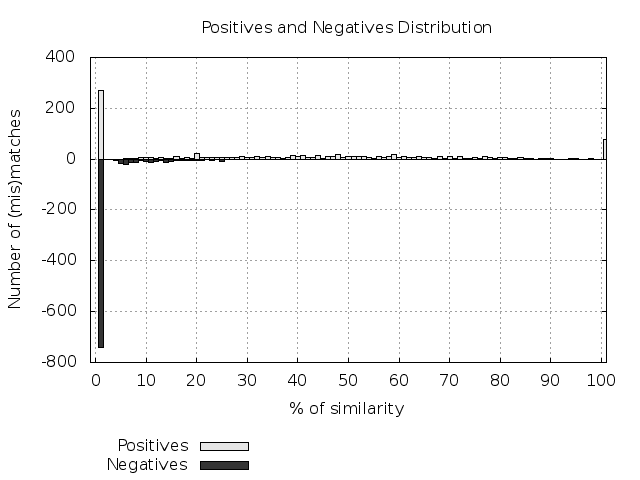
The results of this experiment are reported on Table 9, that shows the average for the 10 folds of the Precision (P), the Recall (R) and the score of some state-of-the-art methods, reached at a certain threshold (T). The results are also reported in Figure 2, in the form of distribution histograms of the evaluated methods for 1000 positives and 1000 negatives (mis)matches. X-axis represents the similarity score (in percentage) computed by the method, and Y-axis represents the number of (mis)matches found for a given similarity score. In white, in the upper part of the figures, the positives (units that needed to be matched), and in black, in the lower part, the negatives (units that should not be matched).
Distribution histograms on Figure 2 highlights the fact that each method has its own fingerprint: even if two methods looks equivalent in term of performances (see Table 9), their clustering capacity, and so the distribution of their (mis)matches can be different. For instance, we can see that a random distribution is a very bad distribution (Figure 2 (a)). We can also see that CL-C3G has a narrow distribution of negatives and a broad distribution for positives (Figure 2 (c)), whereas the opposite is true for CL-ASA (Figure 2 (e)). Table 9 confirms this phenomenon by the fact that the decision threshold is very different for CL-ASA (0.762) compared to the other methods (around 0.1). This means that CL-ASA discriminates more correctly the positives that the negatives, when it seems to be the opposite for the other methods. For this reason, we can make the assumption that some methods are complementary, due to their different fingerprint. These behaviors suggest that fusion between these methods (notably decision tree based fusion) should lead to very promising results.
6 Conclusion
We conducted a deep investigation of cross-language plagiarism detection methods on a challenging dataset. Our results have shown a common behavior of methods across different language pairs. We revealed strong correlations across languages but also across text units considered. This means that when a method is more effective than another on a sufficiently large dataset, it is generally more effective in any other case. This also means that if a method is efficient on a particular language pair, it will be similarly efficient on another language pair as long as enough lexical resources are available for these languages.
We also investigated the behavior of the methods through the different types of texts on a particular language pair: English-French. We revealed strong correlations across types of texts. This means that a method could be optimized on a particular corpus and applied efficiently on another corpus.
Finally, we have shown that methods behave differently in clustering match and mismatched units, even if they seem similar in performance. This opens new possibilities for their combination or fusion.
More results supporting these facts are provided as supplementary material777https://github.com/FerreroJeremy/Cross-Language-Dataset/tree/master/study.
References
- Agirre et al. (2016) Eneko Agirre, Carmen Banea, Daniel Cer, Mona Diab, Aitor Gonzalez-Agirre, Rada Mihalcea, and Janyce Wiebe. 2016. SemEval-2016 Task 1: Semantic Textual Similarity, Monolingual and Cross-Lingual Evaluation. In Proceedings of the 10th International Workshop on Semantic Evaluation (SemEval 2016). San Diego, CA, USA, pages 497–511. http://www.aclweb.org/anthology/S16-1081.
- Ataman et al. (2016) Duygu Ataman, Jose G. C. de Souza, Marco Turchi, and Matteo Negri. 2016. FBK HLT-MT at SemEval-2016 Task 1: Cross-lingual semantic similarity measurement using quality estimation features and compositional bilingual word embeddings. In Proceedings of the 10th International Workshop on Semantic Evaluation (SemEval 2016). San Diego, CA, USA, pages 570–576. https://www.aclweb.org/anthology/S/S16/S16-1086.pdf.
- Barrón-Cedeño et al. (2008) Alberto Barrón-Cedeño, Paolo Rosso, David Pinto, and Alfons Juan. 2008. On Cross-lingual Plagiarism Analysis using a Statistical Model. In Benno Stein and Efstathios Stamatatos and Moshe Koppel, editor, Proceedings of the ECAI’08 PAN Workshop: Uncovering Plagiarism, Authorship and Social Software Misuse. Patras, Greece, pages 9–13.
- Brown et al. (1993) Peter F. Brown, Vincent J. Della Pietra, Stephen A. Della Pietra, and Robert L. Mercer. 1993. The Mathematics of Statistical Machine Translation: Parameter Estimation. Computational Linguistics 19(2):263–311. http://www.aclweb.org/anthology/J93-2003.
- Brychcin and Svoboda (2016) Tomas Brychcin and Lukas Svoboda. 2016. UWB at SemEval-2016 Task 1: Semantic textual similarity using lexical, syntactic, and semantic information. In Proceedings of the 10th International Workshop on Semantic Evaluation (SemEval 2016). San Diego, CA, USA, pages 588–594. https://www.aclweb.org/anthology/S/S16/S16-1089.pdf.
- Cer et al. (2017) Daniel Cer, Mona Diab, Eneko Agirre, Inigo Lopez-Gazpio, and Lucia Specia. 2017. Semeval-2017 task 1: Semantic textual similarity multilingual and crosslingual focused evaluation. In Proceedings of the 11th International Workshop on Semantic Evaluation (SemEval-2017). Association for Computational Linguistics, Vancouver, Canada, pages 1–14. http://www.aclweb.org/anthology/S17-2001.
- Cettolo et al. (2012) Mauro Cettolo, Christian Girardi, and Marcello Federico. 2012. Wit3: Web inventory of transcribed and translated talks. In Proceedings of the 16th Conference of the European Association for Machine Translation (EAMT). pages 261–268.
- Danilova (2013) Vera Danilova. 2013. Cross-Language Plagiarism Detection Methods. In Galia Angelova, Kalina Bontcheva, and Ruslan Mitkov, editors, Proceedings of the Student Research Workshop associated with RANLP 2013. Hissar, Bulgaria, Recent Advances in Natural Language Processing, pages 51–57. http://aclweb.org/anthology/R/R13/R13-2008.pdf.
- Ferrero et al. (2016) Jérémy Ferrero, Frédéric Agnès, Laurent Besacier, and Didier Schwab. 2016. A Multilingual, Multi-style and Multi-granularity Dataset for Cross-language Textual Similarity Detection. In Proceedings of the Tenth International Conference on Language Resources and Evaluation (LREC’16). European Language Resources Association (ELRA), Portoroz, Slovenia, pages 4162–4169. ISLRN: 723-785-513-738-2. http://islrn.org/resources/723-785-513-738-2/.
- Gabrilovich and Markovitch (2007) Evgeniy Gabrilovich and Shaul Markovitch. 2007. Computing Semantic Relatedness using Wikipedia-based Explicit Semantic Analysis. In Proceedings of the 20th International Joint Conference on Artifical Intelligence (IJCAI’07). Morgan Kaufmann Publishers Inc., Hyderabad, India, pages 1606–1611.
- Jaccard (1912) Paul Jaccard. 1912. The distribution of the flora in the alpine zone. New Phytologist 11(2):37–50. https://doi.org/10.1111/j.1469-8137.1912.tb05611.x.
- Lo et al. (2016) Chi-kiu Lo, Cyril Goutte, and Michel Simard. 2016. CNRC at SemEval-2016 Task 1: Experiments in crosslingual semantic textual similarity. In Proceedings of the 10th International Workshop on Semantic Evaluation (SemEval 2016). San Diego, CA, USA, pages 668–673. http://www.aclweb.org/anthology/S/S16/S16-1102.pdf.
- Mcnamee and Mayfield (2004) Paul Mcnamee and James Mayfield. 2004. Character N-Gram Tokenization for European Language Text Retrieval. Information Retrieval Proceedings 7(1-2):73–97.
- Muhr et al. (2010) Markus Muhr, Roman Kern, Mario Zechner, and Michael Granitzer. 2010. External and Intrinsic Plagiarism Detection Using a Cross-Lingual Retrieval and Segmentation System - Lab Report for PAN at CLEF 2010. In Martin Braschler, Donna Harman, and Emanuele Pianta, editors, CLEF Notebook. Padua, Italy.
- Pataki (2012) Màté Pataki. 2012. A New Approach for Searching Translated Plagiarism. In Proceedings of the 5th International Plagiarism Conference. Newcastle, UK, pages 49–64.
- Pinto et al. (2009) David Pinto, Jorge Civera, Alfons Juan, Paolo Rosso, and Alberto Barrón-Cedeño. 2009. A Statistical Approach to Crosslingual Natural Language Tasks. Journal of Algorithms 64(1):51–60. https://doi.org/10.1016/j.jalgor.2009.02.005.
- Potthast et al. (2011) Martin Potthast, Alberto Barrón-Cedeño, Benno Stein, and Paolo Rosso. 2011. Cross-Language Plagiarism Detection. Language Resources and Evaluation 45(1):45–62. https://doi.org/10.1007/s10579-009-9114-z.
- Potthast et al. (2014) Martin Potthast, Matthias Hagen, Anna Beyer, Matthias Busse, Martin Tippmann, Paolo Rosso, and Benno Stein. 2014. Overview of the 6th International Competition on Plagiarism Detection. In PAN at CLEF 2014. Sheffield, UK, pages 845–876.
- Potthast et al. (2008) Martin Potthast, Benno Stein, and Maik Anderka. 2008. A Wikipedia-Based Multilingual Retrieval Model. In 30th European Conference on IR Research (ECIR’08). Springer, Glasgow, Scotland, volume 4956 of LNCS of Lecture Notes in Computer Science, pages 522–530.
- Pouliquen et al. (2003) Bruno Pouliquen, Ralf Steinberger, and Camelia Ignat. 2003. Automatic Identification of Document Translations in Large Multilingual Document Collections. In Proceedings of the International Conference Recent Advances in Natural Language Processing (RANLP’03). Borovets, Bulgaria, pages 401–408.
- Sérasset (2015) Gilles Sérasset. 2015. DBnary: Wiktionary as a Lemon-Based Multilingual Lexical Resource in RDF. Semantic Web Journal (special issue on Multilingual Linked Open Data) 6(4):355–361. https://doi.org/10.3233/SW-140147.
- Sultan et al. (2015) Md Arafat Sultan, Steven Bethard, and Tamara Sumner. 2015. DLS@CU: Sentence similarity from word alignment and semantic vector composition. In Proceedings of the 9th International Workshop on Semantic Evaluation (SemEval 2015). Denver, CO, USA, pages 148–153. http://www.aclweb.org/anthology/S15-2027.