∎
22email: jari.hyvaluoma@luke.fi 33institutetext: Sampo Kulju 44institutetext: Natural Resources Institute Finland (Luke), FI-31600 Jokioinen, Finland 55institutetext: Markus Hannula 66institutetext: BioMediTech Institute and Faculty of Biomedical Sciences and Engineering, Tampere University of Technology, Tampere, Finland 77institutetext: Hanne Wikberg 88institutetext: VTT Technical Research Centre of Finland Ltd., P.O.Box 1000, FI-02044 VTT, Finland 99institutetext: Anssi Källi 1010institutetext: VTT Technical Research Centre of Finland Ltd., P.O.Box 1000, FI-02044 VTT, Finland 1111institutetext: Kimmo Rasa 1212institutetext: Natural Resources Institute Finland (Luke), FI-31600 Jokioinen, Finland
Quantitative characterization of pore structure of several biochars with 3D imaging
Abstract
Pore space characteristics of biochars may vary depending on the used raw material and processing technology. Pore structure has significant effects on the water retention properties of biochar amended soils. In this work, several biochars were characterized with three-dimensional imaging and image analysis. X-ray computed microtomography was used to image biochars at resolution of 1.14 m and the obtained images were analysed for porosity, pore-size distribution, specific surface area and structural anisotropy. In addition, random walk simulations were used to relate structural anisotropy to diffusive transport. Image analysis showed that considerable part of the biochar volume consist of pores in size range relevant to hydrological processes and storage of plant available water. Porosity and pore-size distribution were found to depend on the biochar type and the structural anisotopy analysis showed that used raw material considerably affects the pore characteristics at micrometre scale. Therefore attention should be paid to raw material selection and quality in applications requiring optimized pore structure.
Keywords:
Biochar Soil amendment Pore structure Water retention X-ray tomography Image analysis1 Introduction
In recent years biochar application to soils has been widely promoted due to its positive influences on the soil structure and fertility, as well as the possibility to sequestrate carbon into soils. Biochar additions change both physical and chemical characteristics of soil and can thus affect soil functions in many ways. One of the most commonly claimed benefit of biochar use as soil amendment is improved water retention properties. While main part of the studies exploring biochar amendments have ensued in positive results, there are also some reports on minor or even negative impacts on the water retention properties and other soil functions (see, e.g., Mukherjee and Lal, (2014); Jeffery et al., (2015); Novak et al., (2016) and references therein).
Knowledge of the underlying mechanisms how biochars affect soil water retention is still incomplete (Jeffery et al.,, 2015). Biochar may influence water retention in direct or indirect way (Verheijen et al.,, 2010). According to the direct mechanism water is stored and held in the biochar pores. Biochars are typically multiscale porous materials containing a wide range of pore sizes. Direct mechanism has been questioned on basis that majority of porosity would be in the nanopore regime and thus the water stored in biochars not plant available (Verheijen et al.,, 2010). Recent studies suggest that while majority of biochar surface area is provided by nanopores, they only have a minor impact on the total porosity (Brewer et al.,, 2014; Gray et al.,, 2014).
The indirect mechanism suggest that interaction between soil and biochar alters the size, shape and arrangement of macro-aggregate pore system (Yu et al.,, 2016), which affect soil hydraulic properties. Indirect evidences, like changes in aggregate stability, address that biochar may contribute significantly on soil structural development, although mechanisms behind these interactions are still unclear.
It is likely that the actual influence of biochar additions on soil water retention is a combination of direct and indirect mechanisms, the latter being highly dependent on soil properties. In order to understand the mechanisms involved, there is a clear need for better characterization of biochar porosity at micrometre scale (Kinney et al.,, 2012).
Structural properties of biochars can vary significantly depending on feedstock, processing method and process conditions. For example, a number of lignocellulosic feedstock (e.g., wood-based materials, straw and other agricultural by-products), crop processing by-products, animal manure, and municipal or industrial organic wastes have been subjected to pyrolysis or hydrothermal carbonization (HTC) (Kambo and Dutta,, 2015) to produce biochars or hydrochars (for compactness hereinafter all chars are referred to as ‘biochars’). Beside the raw material selection and process type, various process parameters, most notably temperature, affect the biochar quality. In general, increase in processing temperature generates biochars with higher total porosity (Brewer et al.,, 2014).
X-ray tomography is a non-destructive three-dimensional (3D) imaging method, which together with image analysis provide means for characterization and quantification of porous media. Modern microtomography scanners enable imaging with micron and even sub-micron resolution whereby porous materials can be studied at scales relevant for soil hydraulic properties (Jeffery et al.,, 2015). In contrary, nanoscale pores important for chemical sorption are not visible in tomographic images. However, even in such applications larger pores are necessary as they provide rapid connections from external surfaces to micropores.
Studies using tomographic techniques in biochar characterization are still fairly rare. Bird et al., (2008) studied series of pyrolysed pine wood biochars at resolution of 21 m and analysed images for porosity, pore-size distribution and pore connectivity. Jones et al., (2015) imaged cotton hull biochars at 4 m resolution and determined porosity as a function of pyrolysis temperature. Conte and Nestle, (2015) imaged poplar biochar at 0.74 m resolution and Jeffery et al., (2015) hay biochar at 2.56 m resolution. Schnee et al., (2016) imaged wood and Miscanthus biochars at 5.67 m resolution and studied their potential as microbial habitat. Quin et al., (2014) studied oil mallee biochar and imaged soils amended by this biochar.
There are several alternative techniques which have been used in characterization of porous media (in the context of biochars, see, e.g., Baltrėnas et al., (2015); Rawal et al., (2016)). Scanning electron microscopy provides high-resolution information about the surface morphology but does not enable quantitative analysis of the 3D pore structure. Gas adsorption methods are widely used to determine surface area and pore-size distribution of biochars but they are not suitable for larger pore sizes relevant for soil amendments. Mercury intrusion porosimetry on the other hand can be used to determine pore-size distribution at micrometre scale. Feasibility of this method is decreased by the underlying assumptions which are used in interpretation of the results (Giesche,, 2006). These assumptions are not valid for many realistic materials. NMR cryoporosimetry determines the pore-size distribution by observing the depressed melting point of a confined frozen liquid. This method is suitable for pore diameters upto ca. 1 m, which excludes main part of the porosity relevant for water retention properties. Compared to these techniques, x-ray microtomography enables versatile characterization of pore space via image analysis and provides information about pores in size range important for soil amendment purposes.
In this article the pore characteristics of several biochars are studied. X-ray microtomography is used to reveal the internal structure of biochars and the pore space is quantified by image analysis. Accurate imaging at 1.14 m resolution provides information about pore sizes relevant to the water retention properties of biochars. Our objective is to characterize several biochars to find out how much variation there can be in the internal structure of different biochars. Biochars produced from realistic (i.e. heterogeneous) raw materials are used in this study, which allows observation of structural variation caused by material heterogeneity. Biochars produced by slow pyrolysis and HTC are included in this study. While our work is motivated by use of biochars as soil amendments in order to improve the water retention properties of soils, the results can be useful for other applications relying on transport, storage and sorption properties of biochars.
2 Materials and methods
2.1 Imaging
Zeiss Xradia MicroXCT-400 (Zeiss, Pleasanton, USA) device was used in the x-ray computed microtomography imaging. All samples were imaged similarly. A 20 objective was used with binning 2 that resulted in pixel size of 1.14 m. Projection angle was 360∘ with 1600 projections. Source voltage was 40 kV, source current 250 A, and exposure time 3 seconds. Filters were not used in the imaging. The reconstruction was done from the projections with Zeiss XMReconstructor software, which utilizes the filtered back projection algorithm. A kernel size of 0.7 was used in the smoothing filter.
2.2 Image processing
X-ray tomographic reconstruction gives a 3D grid representation of the x-ray attenuation coefficient of the imaged sample as a grey-scale image. In order to analyse the pore space of the sample, images were converted into a binary representation where sample is segmented into two classes, i.e., pore and solid voxels. This processing was done in several steps.
First a region of interest (ROI) was selected such that maximal volume of the sample was taken into the subsequent steps. The imaged biochar grains were small and in some cases single scan contained several distinct grains. Arbitrary shaped ROIs were allowed and they could also consist of several non-connected parts. Next the grey-scale image was filtered with a 3D median filter with radius 2.
Actual image segmentation was performed using a modified version of Otsu’s automatic global thresholding algorithm (Otsu, 1979). Otsu’s algorithm is based on assumption of bimodal grey-scale histogram so that image consists of two distinct components (object and background; here pores and solids). Segmentation threshold is selected to minimize the weighted sum of variances,
| (1) |
Above are weights and variances of the two classes ( = pores and = solids) for a given threshold value .
Segmentation results obtained by Otsu’s algorithm turned out to be unsatisfactory as the pore volume was exaggerated in the segmented image. Recently Hapca et al., (2013) introduced a new segmentation method which adds a pre-classification step to the standard Otsu’s algorithm. In their method voxels certainly belonging to solid class are first selected and Otsu’s algorithm is then applied to rest of the voxels. In practice Hapca and co-workers used original Otsu’s threshold as the preclassification threshold. This method was developed for soils which consist of several solid components with significantly varying density. The situation is quite different for biochar samples with much more homogeneous solid material density. Therefore it is not surprise that this method, in turn, underestimated the pore volume. We decided to use the average of the threshold values given by the standard Otsu method and the modified method by Hapca et al. in segmentation of our biochar images. The use of average threshold value led to segmentation which corresponded very well with manual segmentation using visually selected threshold value. While there is no theoretical basis for using this method, we nevertheless settled on the average threshold approach instead of manually selected threshold to ensure objectivity of the segmentation process for different samples thus avoiding operator-dependent bias in the results.
After segmentation, binary images were filtered with a majority filter (radius 2). Finally isolated solid objects with volume less than 1000 voxels were removed from the images. The resulting binary image was used in the actual image analyses with one exception; in anisotropy analyses (described below) the denoised grey-scale image was used.
2.3 Image analysis
Image analysis was performed to determine porosity, specific surface area, pore size distribution and degree of anisotropy of the imaged samples.
Porosity is the fraction of pore volume in the imaged sample and is simply obtained as quotient between the number of pore voxels and the total number of voxels in the ROI.
Specific surface area was calculated using a method based on Minkowski functionals (Vogel et al.,, 2010). Surface area is related to the second Minkowski functional and can be determined from the number of pore-to-solid transitions in the image. These transitions were counted within a basic cube by evaluating voxel configuration in such cube at every location in the sample. Specific surface area is obtained by determining the frequency of the 256 possible configurations and using classical stereological formula. Detailed description of the algorithm is given by Vogel et al., (2010).
Pore-size distributions were calculated using a method based on mathematical morphology (Horgan,, 1998). In mathematical morphology image is probed with a structuring element which is a small test set. Here, a sphere was used as the structuring element. The two basic morphological operations are erosion and dilation. Erosion of the set (in the present case all pore voxels) by the structuring element is
| (2) |
i.e., all centres of the structuring elements that are included in . Dilation of the set by is
| (3) |
i.e., all centres of which hit the set . Determination of the pore-size distribution is based on morphological opening. Opening of the set by is erosion followed by dilation,
| (4) |
Opening removes small pores from the pore space. Pore-size distribution is obtained by successive application of opening by structuring element of increasing radius (see, e.g., Hilpert et al. (2003)). Pore volume related to size range is difference between the pore volumes determined for pore space opened with structuring elements of radius and , i.e., the pore size distribution is defined as
| (5) |
where denotes volume of the set in the argument.
Structural anisotropy of biochars was estimated using a method based on the grey-scale gradient structure tensor (GST). This method has been used, e.g., in quantification of anisotropy of trabecular bones from x-ray tomography images (Tabor and Rokita,, 2007). Instead of using the binary image, GST was calculated from the denoised grey-scale image. GST analysis requires calculation of grey-level gradient at every voxel in the ROI, which was obtained by using Sobel’s gradient kernels of size (Pratt,, 2007). The components of GST are obtained from the grey-scale gradients as
| (6) |
where refers to th component of the grey-level gradient at voxel and summation runs over all image voxels included in the ROI. Principal directions are determined as the eigenvectors (, , ) of GST and enumerated according to the magnitude of the corresponding eigenvalues (). The degree of anisotopy is defined as ratio of the highest and lowest eigenvalue,
| (7) |
High values of indicate high structural anisotropy and values close to unity are obtained for isotropic materials. The eigenvector indicates the direction of elongated pores.
2.4 Random walk simulation
Random walk simulations provide simple method to connect structural characteristics of biochars to transport properties. Random walk was realized as discrete walk in a simple cubic lattice provided by the segmented 3D image. The method used here was simular to that described by Nakashima and Kamiya, (2007) and Promentilla et al., (2009).
In a random walk simulation, initial position of the walker is selected randomly from all pore voxels. At each time step walker moves to one of the six nearest neighbour voxels. The destination voxel is selected randomly, and if the destination is a solid voxel walker stays rest during that time step. Simulation continues until maximum number of time steps is exceeded or walker crosses the sample boundary. In this work, the number of time steps was limited to
From each simulation, displacement vector was calculated. Here is the position vector of the walker at the end of the simulation and is the initial position. Displacement vector was then tranformed to spherical coordinates (radial distance, azimuthal angle, polar angle).
For each geometry, random walk simulation was repeated times and the obtained (, ) distribution was compared to the first eigenvector of GST in order to connect results of the random walk simulations to the structural anisotropy analysis.
2.5 Biochars
Pyrolysis biochars were produced using batch type bench scale slow pyrolysis equipment (Fagernäs et al.,, 2015). The reactor was indirectly heated with an electric oven and temperature of the oven was controlled via a preset program to go through multiple steps. The maximum rate of temperature rise was 8∘C min-1. In the final temperature step the oven was kept at the selected carbonization temperature for 3 h in order to produce fully carbonized biochar. In this study carbonization temperatures of 375∘C and 475∘C were used.
Hydrothermal carbonization reactions were carried out in a 10 l Hastelloy C276 stirred autoclave reactor equipped with an electrical heater band, temperature control, digital and analog pressure indicator, internal water cooling coil, and PC controlled data logger. The process sequence consisted of reactor heat up to 260∘C (ca. 60 min), residence time of 6 h and a water cooling period before venting the residual pressure and opening the reactor.
The studied biochars, processing methods, and temperatures are listed in Table 1. Ash, carbon, oxygen, hydrogen and nitrogen content and pH of the biochars used in the study are given in Table 2. Loss of ignition at 550∘C was used to determine the ash content and pH was determined at 1:5 biochar to water ratio. Carbon, oxygen, hydrogen and nitrogen contents were determined using FLASH 2000 series analyzer. In all, biochars included samples of three materials (Scots pine bark, salix and coffee cake). Before imaging, biochar samples were grinded and sieved to obtain particle size fraction from 0.84 to 1.19 mm.
| Sample | Material | Process | Temperature [∘C] |
|---|---|---|---|
| SPB_P375 | Scots pine bark | Slow pyrolysis | 375 |
| SPB_P475 | Scots pine bark | Slow pyrolysis | 475 |
| SSRC_P475 | Salix (short rotation coppice) | Slow pyrolysis | 475 |
| SSRC_HTC260 | Salix (short rotation coppice) | HTC | 260 |
| CC_HTC260 | Coffee cake | HTC | 260 |
| Sample | Ash [%] | C [%] | O [%] | H [%] | pH |
|---|---|---|---|---|---|
| SPB_P375 | 4.4 | 76.4 | 16.3 | 3.8 | 8.0 |
| SPB_P475 | 4.6 | 83.7 | 9.3 | 3.0 | 8.4 |
| SSRC_P475 | 6.9 | 83.5 | 8.0 | 3.1 | 9.3 |
| SSRC_HTC260 | 0.7 | 72.5 | 20.9 | 5.3 | 5.1 |
| CC_HTC260 | 0.1 | 74.7 | 15.7 | 7.8 | 4.0 |
Since high resolution was used in the imaging, the sample size had to be very small due to the tradeoff between the sample size and imaging resolution. Sample size was in the sub-millimetre regime and one to three biochar grains were imaged of each material. Since materials were heterogeneous and their properties varied depending on several other factors, e.g., whether the imaged sample grain was from surface or core of the processed particle. The raw materials used in biochar production were also heterogeneous. For example the Scots pine bark samples contained in practice also sapwood xylem in addition to the actual bark. It is thus obvious that the results reported below do not represent the materials on a general level. The purpose here is to find out and highlight the differences and similarities of the pore characteristics of several biochars. While the heterogeneity of the materials complicates interpretation of the results, they represent realistic biochars used in practical applications.
3 Results and discussion
3.1 Visualizations
Visualizations of the imaged samples are shown in Figs. 1 and 2. For 3D visualizations, the image data was rotated in a way that tube-shaped pores were perpendicular to the cutting face. Visual inspection shows that there is lot of variation in the pore characteristics. The samples can be roughly divided into three groups. First group contains samples which have highly anisotropic structure consisting of parallel cylindrical pores with minimal number of lateral connections. Such pores result from the xylem structure of the wood-based raw material (see Figs. 1 b,d,e and 2 b). Samples in the second group have more randomly shaped and oriented pores (Fig. 2 a,c,d). Third group consist of two bark samples whose pore structure is an intermediate form of the two other groups (Fig. 1 a,c).
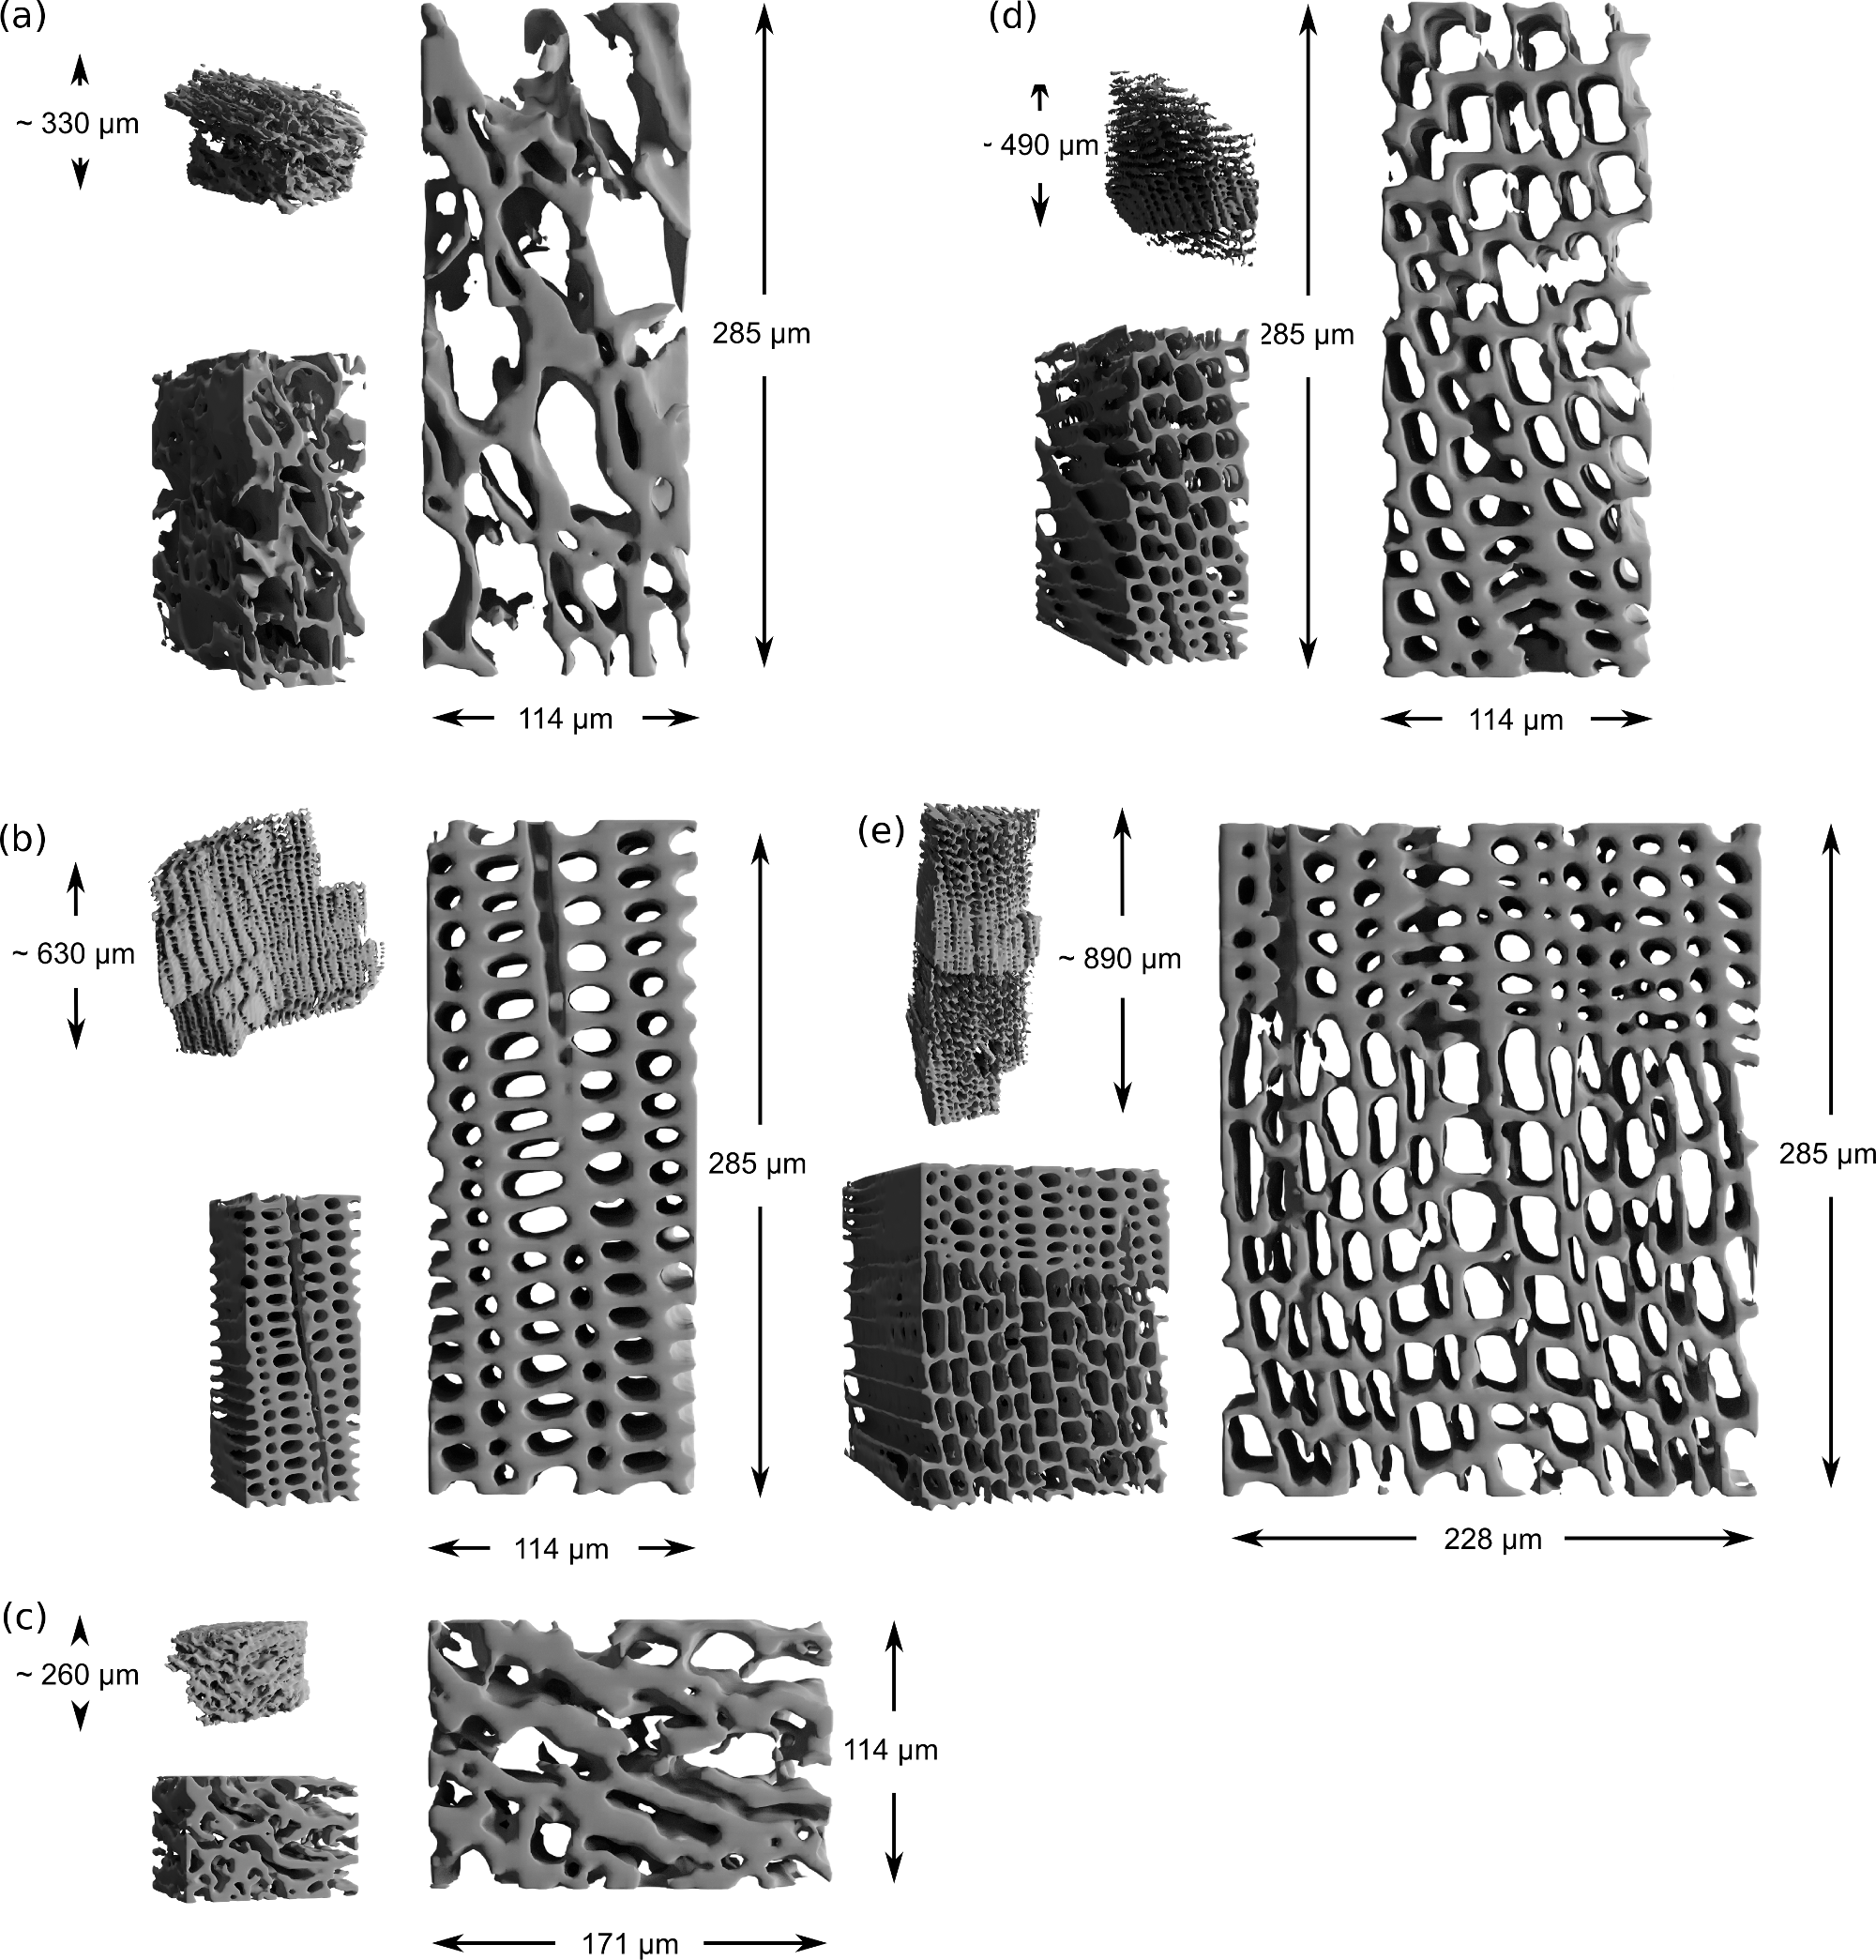
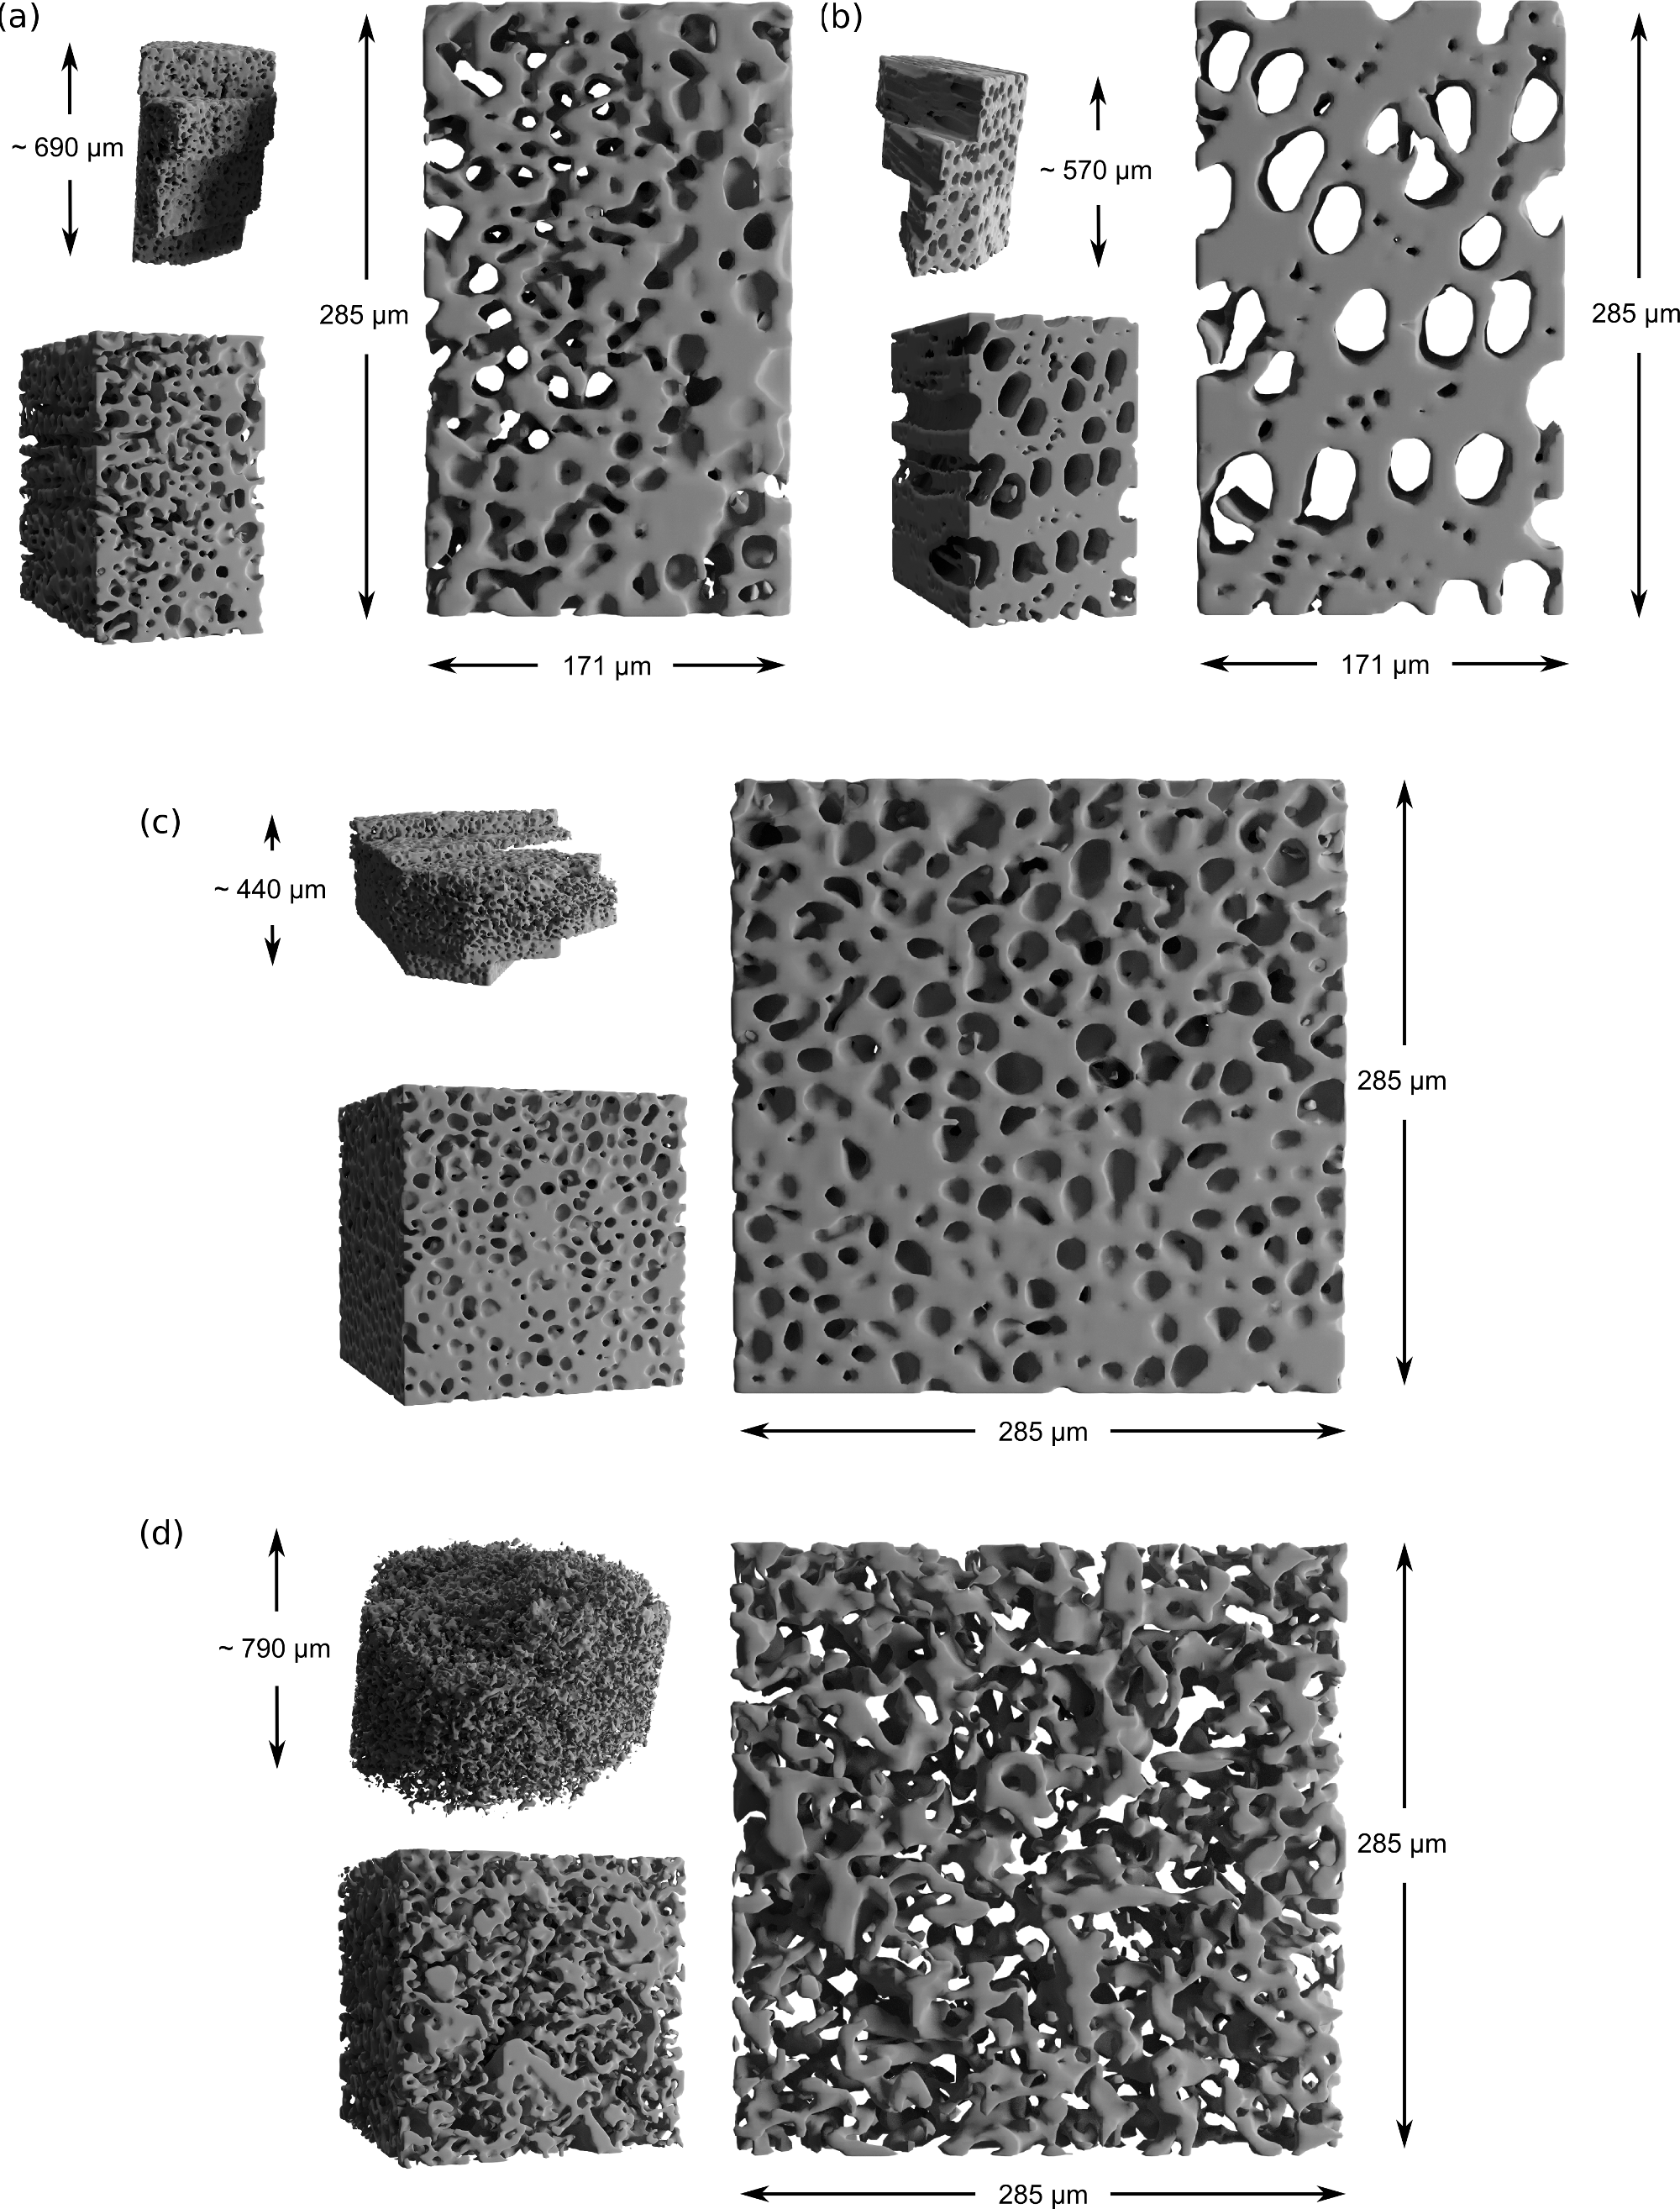
The observed differences result from different raw materials used to produce the biochars. The SSRC material was treated with two different technologies, slow pyrolysis and HTC, but the effect of used technology on the visual outlook of biochar is not clear. In Fig. 2 a and c, the partially similar visual appearance is obvious, but the pore structure of the pyrolysed SSRC sample (Fig. 2 b) is different from the HTC sample (Fig. 2 c). However, it is also important to notice that there can be clear differences between different sample grains originating from same material. For example, the Scots pine bark sample shown in Fig. 1b is evidently different that the two other bark samples pyrolysed in C (Fig. 1 a,c) even though the samples were taken from ostensibly same material. The differing sample obviously did not represent actual bark as it had clear xylem structure. Similarly both Scots pine bark samples pyrolysed in C also originated from sapwood rather than the actual bark layer. On the other hand, within sample variation due to nature of raw material is visible in Fig. 1 e, where spring and autumn season of annual growing ring result in different size of xylem structure.
On qualitative level there is significant variation in the structural properties of different biochars, whereby one might expect that these materials behave differently in applications where micron-scale porosity plays an important role. These observations indicate that raw material homogeneity and quality are important factors to be taken into account when biochars are considered for applications where properties of the pore structure are essential.
3.2 Image analyses
Image analysis results are collected in Table 3. Porosities of the samples varied between 0.34 and 0.68, i.e. the highest porosity was two-fold compared to the lowest one. Porosity determination based on imaging obviously takes into account only those pores that can be observed with the used imaging resolution. Thus the results do not contain sub-micron scale porosity which can be essential in some applications. However, the used resolution was able to account for most of the porosity essential for soil hydrological processes and plant growth. The image resolution approximately corresponds to pF value 3 if zero contact angle is assumed. As biochars are typically subcritically hydrophobic (Gray et al.,, 2014; Bubici et al,, 2016), the achievable pF value can in practice be somewhat lower. Pores in size range down to 100 nm, corresponding to pF values from 3 to 4.2, are too small to be observed in our tomographic images. Water stored in these pores is still considered plant available.
| Sample | Porosity [-] | MPD [m] | SSA [mm2/mm3] | [-] |
|---|---|---|---|---|
| SPB_P375 | ||||
| - A | 0.67 | 22.2 | 96.6 | 6.30 |
| - B | 0.44 | 12.4 | 124.8 | 33.7 |
| - C | 0.51 | 12.1 | 126.1 | 8.28 |
| SPB_P475 | ||||
| - A | 0.55 | 13.8 | 127.6 | 23.4 |
| - B | 0.60 | 16.2 | 123.5 | 23.1 |
| SSRC_P475 | ||||
| - A | 0.48 | 13.4 | 132.1 | 1.33 |
| - B | 0.34 | 19.6 | 87.1 | 21.5 |
| SSRC_HTC260 | ||||
| - A | 0.42 | 10.7 | 142.1 | 1.76 |
| CC_HTC260 | ||||
| - A | 0.68 | 13.0 | 126.5 | 1.28 |
Due to methodological differences, comparison of the observed porosities to those presented in literature is not straightforward. Jones et al., (2015) detected porosities between 0.23 and 0.27 for cotton hull pyrolysed at temperatures of 350, 500 and 800∘C using tomography with image resolution of 4 m. Gray et al., (2014) used pycnometry and measured porosities of 83-85 % and 63-69 % for douglas fir and hazelnut shell, respectively, pyrolysed at 370, 500 and 620∘C temperatures. In these studies, porosities measured for the same raw material pyrolysed in different temperatures showed relatively small variation, whereas porosities differed greatly with respect to raw material. Similarly, in the present work raw material and even within-sample variation seem to be factors determining the porosity. In addition, porosity of SSRC material was in the same range irrespectively of used processing technology.
Specific surface area varied from 87 to 142 mm2/mm3. It is interesting to observe that highest and lowest specific surface areas were not observed for samples with extreme porosity values and that two lowest specific surface area values were actually determined for samples with lowest and highest porosity. This observation reasserts the impression that there are significant differences in the pore-space characteristics of different biochars at the length scales visible in tomographic images. Specific surface area is strongly affected by the image resolution which limits the visibility of smaller pores and pore wall roughness. Thus specific surface area determined from tomographic images cannot be directly compared to those obtained by gas adsorption methods. On the other hand, gas adsorption analysis does not provide information about the pore-size regime essential for using biochars to improve soil water retention properties.
Pore-size distributions determined for imaged samples are shown in Fig. 3. The pore sizes are quite similar for most of the samples, and with one exception distributions have unimodal shape. One pine bark sample (SPB_P375_A) had clearly larger pores, which can be also observed visually in Fig. 1 a. The pore-size distribution of Scots pine bark sample SPB_P375_C is positively skewed and therefore these two samples differ from rest of the pine bark samples which do not present actual bark as already mentioned above.
Salix sample SSRC_P475_B had a bimodal pore size distribution, which is compatible with the visual observation (Fig. 2 b). Visual inspection also suggested similarities between the pyrolysed Salix sample in Fig. 2 a and Salix sample subjected to HTC treatment (Fig. 2 c). In line with that observation, pore size distributions of these two samples are almost similar and lack the bimodal structure found in Salix sample SSRC_P475_B. Once again, raw material quality seems to be key factor determining biochar pore system at micrometre scale. This finding also suggests that natural variation in the feedstock material sets limits for the extent that biochar properties can be optimized by process conditions.
The dominant pore diameter was in range 10-20 m which corresponds to pF values 2.2-2.5 (assuming zero contact angle). This pore-size regime contributes to water storage in soils, but is easily drained at dry periods allowing gas exchange between larger inter-particle pores and intra-particle pores of biochar. Thus, this pore-size regime can contribute actively to many chemical, physical and biological phenomena in soils. With respect to agricultural use of biochar, amendment with these biochars would increase the capacity of soil to store easily plant available water.
Degree of anisotropy gives a quantitative estimation of the preferential orientation of pores. This quantity clearly distinguishes the wood-based biochars from the coffee cake sample which had almost isotropic pore structure (). A clear variation among the Scots pine bark subsamples pyrolysed in is observed. Subsamples A and C had clearly lower degree of anisotropy than subsample B. The raw material used in production of biochar contained also wood material that had come off in the bark peeling and subsample B clearly represents such material (see Fig. 1 c). Also Scots pine bark sample pyrolysed in had high values. Results indicate that the increased pyrolysis temperature was not able to substantially increase the number of micron-scale connections between tracheids. For the wood-based biochars eigenvector of the GST was found to be parallel with the orientation of the xylem (data not shown, see also next section). Samples with xylem structure had highest values which confirms the visual observations. Thus can be considered as a good indicator for the anisotropy of the biochar structure.
No clear differences in the pore characteristics between the Scots pine bark samples pyrolysed in (SPB_P375) and (SPB_P475) could be observed. One could expect some pore development as temperature rises (see e.g. Shaaban et al., (2014)). However, recent imaging study by Jones et al., (2015) did not show signs of any clear temperature trends. This could indicate that rising temperature produces pores that are too small to be resolved with micrometre resolution. On the other hand, the observed heterogeneity of the used biochars would complicate observation of porosity development even if such would take place within the studied pore size range.
Either could we see any clear differences in the pore structures of the salix samples derived by slow pyrolysis (SSRC_P475) and HTC (SSRC_HTC260). Unfortunately also this comparison is difficult due to the raw material heterogeneity and more significant differences can be seen between the two pyrolysed subsamples. Some studies indicate that there are great difference between pyrochars and hydrochars but this difference is in the regime of small pore sizes not visible in microtomographic images (Eibisch et al.,, 2015).
3.3 Random walk simulations
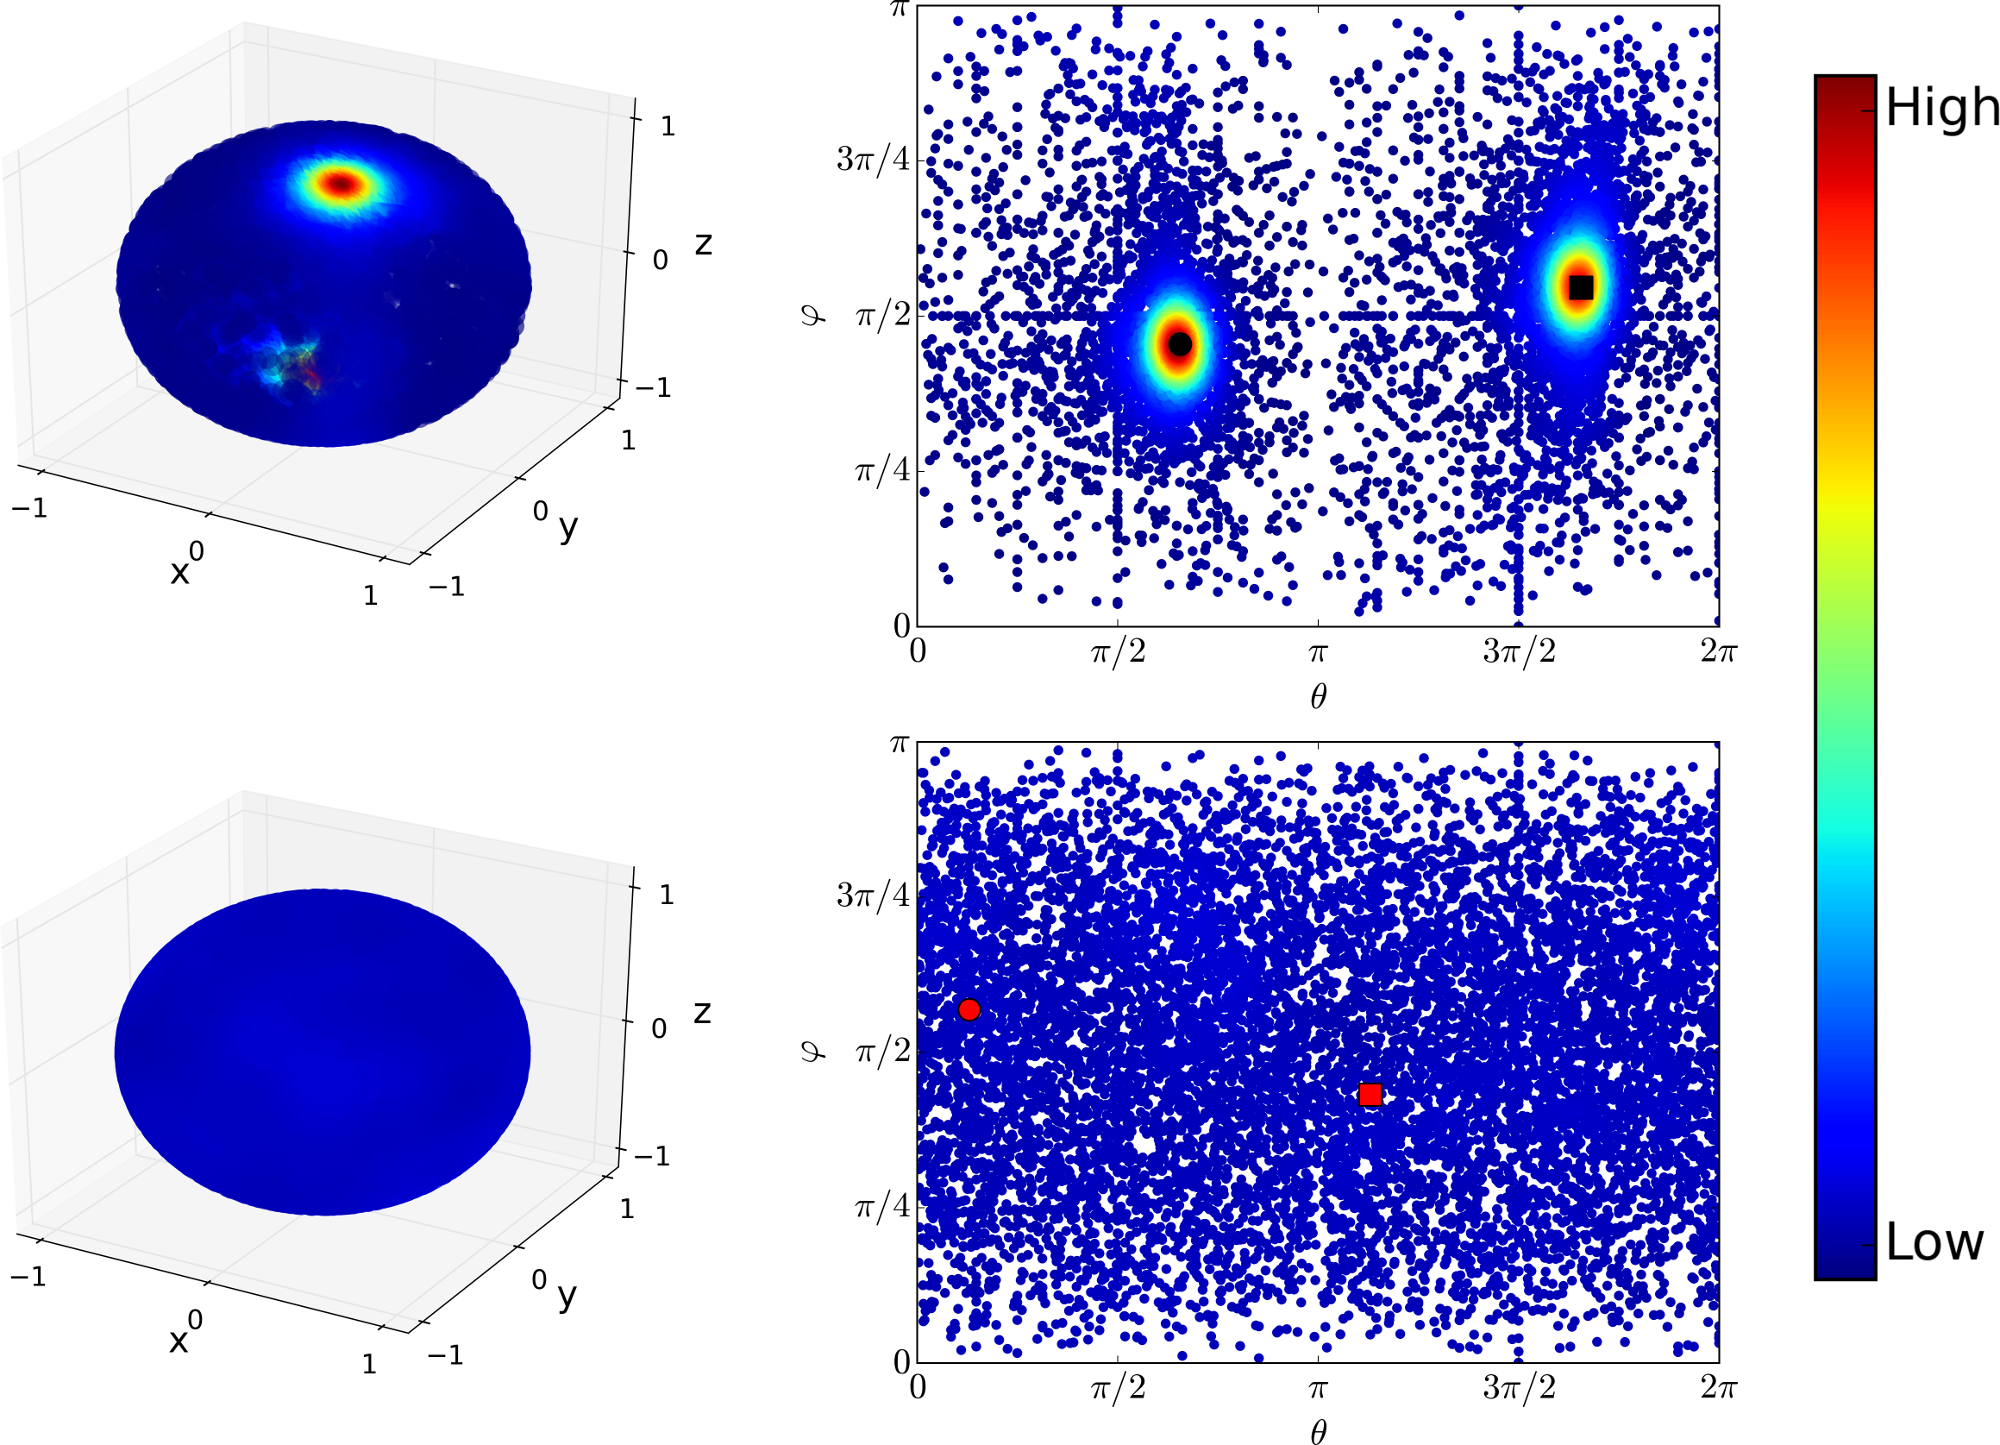
Random walk simulations confirmed the results of structural anisotropy analysis. Examples of simulation results are shown in Fig. 4, where results for SPB_P375_B and CC_HTC260 samples are shown. These two samples had highest and lowest value. In the figure, shown are the orientations of the normalized displacement vectors for all simulations performed for both samples. Colour coding shows the spatial density of the points. Results are notably different for these two materials. For the highly anisotropic sample (SPB_P375_B), displacement vectors almost exclusively follow the direction of eigenvector (or the opposite direction -). However, for the most isotropic sample CC_HTC260, all orientations of the displacement vectors are almost equally common as can be expected for such an isotropic material. Thus the results of GST analysis and random walk simulations are very consistent. Random walk simulation results for other samples were in line with these observations (data not shown). Simulations confirm that structural anisotropy observed in GST analysis affects the transport processes (here diffusion) as can be expected.
4 Conclusions
The reported results show that x-ray microtomography is a powerful method to characterize the pore structure of biochars. 3D images enable quantification of the pore structure by means of image analysis. Visualizations of the image data provide illustrative information about the pore structure and therefore helps to gain understanding about the factors causing the differences in the results of the image analysis. Thus combination of tomography, visualization techniques and image analyses provide a functional toolbox for biochar research.
However, feasibility of the methods is limited due to the large amount of work needed. The use of high image resolution limits the size of the imaged samples to sub-millimetre scale, which increases the required number of samples in the analyses. When the studied biochars are made of heterogeneous raw materials, it will be a real challenge to obtain reliable quantitative information of the pore characteristic representing whole material. Fortunately also results on single samples can be highly valuable and interesting even though they do not necessarily represent whole material. If the methods are used to analyse, e.g., influence of process methods or conditions on the pore structure, number of samples could be much smaller if homogeneous sample material is used.
Our results show that considerable fraction of biochar volume consists of pores in size classes relevant for storage of plant available water. Thus direct effects of biochars on soil water retention cannot be ruled out. Also the prevailing custom to characterize biochar pore space only with gas adsorption analyses is clearly insufficient, especially if biochar use aims to improve water retention and storage, or gas exchange in soils.
Acknowledgements.
This project has received funding from the European Union’s Horizon 2020 research and innovation programme under grant agreement No 637020 – MOBILE FLIP.References
- Baltrėnas et al., (2015) Baltrėnas P, Baltrėnaitė E, Spudulis E (2015) Biochar from Pine and Birch Morphology and Pore Structure Change by Treatment in Biofilter. Water Air Soil Pollut 226:69
- Bird et al., (2008) Bird MI, Ascough PL, Young IM, Wood CV, Scott AC (2008) X-ray microtomographic imaging of charcoal. J Archaeol Sci 35: 2698-2706
- Brewer et al., (2014) Brewer CE, Chuang VJ, Masiello CA, Gonnermann H, Gao X, Dugan B, Driver LE, Panzacchi P, Zygourakis K, Davies CA (2014) New approaches to measuring biochar density and porosity. Biomass Bioenerg 66: 176-185
- Bubici et al, (2016) Bubici S, Korb J-P, Kučerik J, Conte P (2016) Evaluation of the surface affinity of water in three biochars using fast field cycling NMR relaxometry. Magn Reson Chem 54: 365-370
- Conte and Nestle, (2015) Conte P, Nestle N (2015) Water dynamics in different biochar fractions. Magn Reson Chem 53: 726-734
- Eibisch et al., (2015) Eibisch N, Schroll R, FußR, Mikutta R, Helfrich M, Flessa H (2015) Pyrochars and hydrochars differently alter the sorption of the herbicide isoproturon in an agricultural soil. Chemosphere 119: 155-162
- Fagernäs et al., (2015) Fagernäs L, Kuoppala E, Arpiainen V (2015) Composition, utilization and economic assessment of torrefaction condensates. Energ Fuel 29: 3134-3142
- Giesche, (2006) Giesche H (2006) Mercury porosimetry: A general (practical) overview. Part. Part. Syst. Charact. 23: 9-19
- Gray et al., (2014) Gray M, Johnson MG, Dragila MI, Kleber M (2014) Water uptake in biochars: The roles of porosity and hydrophobicity. Biomass Bioenerg 61: 196-205
- Hapca et al., (2013) Hapca SM, Houston AN, Otten W, Baveye PC (2013) New Local Thresholding Method for Soil Images by Minimizing Grayscale Intra-Class Variance. Vadose Zone J 12. doi: 10.2136/vzj2012.0172
- Hilpert et al. (2003) Hilpert M, Glantz R, Miller CT (2003) Calibration of a pore-network model by a pore-morphological analysis. Transport Porous Med 51: 267-285
- Horgan, (1998) Horgan GW (1998) Mathematical morphology for analysing soil structure from images. Eur J Soil Sci 49: 161-173
- Jeffery et al., (2015) Jeffery S, Meinders MBJ, Stoof CR, Bezemer TM, van de Voorde TFJ, Mommer L, van Groenigen JW (2015) Biochar application does not improve the soil hydrological function of a sandy soil. Geoderma 251-252: 47-54
- Jones et al., (2015) Jones K, Ramakrishnan G, Uchimiya M, Orlov A (2015) New applications of X-ray tomography in pyrolysis of biomass: Biochar imaging. Energ Fuel 29: 1628-1634
- Kambo and Dutta, (2015) Kambo HS, Dutta A (2015) A comparative review of biochar and hydrochar in terms of production, physico-chemical properties and applications. Renew Sust Energ Rev 45: 359-378
- Kinney et al., (2012) Kinney TJ, Masiello CA, Dugan B, Hockaday WC, Dean MR, Zygourakis K, Barnes RT (2012) Hydrologic properties of biochar produced at different temperatures. Biomass Bioenerg 41: 34-43
- Mukherjee and Lal, (2014) Mukherjee A, Lal R (2014) The biochar dilemma. Soil Research 52: 217-230
- Nakashima and Kamiya, (2007) Nakashima Y, Kamiya S (2007) Mathematica programs for the analysis of three dimensional pore connectivity and anisotropic tortuosity of porous rocks using X ray computed tomography image data. J Nucl Sci Technol 44: 1233-1247
- Novak et al., (2016) Novak JM, Ippolito JA, Lentz RD, Spokas KA, Bolster CH, Sistani K, Trippe KM, Phillips CL, Johnson MG (2016) Soil health, crop productivity, microbial transport, and mine spoil response to biochars. Bioenergy Research 9: 454-464
- Otsu (1979) Otsu N (1979) A Threshold Selection Method from Gray-Level Histograms. IEEE T Syst Man Cyb 9: 62-66
- Pratt, (2007) Pratt WK (2007) Digital Image Processing, 4th ed., John Wiley & Sons, Hoboken, New Jersey
- Promentilla et al., (2009) Promentilla MAB, Sugiyama T, Hitomi T, Takeda N (2009) Quantification of tortuosity in hardened cement pastes using synchrotron-based X-ray computed tomography. Cement Concrete Res 39: 548-557
- Quin et al., (2014) Quin PR, Cowie AL, Flavel RJ, Keen BP, Macdonald LM, Morris SG, Singh BP, Young IM, Van Zwieten L (2014) Oil mallee biochar improves soil structural properties—A study with x-ray micro-CT. Agr Ecosyst Environ 191: 142-149
- Rawal et al., (2016) Rawal A, Joseph SD, Hook JM, Chia CH, Munroe PR, Donne S, Lin Y, Phelan D, Mitchell DRG, Pace B, Horvat J, Webber JBW (2016) Mineral-Biochar Composites: Molecular Structure and Porosity. Environ Sci Technol 50: 7706-7714
- Schnee et al., (2016) Schnee LS, Knauth S, Hapca S, Otten W, Eickhorst T (2016) Analysis of physical pore space characteristics of two pyrolytic biochars and potential as microhabitat. Plant Soil 408: 357-368
- Shaaban et al., (2014) Shaaban A, Se S-M, Dimin MF, Juoi JM, Husin MHM, Mitan NMM (2014) Influence of heating temperature and holding time on biochars derived from rubber wood sawdust via slow pyrolysis. J Anal Appl Pyrol 107: 31-39
- Tabor and Rokita, (2007) Tabor Z, Rokita E (2007) Quantifying anisotropy of trabecular bone from gray-level images. Bone 40: 966-972
- Verheijen et al., (2010) Verheijen FGA, Jeffery S, Bastos AC, van der Velde M, Diafas I (2010) Biochar Application to Soils - A Critical Scientific Review of Effects on Soil Properties, Processes and Functions, 149 pp (EUR 24099 EN, Office for the Official Publications of the European Communities, Luxembourg)
- Vogel et al., (2010) Vogel HJ, Weller U, Schlüter S (2010) Quantification of soil structure based on Minkowski functions. Comput Geosci 36: 1236-1245
- Yu et al., (2016) Yu X, Wu C, Fu Y, Brookers PC, Lu S (2016) Three-dimensional pore structure and carbon distribution of macroaggregates in biochar-amended soil. Eur J Soil Sci 67: 109-120