The Geometry and Topology of Data and Information for Analytics of Processes and Behaviours: Building on Bourdieu and Addressing New Societal Challenges
Abstract
We begin by summarizing the relevance and importance of inductive analytics based on the geometry and topology of data and information. Contemporary issues are then discussed. These include how sampling data for representativity is increasingly to be questioned. While we can always avail of analytics from a “bag of tools and techniques”, in the application of machine learning and predictive analytics, nonetheless we present the case for Bourdieu and Benzécri-based science of data, as follows. This is to construct bridges between data sources and position-taking, and decision-making. There is summary presentation of a few case studies, illustrating and exemplifying application domains.
1 Introduction
From the data analytics viewpoint, a summary of the main procedural principles and features of the analytical methodology arising out of Pierre Bourdieu’s work is provided in Lebaron (2015). The following points are related to that summary.
-
1.
Determine and display social field structure, or even more comprehensively, social space configuration.
-
2.
Show structural homologies between fields or social spaces, based on axis, or factor, interpretation.
-
3.
So, this is reasoning by analogy, therefore inductive reasoning, but in a context that can use, in an integral manner, statistical modelling and predictive learning. The latter encompasses machine learning methods.
-
4.
Determine relative autonomy between fields or social spaces. This is through use of comparative procedures, and causal hypotheses on the relations between fields.
-
5.
Study sub-spaces in a global social space. This is through use of class specific analysis, or MCA, Multiple Correspondence Analysis of sub-clouds of subjects.
-
6.
Informed by statistics, and supervised (with training set, test set) machine learning, explain social practice and position-taking, with associated decision-making.
-
7.
Effects and consequences, thus predictive field-related outcomes. Here, there may be integrated use of analysis of variance (ANOVA) or regression, or of supervised machine learning methods.
-
8.
Study field dynamics using hierarchical classification, in factor space, use of appropriate supplementary or contextual elements (attributes, subjects) that can form structuring factors, and fully integrate time-evolving data.
This comprehensive and far reaching data analysis methodology, will encompass statistical modelling, machine learning, predictive analytics, and visualization analytics, whenever these are relevant and appropriate. Relative to current machine learning practice that can be characterized as the “bag of tools and techniques” approach to analytics, the following are unquestionably major benefits. Field and homology, and underpinning these, geometry and topology, employed for inductive reasoning, and relating such reasoning with position-taking or decision making.
Themes of this article encompass the following: application of analytics drawing on social fields and homology, and beyond; general and broad relevance and applicability; underpinning the analytics, we may consider that we have: data leading to information, leading to knowledge, leading to wisdom. Geometric data analysis (GDA), and based on GDA, topology, is the essential basis for all such work.
In section 2, we both justify and strongly motivate Bourdieu-related analytics for contemporary data analytics problems.
In section 3, in our analytics, we are seeking explanatory or elucidatory narratives. Three case studies are at issue. Firstly, there is the expression or manifestation of underlying emotions. Secondly, there is the convergence of events or activities, expressing causal or consequential outcomes. Thirdly, there are the most influential patterns and trends in very large data sources.
2 New Challenges and Opportunities in the Context of Big Data Analytics
The following expands on our contribution to the discussion in Keiding and Louis (2016). The comprehensive survey (with 141 references) of Keiding and Louis (2016) sets out new contemporary issues of sampling and population distribution estimation. An important take-home message is this: “There is the potential for big data to evaluate or calibrate survey findings … to help to validate cohort studies”. Examples are discussed of “how data … tracks well with the official”, and contextual, repository or holdings. It is well pointed out how one case study discussed “shows the value of using ‘big data’ to conduct research on surveys (as distinct from survey research)”. This arises from what has been discussed by Japec et al., (2015): “The new paradigm means it is now possible to digitally capture, semantically reconcile, aggregate, and correlate data.”
Limitations though are clear: “Although randomization in some form is very beneficial, it is by no means a panacea. Trial participants are commonly very different from the external … pool, in part because of self-selection, …”. This is due to, “One type of selection bias is self-selection (which is our focus)”.
Important points towards addressing these contemporary issues include the following. “When informing policy, inference to identified reference populations is key”. This is part of the bridge which is needed, between data analytics technology and deployment of outcomes. “In all situations, modelling is needed to accommodate non-response, dropouts and other forms of missing data.”
While “Representativity should be avoided”, here is an essential way to address in a fundamental way, what we need to address: “Assessment of external validity, i.e. generalization to the population from which the study subjects originated or to other populations, will in principle proceed via formulation of abstract laws of nature similar to physical laws”.
Interesting perspectives that support Keiding and Louis (2016), include Friedman et al. (2015), and the following, from Laurison and Friedman (2015): “… the GBCS [Great British Class Survey] data have three important limitations. First, the GBCS was a self-selecting web-based survey, … This means it is not possible to make formal inferences. … the nationally representative nature of the Labour Force Survey (LFS) along with its detailed and accurate measures … facilitates a much more in-depth investigation …” In a blog posting, Laurison (2015) points very clearly to how, just “Because the GBCS is not a random-sample or representative survey”, other ways can and are being found to draw great benefit.
Another different study on open, free text questionnaires (Züll and Scholz, 2011, see also 2015) notes selection bias, but also: “However, the reasonable use of data always depends on the focus of analyses. So, if the bias is taken into account, then group-specific analyses of open-ended questions data seem appropriate”.
The bridge between the data that is analyzed, and the calibrating Big Data, is well addressed by the geometry and topology of data. Those form the link between sampled data and the greater cosmos. Bourdieu’s concept of field is a prime exemplar. Consider, as noted by Lebaron (2009), how Bourdieu’s work, involves “putting his thinking in mathematical terms”, and that it “led him to a conscious and systematic move toward a geometric frame-model”. This is a multidimensional, “structural vision”. Bourdieu’s analytics “amounted to the global [hence Big Data] effects of a complex structure of interrelationships, which is not reducible to the combination of the multiple [… effects] of independent variables”. The concept of field, here, uses Geometric Data Analysis that is core to the integrated data and methodology approach used in the Correspondence Analysis platform (used, in general, in Murtagh, 2010; and comprehensively in Le Roux, 2014).
An approach to drawing benefit from Big Data is precisely as described in Keiding and Louis (2016). The noting of the need for the “formulation of abstract laws” that bridge sampled data and calibrating Big Data can be addressed, for the data analyst and for the application specialist, as geometric and topological.
The principles and practice following from the Big Data setting for our analytics can also be linked to ethical issues. Consider, for example, that sources of data start with: interviews, online media, and big data including data that is unstructured, structured, heterogeneous multimedia, open linked, and so on. One example is to consider the long term prediction of criminal activity, versus the prediction of exposure or vulnerability to crime. The latter can lead to preemptive and preventative action, with no ethical aspects involved. A narrative approach, therefore using analytical field dynamics, offers a practical and effective alternative (Harcourt, 2002, 2006). Over and above the sole use of quantitative prediction, we are noting the importance of integrated qualitative and quantitative analytics.
In line with Harcourt’s work (Harcourt, 2002), with the central role of Correspondence Analysis, this programme of work encompasses: not “content analysis” but rather “map analysis”. I.e. “cognitive mapping, relational analysis, and meaning analysis” among other names. Harcourt notes the need “to visually represent the relationship between structures of social meaning and the contexts and practices within which they are embedded”.
Harcourt’s work has case studies related to sexual activity, and activities with firearms. We would propose the great importance of pursuing field and homology analytics, of underpinning geometric and topological data analysis, for all levels of digital, online or cyber crime and misdemeanour. From Harcourt (2005): “Where do we stake the boundary of the criminal law – or, more importantly, how? How do we decide what to punish? Do we distribute these vices, these recreations, these conducts – what do we even call these things? – into two categories, the passable and the penal, and then carve some limiting principle to distinguish the two? Are we, in the very process, merely concocting some permeable line – a Maginot line – to police the criminal frontier?”
In this section, we have noted the contemporary very wide-ranging, and comprehensive, applicability of analytics that come from the work of Pierre Bourdieu, taking the integral theory and practice of Jean-Paul Benzécri’s life work. Note has also been made of how this can incorporate and include the mostly sole use of “bag of tools and techniques” (informally expressed in this way) characterization of unsupervised and supervised machine learning.
3 Narrative Analytics, and Narrative Synthesis
We consider a complex web of relationships. Semantics include web of relationships – thematic structures and patterns. Structures and interrelationships evolve in time. Semantics include time evolution of structures and patterns, including both: threads and commonality; and change, the exceptional, the anomalous. Narrative can suggest a causal or emotional relationship between events. A story is an expression of causality or connection. Narrative connects facts or views or other units of information.
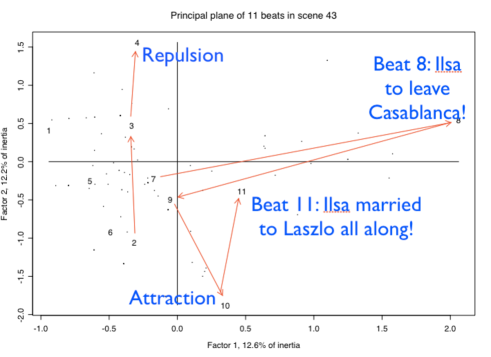
In Murtagh et al. (2009), there is stochastic analysis of structure and style, of the film script of the movie, Casablanca, shot by Warner Brothers between May and August 1942. This both statistically and qualitatively supports McKee’s (1999) statement that the composition of Casablanca is “virtually perfect”.
An application that resulted from this work was visualization of narrative, supporting collective, collaborative narrative construction. This related to collective book authoring by literature students in university, and for many books published, by school children, following this narrative display and support framework. See Reddington et al. (2013).
Figure 1 displays and depicts McKee’s description of “mid-act climax”, scene 43, subdivided into 11 “beats” or subscenes. This portrays emotional attraction and repulsion between Rick and Ilsa, on the second axis (respectively, here, negative, positive directions); the first axis counterposes externality relative to the main location, Casablanca.
In the tracking of emotion, we are determining and tracking emotion in an unsupervised way. (This is not machine learning like in sentiment analysis, which is supervised.) Emotion is understood as a manifestation of the unconscious. Social activity causes emotion to be expressed or manifested. (Cf. Murtagh, 2014.)
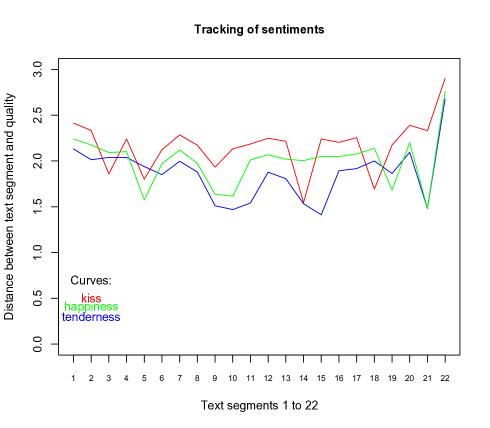
We used chapters 9, 10, 11, 12 of Gustave Flaubert’s 19th century novel, Madame Bovary. This concerns the three-way relationship between Emma Bovary, her husband Charles, and her lover Rodolphe Boulanger.
In Figure 2, there is display of the evolution of sentiment, expressed by (or proxied by) the terms “kiss”, “tenderness”, and “happiness”. We see that some text segments are more expressive of emotion than are other text segments.
In Murtagh and Ganz (2015) we look at, firstly, emotional interaction in the Casablanca movie, using dialogue (and dialogue only) between main characters Ilsa and Rick. Secondly, we look at all of the text in chapters 9 to 12 of the novel, Madame Bovary. In both studies, we used the same methodology, i.e. cross-tabulation of word sets, comprising the entire universe of discourse, and including function and grammar words that characterized textual “texture”. We find the latter to be very useful for expression of emotion.
Figure 2 displays the evolution of sentiment, expressed by (or proxied by) the terms “kiss”, “tenderness”, and “happiness”. We see that some text segments are more expressive of emotion than are other text segments.
We now briefly describe another study of both quantitative and qualitative analysis.
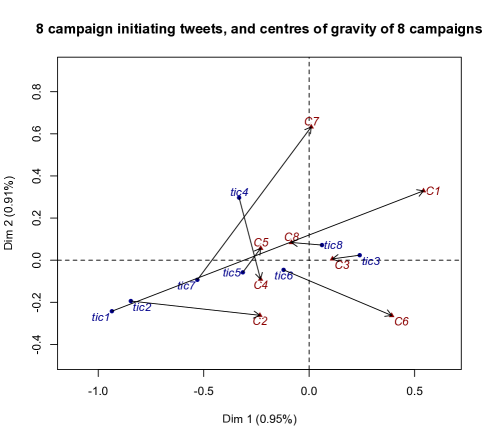
A particular narrative pattern is at issue now, arising out of a social media case study, and motivated by Jürgen Habermas’s Theory of Communicative Action (Theorie des kommunikativen Handelns). For impact of actions, here based on initiating tweets on Twitter, related to environmental issues, this is considered as: semantic distance between the initiating action, and the net aggregate outcome. This can be statistically modelled and tested.
Figure 3 (Murtagh et al., 2016), shows the 8 tweets that initiated the campaigns, and the net aggregate campaigns, given by the centres of gravity of the 8 campaigns. We see that campaigns 3, 5, 8 have initiating tweets that are fairly close to the net overall campaign in these cases. By looking at all tweets, and all terms, it is seen that the campaign initiating tweets, and the overall campaign means, are close to the origin, i.e. the global average. That just means that they (respectively, initiating tweets, and means) are relatively unexceptional among all tweets. While the information that we find in our data is very faint, nonetheless we have an excellent visualization of this information, that we further analyze, quantitatively.
A further study is at issue, next, with a far larger Twitter data source.
In Murtagh (2016), we are concerned with social and community aspects of cultural festivals. Our data is about 12 million Twitter tweets, in the time period, May to December 2015. (Further data will be analysed by us in the future.) Included are such events as the following: Cannes Film Festival (13–24 May 2015); Fèis Ìle, Isle of Islay (Scotland) Festival (23–31 May 2015); Berlin Film Festival (19–21 May 2015); CMA, Country Music Association (Nov. 2015); Yulin Dog (June 2015); and Avignon Theatre Festival (4–25 July 2015). In our initial exploratory analyses, the critical Twitter debate in regard to the Yulin Dog Meat Festival meant that Twitter data was quite distinct. So in Figure 4, there is a selection of the other festivals, listed above. A sufficiently used word set was derived from the Twitter tweet set. For the data used here, a 5815 word corpus was used, from the 32,507,477 words in the data. Occurrence of 1000 uses of a word was required. Filtering was also carried out of prepositions, parts of verbs, just some abbreviations or partial words, and non-Roman scripts including Cyrillic, Chinese, Japanese, and Greek. In what was retained, English, French and Spanish dominated.
An initial analytics decision to be made is what is the principal set of individuals or records to be used, with other such objects being supplementary elements; and similarly, what is the principal attribute or variable or variable modality set to be used, with other variables being supplementary elements. Contextual attributes will naturally be supplementary elements. We can have the following analytics perspective: we use an analytics resolution scale, that is such that tweets per day are considered. Thus the principal data crosses the set of 233 days (from 11 May 2015 to 31 December 2015) by the retained word corpus. That is under investigation in Murtagh (2016).
In Figure 4, the principal variables are the five festivals. Factor 1 is dominated by (contribution to the axis inertia) the Avignon Theatre festival, factor 2 is dominated by the Nashville, Tennessee, Country Music Association, factor 3 is dominated by the Berlin film festival. Word projections are shown as dots, just indicating the semantic density. (The numbers of occurrences of these festival names, which could have multiple occurrences in a single tweet, and certainly possibly lots of occurrences in a day’s tweets, are: Cannes, 1,615,550; Avignon, 102,499; CMA, 9407; Berlin, 5557; and Ìle, 1998.) The months, 5 being May, 6 being June, and so on, until 12 being December, are displayed as supplementary elements.
In order to look in an exploratory way at country names used in the Twitter data, a set of names was selected. This included, just to see if there were a distinction, England and Britain. In the lower right panel in Figure 4, it is interesting how the semantics here, i.e. the Twitter social media sourcing, and also taking the principal factor coordinates, factors 1, 2, results in Austria and Finland, and then Ireland, being similar here.

From the point of view of analytical procedure, in the foregoing, we have made use of the following: resolution scale of the analysis, and our primary focus in the analysis; contextual or ancillary information associated as supplementary elements; and selective pattern determination and trend following.
4 Towards Behaviour and Activity Analytics, for Mental Health, Depression, and Lifestyle Analytics
We are using Euclidean geometry for semantics of information. In the referenced articles, in previous sections, we used hierarchical topology for other aspects of semantics, and in particular how a hierarchy expresses anomaly or change. A further useful case is when the hierarchy respects chronological or other sequence information. In our view, analytics based on Bourdieu’s work, based on MCA, Multiple Correspondence Analysis, (encompassing e.g. field, homology, habitus, etc.) should be a main analytics approach in many current areas of work, including smarter cities, analytics of Internet of Things, security and forensics (including trust and identity), Big Data, etc.
It is noted in Kleinman et al. (2016) how relevant and important mental health is, given the integral association with physical health. From Kleinman et al. (2016) there is the following: “… parity between mental and physical health conditions remains a distant ideal”. “The global economy loses about $1 trillion every year in productivity due to depression and anxiety”. “Next steps include … integration of mental health into other health and development sectors”.
In Cooper et al. (2016), page 4, under the heading of “Five Ways to Wellbeing”, reference is made to “mental capital and wellbeing”. On page 14, a section is entitled “The ‘mental capital’ values of the outdoors”.
5 Mental Health: Adult Psychiatric Morbidity Survey, England, 2007
A periodic survey of mental health, HSCIC (2009), is used. There are 1704 variables, including questioning of the subjects about symptoms and disorders, psychoses and depression characteristics, anti-social behaviours, eating characteristics and alcohol consumption, drug use, and socio-demographics, including gender, age, educational level, marital status, employment status, and region lived in.
As a first analysis, the following variables were selected: 14 questions, hence 14 categorical variables, relating to “Neurotic symptoms and common mental disorders”. These are described in HSCIC (2009, Appendix C). Almost all of these variables had as question responses, whether or not there were symptoms or disorders in the past week, one question related to one’s lifetime, and one question related to the age of 16 onwards. Another question set was selected, relating to socio-demographic variables, noted in the foregoing paragraph. In this set of socio-demographic variables, there were 9 variables.
An initial display of the neurotic symptoms and common mental disorders, see Figure 5, sought to have socio-demographic variables as supplementary. But these were projected close to the origin, therefore showing very little differentiation or explanatory relevance for the symptoms and disorders data.
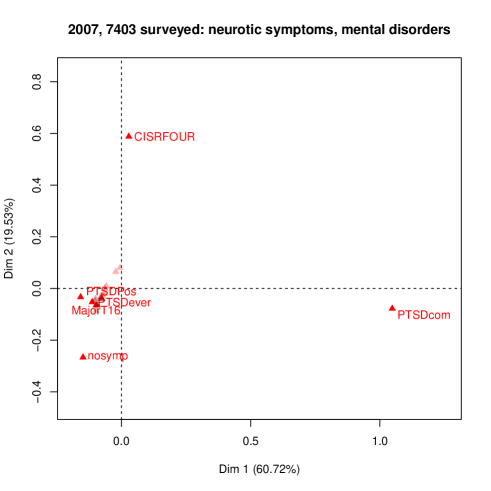
In Figure 5, it is found that factor 1 is explained as PTSDcom, “Trauma screening questionnaire total score” versus all other variables. Factor 2 is explained as “CISRFOUR” versus “nosymp”. These are, respectively, “CIS-R score in four groups, 0-5, 6-11, 12-17, 18 and over. (CIS-R = Common Mental Disorders questionnaire)”; and no neurotic symptoms in the past week.
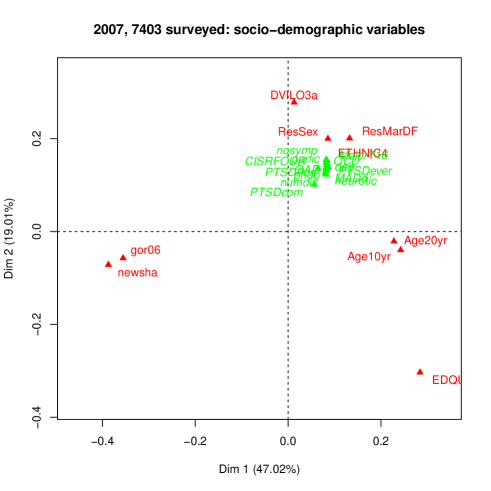
Next, Figure 6, it was sought to characterize the socio-demographic data, and then to see if the neurotic symptoms and common mental disorders data could be explanatory and contextual for the socio-demographic data. But no differentiation was found for these supplementary variables, indicating no particular explanatory capability in this particular instance.
It may be just noted how, in Figures 5 and 6, the main and supplementary variables were interchanged. Respectively, the symptoms and demographic variables were main and supplementary; then the main and supplementary variables were the demographic variables and symptoms. This was done in order to explore the data.
In Figure 6, factor 1 is seen to have age and education level counterposed to home region. Factor 2 is seen to have educational level counterposed to: employment status, gender, marital status, ethnicity. (In the paragraph to follow, the names of some of these variables are explained.)
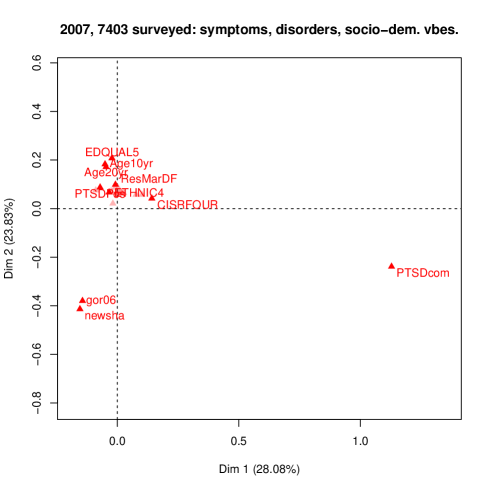
Finally, it was checked whether neurotic symptoms and common mental disorders data should be jointly analysed with the socio-demographic data. Figure 7 shows this outcome. On the positive first factor, what is particularly important, from the contribution to the inertia, is PTSDcom, “TSQ (Trauma Screening Questionnaire) total score”. The negative second factor, is highly influenced by these two variables: “gor06”, “newsha”, respectively: “Government office region” and “Strategic Health Authorities”. These were both sets of geographic regions in England, respectively 9 and 10. (The 7th such region in each of these variables was London.)
One aim that we have in future work is to see if we can formulate forms and expressions of “mental capital”. This concept was noted in section 4 where an example of it was going for a walk, therefore taking exercise, in the countryside or parkland.
A summary, and preliminary, interpretation derived from Figure 7 is how factor 1 accounts for recorded trauma, and factor 2 accounts for region of the respondent.
6 Conclusions
In this work, we have sought to provide perspectives and focus for the analytics of behaviours and activities. These can be related to individuals, and to social groupings or collectivities. We will, in such analytics, work towards responding to the problem of bias in big data sampling and related representativity. We also seek to bridge the data with decision-making information. In the sense of the latter, we are bridging data analytics with position-taking.
Procedurally, the following can be noted. Methodology and implementation are quite integral to the analytics described here. This is counterposed to having methods used as “black boxes”, which was a term used, occasionally, in the early days of neural network methods, typically for supervised classification, or nonlinear regression.
In this work, there is direct relationship also with psycho-analytical issues, with the same geometric and topological data analytics for the bi-logic that is manifested by the integral human reasoning and thought processes, both conscious and unconscious. For background on this, and case studies, detailing the Correspondence Analysis platform, and ultrametric (hierarchical) topology that is central to unconscious thought processes, see Murtagh (2014).
References
Cooper C, Wilsdon J, and Shooter M. (2016) Making the Case for the Social
Sciences, No. 9 Mental Wellbeing. 28 pp. BACP, British Association for Counselling and
Psychotherapy. Available at:
http://www.acss.org.uk/wp-content/uploads/2013/09/Making-the-Case-9-Mental-Wellbeing-Web.pdf
Harcourt BE (2002) Measured interpretation: introducing the method of Correspondence Analysis to legal studies, University of Illinois Law Review, 979–1017.
Harcourt BE (2005) Carceral imaginations, Carceral Notebooks, vol: 1.
Available at: http://www.thecarceral.org/imaginations.pdf
Harcourt BE (2006) Against Prediction. Profiling, Policing, and Punishing in an Actuarial Age. Chicago: University of Chicago Press.
HSCIC, Health and Social Care Information Centre (National Health Service, UK) (2009).
National Statistics Adult Psychiatric Morbidity in England - 2007, Results of a
household survey, Appendices and Glossary. 174 pp.
Available at: http://www.hscic.gov.uk/pubs/psychiatricmorbidity07
Japec L, Kreuter F, Berg M, Biemer P, Decker P, Lampe C, Lane J,
O’Neil C, and Usher A (2015) AAPOR Report on Big Data. Technical Report.
AAPOR, American Association for Public Opinion Research, 50 pp.
Available at:
http://www.aapor.org/AAPORKentico/Education-Resources/Reports.aspx
and
https://www.aapor.org/AAPORKentico/AAPOR_Main/media/
Task-Force-Reports/BigDataTaskForceReport_FINAL_2_12_15_b.pdf
Keiding N, and Louis TA (2016) Perils and potentials of self-selected entry to epidemiological studies and surveys. Journal of the Royal Statistical Society, Series A vol: 179, Part 2, 319–376.
Kleinman A, Lockwood Estrin G, Usmani S, Chisholm D, Marquez PV, Evans TG, and Saxena S (2016) Time for mental health to come out of the shadows. The Lancet vol: 387, 2274–2275.
Laurison D (2015) Blog, Three myths and facts about the Great British Class
Survey. Available at:
http://www.thesociologicalreview.com/information/blog/
three-myths-and-facts-about-the-great-british-class-survey.html
Laurison D, and Friedman S (2015) Introducing the class ceiling: social mobility
and Britain’s elite occupations, LSE (London School of Economics) Sociology
Department Working Paper Series. Available at:
http://www.lse.ac.uk/sociology/pdf/Working-Paper_Introducing-the-Class-Ceiling.pdf
Lebaron F (2009) How Bourdieu ‘quantified’ Bourdieu: the geometric modelling of data. Chapter 2 in Robson K, Sanders C (eds.), Quantifying Theory: Pierre Bourdieu, Heidelberg: Springer.
Lebaron F (2015) L’espace social. Statistique et analyse géométrique des données dans l’œuvre de Pierre Boudieu. (Social space. Statistics and geometric data analysis in the work of Pierre Bourdieu.) Chapter 3 in Lebaron F, Le Roux B (eds.), La Méthodologie de Pierre Bourdieu en Action, Espace Culturel, Espace Social et Analyse des Données (The Methodology of Pierre Bourdieu in Action, Cultural Space, Social Space and Data Analysis), Dunod, Paris.
Le Roux B (2014) Analyse Géométrique des Données Multidimensionnelles, Paris: Dunod.
McKee R (1999) Story, Substance, Structure, Style, and the Principles of Screenwriting, London: Methuen.
Murtagh F, Ganz A, and McKie S (2009) The structure of narrative: the case of film scripts. Pattern Recognition, vol: 42, 302–312. (Discussion in Merali Z (June 2008) Here’s looking at you, kid. Software promises to identify blockbuster scripts, Nature, p. 453.)
Murtagh F (2010) The Correspondence Analysis platform for uncovering deep structure in data and information, Sixth Boole Lecture, Computer Journal, vol: 53 (3), 304–315.
Murtagh F (2014) Mathematical representations of Matte Blanco’s bi-logic, based on metric space and ultrametric or hierarchical topology: towards practical application, Language and Psychoanalysis, vol: 3(2), 40-63.
Murtagh F (2016) Semantic Mapping: Towards Contextual and Trend Analysis of Behaviours and Practices, in K. Balog, L. Cappellato, N. Ferro, C. MacDonald, Eds., Working Notes of CLEF 2016 – Conference and Labs of the Evaluation Forum, Évora, Portugal, 5-8 September, 2016, pp. 1207-1225, 2016. http://ceur-ws.org/Vol-1609/16091207.pdf
Murtagh F, and Ganz A (2015) Pattern recognition in narrative: Tracking emotional
expression in context, Journal of Data Mining and Digital Humanities,
vol: 2015, 21 pp.
Available at: http://http://arxiv.org/abs/1405.3539
Murtagh F, Pianosi M, and Bull R (2016) Semantic mapping of discourse and activity, using Habermas’s Theory of Communicative Action to analyze process, Quality and Quantity, vol: 50(4), 1675–1694.
Reddington J, Murtagh F, and Cowie D (2013) Computational properties of fiction writing and collaborative work, Advances in Intelligent Data Analysis XII, Lecture Notes in Computer Science, vol: 8207, pp. 369–379.
Züll C, and Scholz E (2011) Who took the burden to answer on the meaning of left
and right? Response behaviour on an open-ended question. In Conference Proceedings
of the 64th Annual Conference of WAPOR: Public Opinion and the Internet.
Available at:
http://wapor.unl.edu/wp-content/uploads/2011/09/Zuell_Scholz.docx
Züll C, and Scholz E (2015) Who is willing to answer open-ended questions on the meaning of left and right?, Bulletin of Sociological Methodology, vol: 127(1), 26–42.