Galactic Sources Detected in the NuSTAR Serendipitous Survey
Abstract
The Nuclear Spectroscopic Telescope Array (NuSTAR) provides an improvement in sensitivity at energies above 10 keV by two orders of magnitude over non-focusing satellites, making it possible to probe deeper into the Galaxy and Universe. Lansbury and collaborators recently completed a catalog of 497 sources serendipitously detected in the 3–24 keV band using 13 deg2 of NuSTAR coverage. Here, we report on an optical and X-ray study of 16 Galactic sources in the catalog. We identify eight of them as stars (but some or all could have binary companions), and use information from Gaia to report distances and X-ray luminosities for three of them. There are four CVs or CV candidates, and we argue that NuSTAR J233426–2343.9 is a relatively strong CV candidate based partly on an X-ray spectrum from XMM-Newton. NuSTAR J092418–3142.2, which is the brightest serendipitous source in the Lansbury catalog, and NuSTAR J073959–3147.8 are LMXB candidates, but it is also possible that these two sources are CVs. One of the sources is a known HMXB, and NuSTAR J105008–5958.8 is a new HMXB candidate, which has strong Balmer emission lines in its optical spectrum and a hard X-ray spectrum. We discuss the implications of finding these HMXBs for the surface density (log-log) and luminosity function of Galactic HMXBs. We conclude that, with the large fraction of unclassified sources in the Galactic plane detected by NuSTAR in the 8–24 keV band, there could be a significant population of low luminosity HMXBs.
Subject headings:
surveys — stars: white dwarfs — stars: neutron — stars: black holes — X-rays: stars1. Introduction
The NuSTAR serendipitous source survey is a systematic analysis of all NuSTAR observations excluding the core Galactic Survey programs, the Galactic center and the Norma regions (Hong et al., 2016; Fornasini et al., 2017), and excluding the dedicated Extragalactic Survey programs: COSMOS, ECDFS, EGS, GOODS-N, and UDS (e.g., Civano et al., 2015; Mullaney et al., 2015). After detecting the sources with NuSTAR and looking for counterparts at other wavelengths, we have been performing ground-based optical spectroscopy to identify the sources. This program is described in Alexander et al. (2013) and Aird et al. (2015), and the full 40-month catalog is published in Lansbury et al. (2017).
The NuSTAR serendipitous survey takes advantage of the sensitivity of NuSTAR in the hard X-ray band (Harrison et al., 2013). Although the bandpass of NuSTAR is 3–79 keV, the analysis for the serendipitous survey has been carried out in the 3–24 keV band where the source-to-background ratio is higher for most source types. Thus, in energy, the NuSTAR survey is intermediate between surveys and catalogs constructed in the soft X-ray band with ASCA (0.7–10 keV, Sugizaki et al., 2001), XMM-Newton (0.2–12 keV, Rosen et al., 2016), and the Chandra X-ray Observatory (0.5–7 keV, Evans et al., 2010) and at higher energies with Swift/BAT (15–55 keV, Ajello et al., 2012) and with INTEGRAL (17–100 keV, Bird et al., 2016). In terms of coverage, BAT and INTEGRAL have large fields of view (FOVs), and they have observed the entire sky. The Chandra FOV is comparable to NuSTAR’s, while XMM’s is larger (0.2 deg2 for XMM vs. 0.04 deg2 for NuSTAR). Coupled with the fact that Chandra and XMM have been observing for much longer than NuSTAR, their coverage is larger (approaching 1000 deg2 for XMM compared to 13 deg2 for NuSTAR in the 40-month catalog). However, NuSTAR’s coverage will grow over time, and it is providing the first sensitive survey in the 8–24 keV band. Its sensitivity is approximately two orders of magnitude better than that of BAT and INTEGRAL, pushing into new discovery space (Lansbury et al., 2017).
The source types that INTEGRAL and Swift/BAT have detected in the largest numbers (Bird et al., 2016; Voss & Ajello, 2010; Krivonos et al., 2012) are Active Galactic Nuclei (AGN), Low-Mass X-ray Binaries (LMXBs), High-Mass X-ray Binaries (HMXBs), and Cataclysmic Variables (CVs). While these accreting black holes, neutron stars, and white dwarfs are the most common types, INTEGRAL also detects significant numbers of non-accreting compact objects, including pulsar wind nebulae and magnetars. While Lansbury et al. (2017) reported basic information (e.g., positions, count rates, and fluxes with NuSTAR) for all of the serendipitously detected sources, the scientific focus of that work is the extragalactic sources, including the identification of a large group of hard X-ray selected AGN. The NuSTAR AGN have a median redshift of , which is about an order of magnitude higher than the median redshift of the brighter AGN in the BAT sample. In the current work, we are reporting on the Galactic sources, and we can expect the following advances: 1. for all Galactic source types, the X-ray luminosities are such that the search volumes for existing surveys do not extend to the other side of the Galaxy, so going deeper increases the search volume and essentially guarantees that new hard X-ray sources will be found; 2. considering HMXBs, Lutovinov et al. (2013) show that INTEGRAL’s search volume for sources with luminosities erg s-1 extends only a small distance past the center of the Galaxy; and 3. we are also searching for closer sources at lower luminosity (e.g., HMXBs with weak stellar winds), and if we do not find such sources, this will have implications for the luminosity functions of the different source types.
The known population of HMXBs has increased in size by nearly a factor of three over the past decade due to coverage of the Galactic plane at 17 keV provided by INTEGRAL (Walter et al., 2015). Even though INTEGRAL has given us a much better estimate of the total number of HMXBs in the Galaxy, we could still be missing a large part of the faint population, which is important for determining if the luminosity function for persistent HMXBs breaks below erg s-1 (Lutovinov et al., 2013). One reason why this question is interesting is that HMXBs are the progenitors of compact object merger events, and, as more of these are detected via gravitational waves (Abbott et al., 2016), we anticipate obtaining a much more complete picture of HMXB evolution since a significant fractions of HMXBs will evolve to NS-NS, NS-BH, or BH-BH binaries. Constraining HMXB evolution may also provide information about the distant and early Universe. As HMXBs form and remain luminous for 10–30 Myr after a starburst, their X-ray emission can be used to trace the star formation rate in distant galaxies (e.g., Mineo et al., 2012). Also, it is possible that HMXBs played a role in the heating and reionization of the early Universe (e.g., Brorby et al., 2016). While the high-luminosity end of the distribution has the greatest impact, different phases of HMXB evolution will produce different levels of X-ray emission; thus, knowing the total number of HMXBs, how many harbor black holes as opposed to neutron stars, and how they evolve helps to constrain the heating that they could have caused.
While the NuSTAR survey is much deeper than previous hard X-ray surveys, the XMM and Chandra surveys extend to much lower luminosities in the soft X-rays. However, so many sources are found that a very small fraction is followed up in any way. Thus, NuSTAR also plays the role of selecting sources that are already in the XMM or Chandra catalogs. While soft X-rays are produced by many types of sources due to thermal processes, extending into the hard X-rays greatly increases the fraction of sources with extreme physics (e.g., particle acceleration, accretion shocks, relativistic jets, highly magnetic neutron stars, and the strong gravity around black holes and neutron stars). In addition, sources in the Galactic plane can be obscured by interstellar material or material local to the source, and observing above 8 keV decreases this bias.
In this paper, we describe how we defined our sample of 16 Galactic sources from Lansbury et al. (2017) in Section 2. Section 3 details the soft X-ray and optical counterpart identifications found by Lansbury et al. (2017), and we also perform new searches of the SIMBAD database to determine if the nature of any of the sources is known. In Section 4, we report on the hard X-ray fluxes of the sources, including a new NuSTAR measurement of NuSTAR J092418–3142.2, which is the brightest serendipitous source discovered. For the nine sources that have not already been identified in SIMBAD, we analyze their optical spectra in Section 5 and use them to discuss their identifications. In Section 6, we analyze the NuSTAR, XMM, and Swift spectra for the four sources that show optical emission lines, which may be a sign that they have accretion disks. In Section 7, we discuss the results, including a detailed look at implications for the HMXB population in the Galaxy and also a discussion of the incompleteness of the survey, especially regarding the number of sources with optical spectroscopic identifications near the Galactic plane. Finally, in Section 8, we describe our conclusions and discuss possibilities for future work.
2. The Galactic NuSTAR Serendipitous Sources
The primary Lansbury et al. (2017) 40-month catalog includes 497 detected serendipitous sources (or “serendips”) using 20 Ms of NuSTAR exposure with 13 deg2 of coverage. From ground-based follow-up and archival searches, classifications were obtained for 276 of the serendips in the primary catalog, with 94% of these (260) being AGN. The remaining 16 sources are classified as Galactic sources based on having optical emission or absorption lines at zero redshift. Lansbury et al. (2017) also provide a secondary catalog with 64 serendips found using a different source detection approach from that used for the primary catalog, and five of these are classified as Galactic sources. Among the 21 sources classified as Galactic in the primary and secondary catalogs, Lansbury et al. (2017) note that there is uncertainty about the optical counterpart in five of these cases (for NuSTAR J080421+0504.9, NuSTAR J102318+0036.5, NuSTAR J202339+3347.7, NuSTAR J202351+3354.3, and NuSTAR J202420+3347.7), and we save these for future work (e.g., after more accurate X-ray positions are obtained, allowing for optical or near-IR spectroscopy).
This study therefore focuses on 16 sources: 11 from the primary catalog and five from the secondary catalog. Table 1 provides basic information about the 16 sources, including the ID number from the Lansbury et al. (2017) catalogs (the IDs starting with “P” and “S” are from the primary and secondary catalogs, respectively), the source names, the positions in Equatorial and Galactic coordinates, and the NuSTAR exposure time used for the serendipitous survey. With one exception (S20), the Equatorial positions come directly from Lansbury et al. (2017), and they have 90% confidence uncertainties of 14–22′′, depending on the source detection significance. We note that the sources are widely spread in Galactic latitude, from = –72.3∘ to , and only six of the 16 sources are within of the plane. This does not match any single known population of Galactic sources, suggesting that this first group of serendips identified as being Galactic likely contains a significant number of nearby sources with high latitude, and those at are dominated by active stars and CVs (Sazonov et al., 2006). However, the serendips in the Galactic plane are under-represented in the current study because they are more difficult to classify. As discussed in Sections 7.2 and 7.3, a large fraction of the sources in the Galactic plane are currently unclassified due to the challenges caused by crowding and extinction.
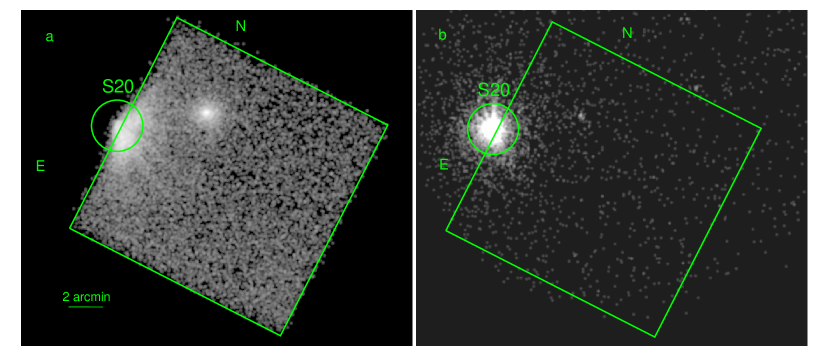
For S20, the source was at the edge of the NuSTAR field of view for the observation in which the source was discovered, and the 3–79 keV image is shown in Figure 1a. While only a very rough position for S20 can be obtained from the NuSTAR data, a Swift X-ray Telescope (XRT) observation occurred on 2014 April 19 during the NuSTAR observation. The XRT field of view is somewhat larger, and the S20 point spread function is fully covered (Figure 1b). We used xrtcentroid to constrain the position of S20 to be R.A. (J2000) = , Decl. (J2000) = – with an 90% confidence uncertainty of , and this is the position that is given in Table 1.
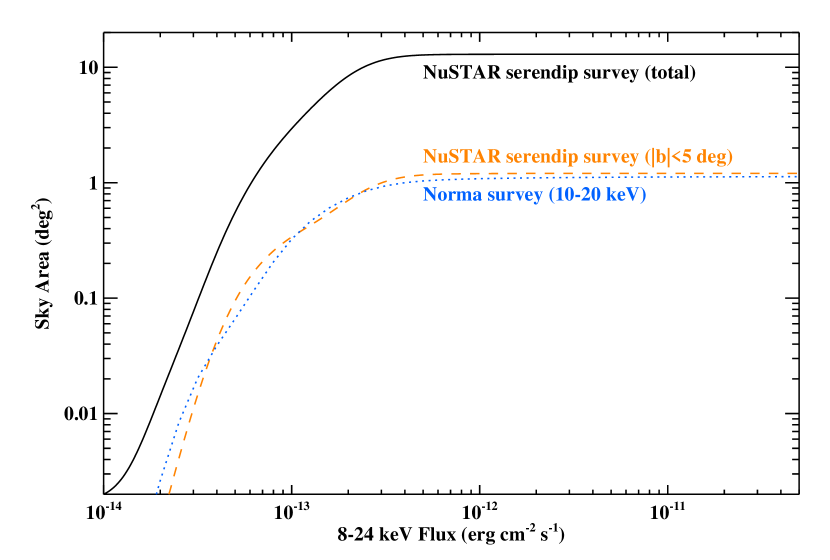
While the full 13 deg2 of sky coverage is for all Galactic latitudes and sources fluxes down to erg cm-2 s-1 (8–24 keV), Figure 2 shows that there is still significant coverage at fluxes that are an order of magnitude lower. While stars and CVs are somewhat more concentrated toward the Galactic plane, their space densities are high enough that they can be found at any Galactic latitude (Sazonov et al., 2006; Revnivtsev et al., 2008; Pretorius & Knigge, 2012). On the other hand, HMXBs have a comparatively low space density and are strongly concentrated toward the Galactic plane. In the Bird et al. (2016) INTEGRAL catalog, after removing HMXBs in the Magellanic Clouds, 104 of 105 HMXBs have Galactic latitudes between – and ; thus, in Figure 2, we also show the sky coverage for the serendipitous source survey for observations within of the Galactic plane. Although this is a large reduction from 13 deg2 to 1.2 deg2, the survey has very similar coverage to the Norma spiral arm survey111We note that the Norma study used a slightly different hard X-ray energy band of 10–20 keV. (Fornasini et al., 2017), which is one of the primary NuSTAR Galactic plane surveys.
3. X-ray/Optical Counterparts and SIMBAD Identifications
Table 2 lists the soft X-ray counterparts identified by Lansbury et al. (2017) for each of the NuSTAR serendips. They come from catalogs or analysis of archival observations with XMM-Newton, Chandra, and Swift. While the soft X-ray position uncertainties depend on a variety of factors (e.g., number of source counts detected, satellite point spread function, off-axis angle, and systematic offsets), they are typically near for Chandra, a few arcseconds for XMM-Newton, and several arcseconds for Swift. The positions of the soft X-ray sources are provided along with the separation between the positions reported in Table 1 and the soft X-ray position. For the 15 sources with NuSTAR positions, the separations range from to , with two out of 15 being slighly beyond the 90% confidence NuSTAR error circle, which is consistent with the expected statistical distribution of separations. For S20, there is a Chandra source, CXO J092418.2–314217, within of the Swift position.
The optical counterparts are listed in Table 3 with the optical catalog where the source is found, the Equatorial coordinates of the counterparts, the separation between the soft X-ray and optical positions, and the -band magnitude. For the four Chandra sources (P146, S20, S37, and P408), the separations are , , , and , respectively, which is consistent with Chandra’s sub-arcsecond accuracy. For the ten XMM-Newton sources, the average separation is , with a range between (for P82) and (for P316). The separations are reasonable considering the accuracy of the XMM-Newton positions, but the identifications for sources with the largest separations (P316 and perhaps P376) are worth confirming with future observations with Chandra to improve the X-ray position constraints. The two Swift source separations are for P98 and for P497, which are consistent with the Swift position uncertainties.
For each optical position, we searched the SIMBAD astronomical database (Wenger et al., 2000) to determine if the sources have already been classified, and the results of the searches are summarized in Table 4. We found SIMBAD matches in nine of 16 cases, and the source type is known in seven cases. Often, sources have several different names (or “identifiers”), and, in Table 4, we give one of the identifiers as well as the number of identifiers. We also indicate the wavelength in which the sources have been previously detected. For serendips S1, P98, and P146, this is the first time that these sources have been reported as X-ray sources. Of the sources that have been classified, there are four bright stars: S1 is HD 1165 with ; P146 is TYC 7654-3811-1 with ; S37 is HD 109573B with ; and P340 is TYC 3866-132-1 with . In three cases, we obtained the classifications before performing optical follow-up, but, for P146, the optical spectrum we obtained is shown in Lansbury et al. (2017), confirming its stellar nature. There are also two Cataclysmic Variables (CVs): Serendip P82 is RX J0425.6–5714, which is a polar-type magnetic CV (Halpern et al., 1998); and serendip P98 is the nova-like CV V1193 Ori with properties similar to a non-magnetic CV in outburst (Bond et al., 1987). We obtained optical spectra for both of these, and the strong Balmer series emission lines and optical continuum with low extinction (Lansbury et al., 2017) are consistent with the sources being CVs. Finally, serendip S43 is a known HMXB, 2RXP J130159.6–635806. It is an accreting pulsar with a spin period near 700 s, and a full analysis of the NuSTAR data is reported in Krivonos et al. (2015).
Two of the other Galactic serendips have matches in SIMBAD, but they are not classified. Serendip P194 is known to be an X-ray source, 2XMM J095839.2+690910, but its nature is uncertain. Also, there is an apparent match between serendip P497 and the ROSAT source 1RXS J233427.8–234419. For these two sources and the other seven that do not have any matches in SIMBAD, we consider possible classifications in Section 5.
4. The Hard X-ray Emission from the Galactic Serendips
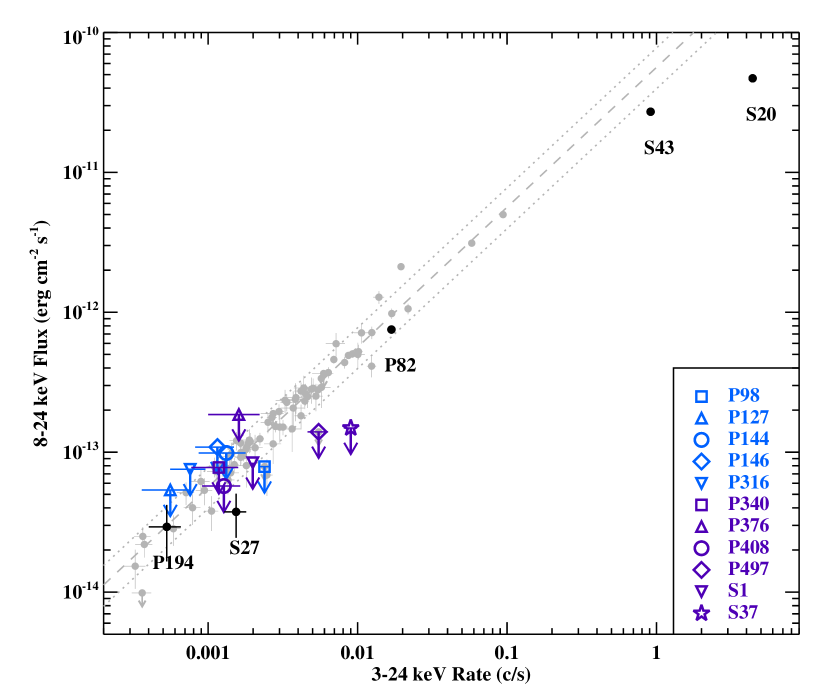
Lansbury et al. (2017) includes NuSTAR count rates and fluxes for the serendips in the primary and secondary catalogs. They are reported for the 3–24 keV, 3–8 keV, and 8–24 keV bands. In Figure 3, we plot the 8–24 keV flux vs. the 3–24 keV rate. In addition to the 16 Galactic serendips, we plot the same quantities for the 81 AGN in the primary catalog with a false probability of detection below . A typical power-law photon index for AGN is , and the flux/rate relationship for such a spectrum is indicated as a dashed line on Figure 3. Thus, the location of the Galactic sources in the diagram allows for a comparison to the hardness of the AGN spectra.
Of the seven sources with SIMBAD classifications, the four bright stars and the non-magnetic CV are not detected at 8–24 keV (see Figure 3). S37 is significantly softer than the AGN, the sources P98 and S1 are at least moderately softer, and the limits on the other two (P146 and P340) are not constraining. The magnetic CV (P82) has a hard spectrum, which may be slightly surprising since P82 is a polar-type CV, and intermediate polars typically have harder spectra than polars (Revnivtsev et al., 2008). Section 7.1 provides more details on the properties of the previously known CVs (P82 and P98). The HMXB (S43) is close to the hardness of the AGN, but it is somewhat below the line. This is not very surprising because, although accreting pulsars in HMXBs (like S43) typically have very hard spectra below 10 keV, their spectra have cutoffs starting near 10 keV. In fact, the S43 spectrum has , but its exponential cutoff starts at 7 keV (Krivonos et al., 2015).
Five of the 16 Galactic serendips are detected in the 8–24 keV band. In addition to P82 and S43, the sources S20, S27, and P194 are detected. The hardnesses for S27 and P194 put them close to the line, but S20, which is the brightest NuSTAR serendip detected to date, is softer. Given that S20 does not have any absorption or emission lines in its optical spectrum (see Section 5), the fact that its X-ray spectrum is too soft for it to be an AGN is an important confirmation that it is Galactic. As described in Section 2, S20 was mostly off the active area of the detector when it was discovered, and Lansbury et al. (2017) do not provide count rates and fluxes for S20. However, on 2016 December 10, we obtained a dedicated observation of S20 (= NuSTAR J092418–3142.2 = CXO J092418.2–314217) with NuSTAR (ObsID 30201014002) and XMM-Newton (ObsID 0790620101). While we plan to report on the details of the observation in a future paper, we used the NuSTAR data from ObsID 30201014002 to determine the values for S20 shown in Figure 3.
5. Optical Spectroscopy and Possible Source Classifications
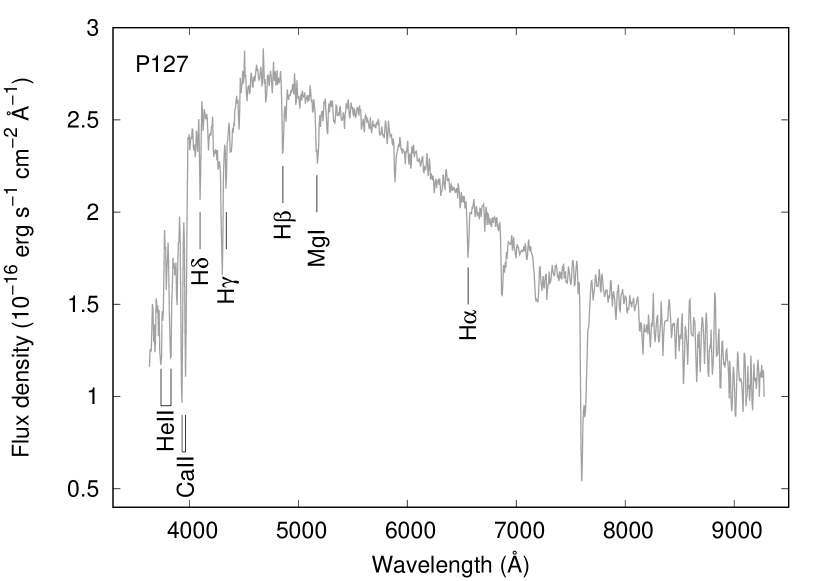
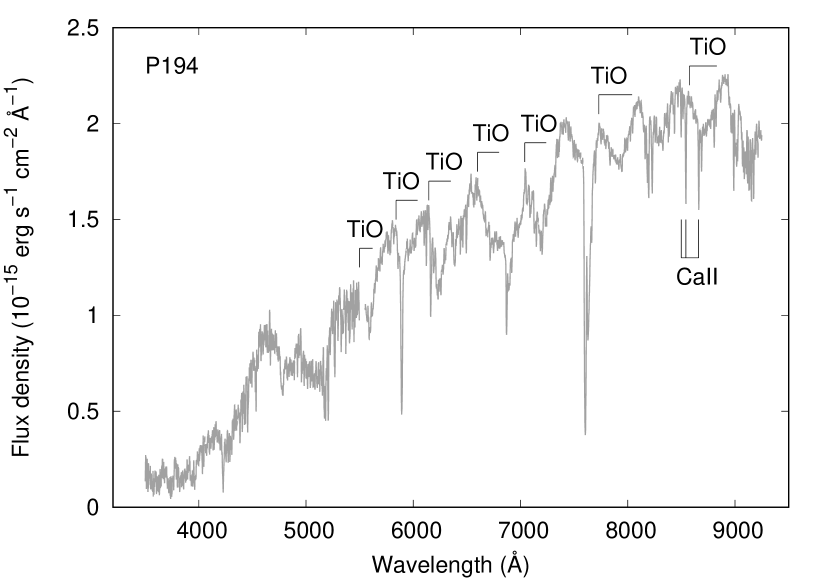
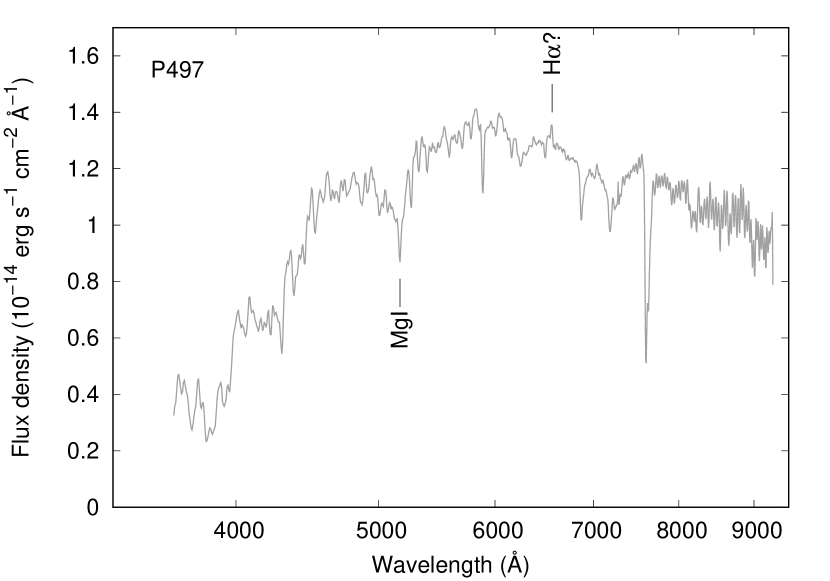
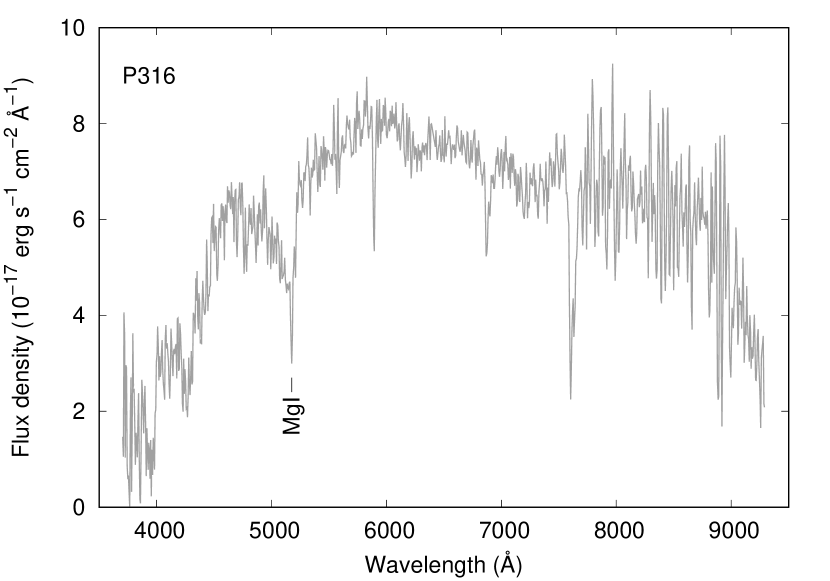
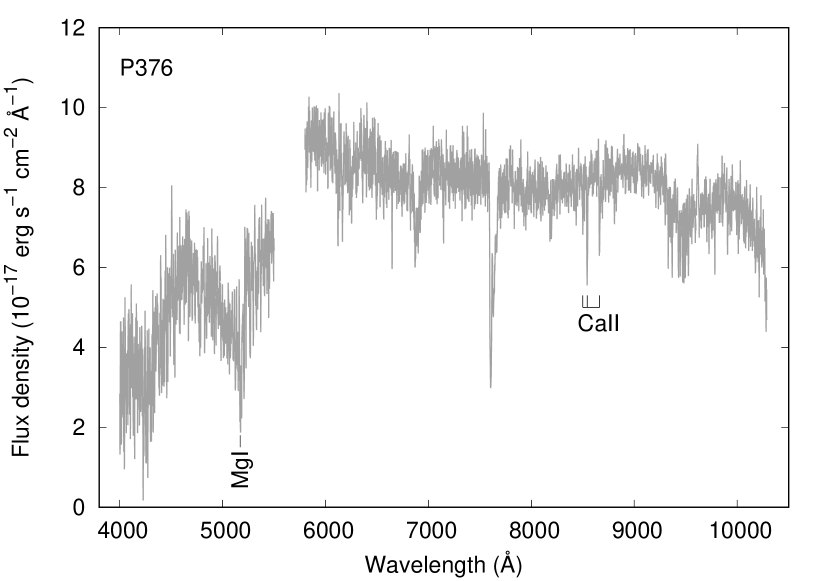
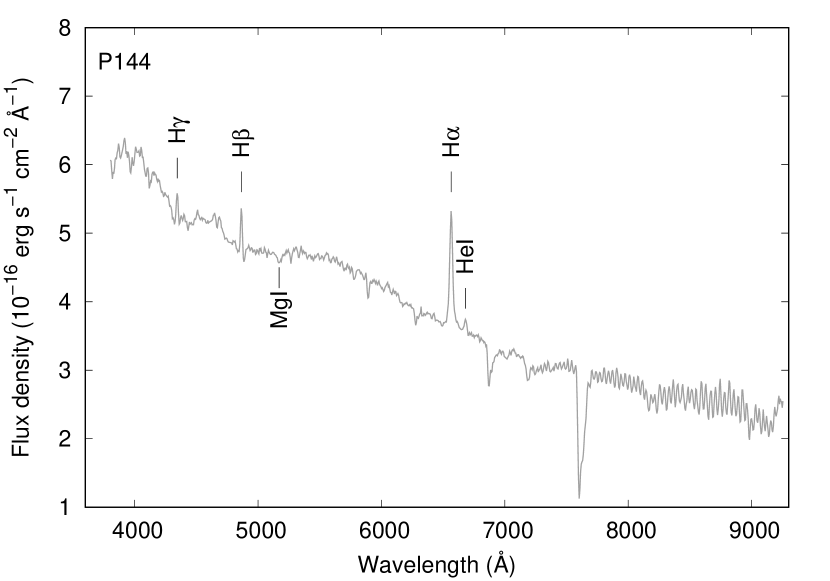
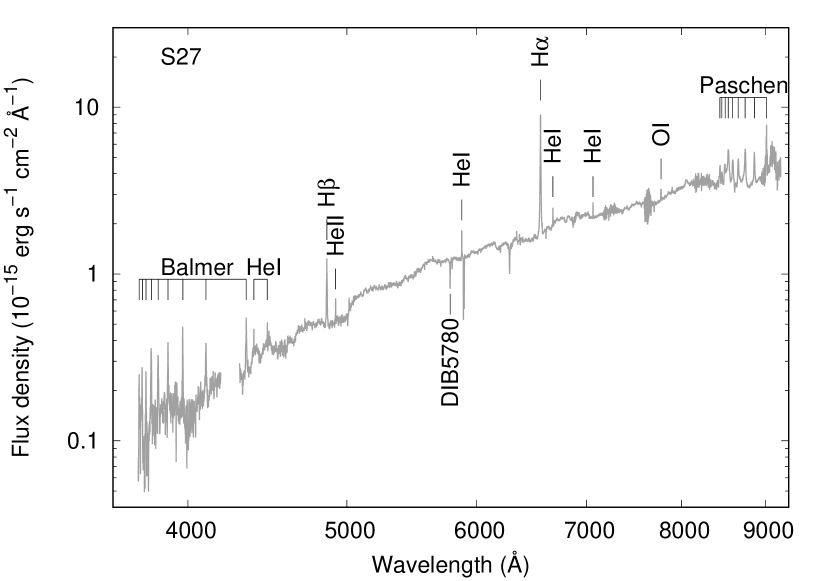
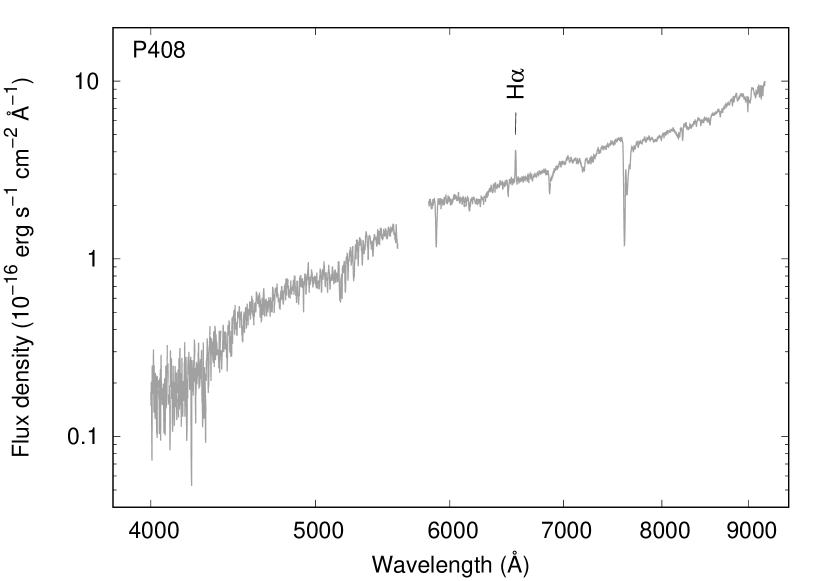
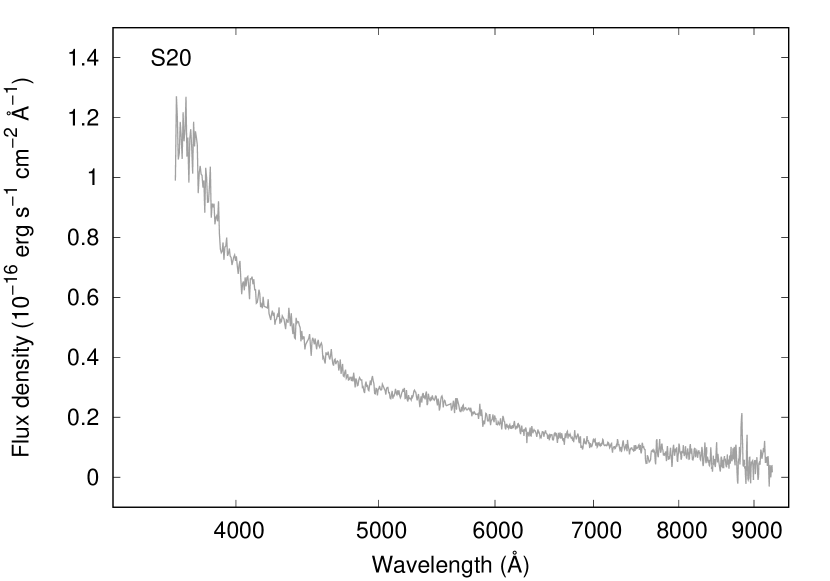
Figures 4 and 5 show the optical spectra from Lansbury et al. (2017) for the nine serendips that were not classified in the SIMBAD search described in Section 3. As detailed in Lansbury et al. (2017), the observations occurred at four different telescopes between 2013 December 5 and 2016 February 13. The spectra of P127, P144, P316, P497, and S20 are from the New Technology Telescope (NTT), where the ESO Faint Object Spectrograph and Camera (EFOSC2) was used. P376 and P408 were observed from the Keck telescope with the Low Resolution Imaging Spectrometer (LRIS). The spectrum of P194 came from the Double Spectrograph (DBSP) at Palomar, and S27’s spectrum was obtained with the Magellan Echellette (MagE) instrument. Here, we consider how the properties of the optical spectra as well as the X-ray properties constrain the nature of the sources. The spectra that appear to be dominated by stars are shown in Figure 4, and those that appear to be dominated by a disk (accretion or circumstellar) are shown in Figure 5.
The optical spectra of serendips P127 and P194 are dominated by absorption lines from a stellar photosphere, and spectral types can be estimated. For P127, the Mg Ib absorption line at 5172 Å is present but relatively weak, while the Balmer absorption lines are strong. These features suggest a mid-range spectral type, and we estimate that it may be an F-type star. Serendip P194 clearly shows the TiO bands as well as a very red continuum, and both of these characteristics are diagnostic of an M-type star. While it is clear that the strongest contribution to the optical spectra of these serendips is the star, it is unclear whether the X-rays come from stellar coronal activity, either from an isolated star or an active binary (AB, e.g., Dempsey et al., 1993; Franciosini et al., 2003) or if there is an accreting binary companion (e.g., a white dwarf). For P127, the only evidence that there might be an accreting companion is the fact that it is detected in the 3–8 keV band. The evidence for an accretor is a little stronger for P194 because the NuSTAR spectrum is relatively hard, and the source is detected in the 8–24 keV band (see Figure 3). It is also possible that P194 is a symbiotic binary with a giant star and a compact object as it is now well-established that many symbiotics with white dwarf companions produce X-ray emission (e.g., Luna et al., 2013). However, in our case, we cannot conclusively determine the luminosity class of the M-type star in P194. We conclude that serendips P127 and P194 are isolated stars, ABs, or CVs, and we note that symbiotics with white dwarfs would fall in the class of CVs.
Serendip P497 appears to be intermediate in temperature between P127 and P194. Although extinction is very low in its direction ( = –72∘), it has a redder continuum than P127 and also a stronger Mg Ib line. Thus, serendip P497 appears to be dominated by a star with a K or G spectral type. While serendip P497 is only detected in the 3–8 keV band and the X-ray spectrum is relatively soft (see Figure 3), there is some evidence in the optical spectrum for an H emission line. The presence of an optical emission line could indicate a contribution from an accretion disk, suggesting the possibility that this source is a CV. However, some ABs show H in emission (Montes et al., 1997), so this is also a possibility.
Although the statistical quality of the optical spectra for serendips P316 and P376 are lower, they also appear to be dominated by stellar photospheres. The optical spectrum of P316 looks extremely similar to P497 in terms of the redness of the continuum and the strength of the Mg Ib line. The Mg Ib line has approximately the same strength in P376; thus, P316, P376, and P497 may all have K or G spectral types. Serendips P316 and P376 are only detected in the 3–8 keV band, but the constraints on the hardness of their X-ray spectra are weak (see Figure 3). These two serendips also could be isolated stars, ABs, or CVs.
Serendips P144, S27, and P408 all have Balmer emission lines in their optical spectra, and Table 5 lists the central wavelengths, the equivalent widths, and the fluxes for the optical emission lines detected. The lines provide evidence for the presence of an accretion disk (and thus a compact companion) or circumstellar material (and possibly a compact companion). For P144, the optical spectrum also has a Mg Ib line, suggesting that it does not harbor a high-mass star. Thus, we suggest that this source is either a CV or an LMXB. However, serendips S27 and P408 are both HMXB candidates. They are located in the Galactic plane with = –0.6∘ and , respectively, and both show strong extinction. S27 has a very strong H emission line, which is suggestive of a Be star and possibly a Be X-ray binary with a neutron star or a black hole. For P408, the H line is weaker, but the continuum is very similar to S27. While S27 is detected in the 8–24 keV band, serendip P408 is not; thus, S27 is a somewhat stronger HMXB candidate.
Finally, S20 is unique among this group in having a very blue spectrum and no narrow emission or absorption features. Although weak lines might be uncovered if a spectrum with higher signal-to-noise were obtained, the existing spectrum suggests that S20’s optical emission is dominated by thermal emission from an accretion disk. If the spectrum does lack hydrogen emission lines, then one possible explanation might be that the donor star is a hydrogen-poor white dwarf. In this scenario, the system might be an ultracompact X-ray binary (UCXB), and we note that the optical spectrum of S20 is very similar to the UCXB 4U 1246–58 (in’t Zand et al., 2008). S20 also has very low extinction, which is not surprising given the fact that it is somewhat away from the Galactic plane at . Its distance and luminosity are difficult to constrain, but the fact that its 8–24 keV flux is high ( erg cm-2 s-1) may require the presence of a neutron star or black hole accretor. Also, the dominance of the accretion disk in the optical indicates that the donor star is not luminous and that the source is not an HMXB. The source may be an LMXB, but we cannot rule out the possibility that it is a CV.
6. X-ray Spectroscopy for the Serendips with Optical Emission Lines
The serendips that are most likely to contain compact objects are those exhibiting accretion disk signatures in their optical spectra. Considering our nine serendips in this context, there are three types. The first type includes S20, which has an optical spectrum with no lines at all, and we argue above that we are likely seeing thermal emission from a hydrogen-poor accretion disk. The second type includes sources with optical absorption lines but no emission lines. Although these sources could have compact objects, they could also be isolated stars or ABs. The third type is serendips with optical emission lines, and these lines are most likely to originate in an accretion disk around a compact object or in a circumstellar disk around a Be star. Although isolated Be stars and possibly Be white dwarf systems exist, a major class of HMXBs are Be X-ray binaries.
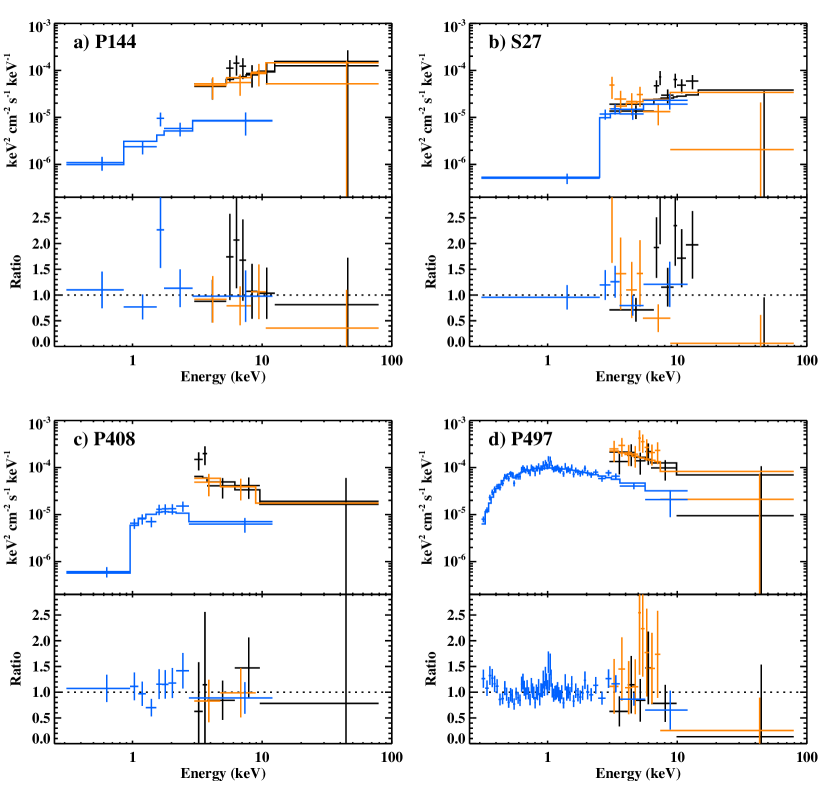
Here, we focus on the third type because it may be possible to use the NuSTAR and archival XMM-Newton spectra to distinguish between the CV, LMXB, and HMXB possibilities. We consider the three sources that have clear optical emission lines (P144, S27, and P408) as well as P497, which may have weak H in emission. Most CVs that emit hard X-rays are likely to have X-ray spectra that are dominated by an optically thin plasma emitting thermal bremsstrahlung (Krivonos et al., 2007). Although expectations for LMXBs depend on whether the compact object is a neutron star or a black hole both have distinguishing X-ray features: most quiescent neutron star LMXBs have a low temperature (0.1 keV) blackbody component, and quiescent black hole LMXBs simply have a power-law spectrum with a photon index of –2 (Plotkin et al., 2013). Most HMXBs host highly magnetized neutron stars with hard X-ray spectra .
We used data from the NuSTAR ObsIDs listed in Table 6 to produce 3–79 keV energy spectra for Focal Plane Modules A and B (FPMA and FPMB). Using nuproducts, we extracted source spectra from circular regions with radii centered on the positions given in Table 1. Given that the serendips are in the fields of relatively bright sources, the background for the serendip includes photons from the PSF wings of the bright sources as well as the normal instrumental background. To estimate background, we extracted counts from an annulus centered on the bright target source. We set the inner and outer radii of the annulus to match the serendip source region but removed any parts of the annulus within of the serendip. In addition to the source and background spectra, the nuproducts routine produces the instrument response files. For S27, there are multiple observations, and we combined spectra from different ObsIDs using addspec.
To extend the coverage to lower energies, we searched the XMM-Newton archive for observations that include the serendips with optical emission lines (P144, S27, P408, and P497) in their fields of view. For the four sources, there are, respectively, 1, 8, 1, and 2 observations. Information about the XMM observations that we used is provided in Table 6. We used all the available data for P144, P408, and P497, and the longest of the eight observations for S27. We analyzed the data from the EPIC/pn instrument, which covers the 0.3–12 keV bandpass and has the highest effective area of the XMM-Newton instruments (Strüder et al., 2001). We used the Science Analysis Software (SAS) to extract source spectra from a circular aperture with a radius of for the first three sources and a radius of for P497. The fact that P497 is brighter is the reason that the larger radius is used. We extracted background spectra from a source-free rectangular region in another part of the field of view, and then used rmfgen and arfgen to make the instrument response files.
As indicated in Table 6, the XMM and NuSTAR observations for P144, S27, P408, and P497 were separated by 7, 2, 4, and 0.3 years, respectively. Thus, as the XMM and NuSTAR bands overlap, this analysis also provides information about the long-term X-ray variability of these sources. While the XMM and NuSTAR observations were not simultaneous, the Swift satellite obtained soft X-ray coverage that was near-simultaneous with the NuSTAR observations. We have also produced spectra from the Swift X-ray Telescope (Burrows et al., 2005), and the ObsIDs and exposure times used are listed in Table 6. Due to the relatively short observations, the fact that the sources are faint, and the smaller effective area of Swift, the statistical quality of the data is low. Thus, we use them only as a check on source variability.
We used the XSPEC v12.9.0n software package to fit the NuSTAR and XMM spectra, starting with a simple absorbed power-law model. To model the absorption, we used the tbabs model with Wilms et al. (2000) abundances and Verner et al. (1996) cross sections. Although FPMA and FPMB typically have normalizations that are different by a few percent, our spectra do not have high enough statistical quality to be sensitive to differences at this level, and we set the FPMA/FPMB cross-normalization parameter to be 1.0. However, due to possible variability, we allowed the overall pn normalization to be different than NuSTAR, and this is given as in Table 7. The power-law model provides a good description of the P144 and P408 spectra and somewhat worse fits to the S27 and P497 spectra. Despite the lower quality of the fits for the latter two sources, the power-law parameters demonstrate that P144 and S27 have intrinsically hard spectra with photon indices of and , respectively (90% confidence errors), compared to and for P408 and P497, respectively. The difference in hardness is clear from an inspection of the energy spectra (Figure 6). The spectra also reveal that the column density is highest for S27, intermediate for P408, and lowest for P144 and P497. We also report values for fits with an absorbed bremsstrahlung model in Table 7. The differences in the values are not significant, meaning that none of the spectra allow us to distinguish between the two models. The high temperatures for P144 and S27 simply confirm that these are hard spectra, while the lower values of 2 keV for P408 and P497 may indicate that we are seeing thermal emission at the measured temperatures.
For P497, the spectrum shows positive residuals between 0.9 and 1.2 keV, and adding a Gaussian improves the fit statistic significantly from to . The parameters of the Gaussian are constrained to keV, keV, and ph cm-2 s-1. The equivalent width (EW) of the feature is 60 eV. The presence of emission lines in this regime is consistent with the interpretation of the spectrum as being from an optically thin thermal plasma with a temperature near 2 keV as strong emission lines from Fe XXII, Fe XXIII, Fe XXIV, and Ne X are all expected. An iron line near 6.4–6.7 keV might also be anticipated, but the quality of the spectrum is not sufficient to determine whether such a line is present.
Figure 6 shows strong variability for P144, P408, and P497, and this is confirmed by the values. P144 and P408 were brighter by a factor of 7 when NuSTAR observed them, and P497 was brighter by 4–5 times. To confirm the interpretation that this is caused by long-term variability, we added the near-simultaneous Swift/XRT data and refit the spectra with the absorbed power-law model. The values of are given in Table 7, and they are consistent with unity for P144, P408, and P497. Suprisingly, S27, which is the one source that did not show evidence for long-term variability, has a value of (90% confidence upper limit). As the Swift and NuSTAR observations were not strictly simultaneous, this may indicate that S27 shows short-term variability.
Considering the information from the optical and X-ray spectra, it is likely that P497 is a CV. This classification is based on the evidence for a low-mass companion star in the optical spectrum along with the evidence that the X-ray emission is coming from a plasma with a temperature of 2 keV. Especially with the weak optical emission lines, an AB nature is still a possibility for P497. However, ABs usually show evidence for two temperature thermal emission, and they often have low coronal metallicity, making it less likely that an emission line at 1 keV would be present (Franciosini et al., 2003). For S27, the hardness of the X-ray spectrum is consistent with an HMXB nature, so this source remains an HMXB candidate (further evidence in favor of an HMXB nature is discussed in Section 7.2). For P408, the X-ray continuum is very similar to P497, suggesting a CV nature. Although the P408 optical continuum matches best with S27, this is probably due to the extinction being similar for the two sources rather than indicating that they are intrinsically similar. While we cannot rule out an X-ray binary nature for P408, we consider it more likely to be a CV. P144 is a good candidate for being an LMXB. If the source is in quiescence, then the fact that we do not see a low temperature blackbody component in the spectrum, which would be expected for neutron star LMXB, may suggest that it is a black hole LMXB. However, it is also possible that P144 is a CV with a high bremsstrahlung temperature.
7. Discussion
Table 8 provides a summary of the classifications or possible classifications for all 16 of the serendips. Although there is some uncertainty about the classification for many of the sources, the identifications include: 8 stars (although some of these may have binary companions); 4 CVs or CV candidates (P82 and P98 are confirmed, P497 is likely, and P408 is a candidate); 2 LMXB candidates (P144 and S20); an HMXB (S43); and an HMXB candidate (S27). In the following, we discuss these groups and the implications for the faint end of the Galactic hard X-ray source population. We also discuss the fact that, at this stage, the survey is incomplete, and there are biases against some source types.
7.1. Stars, CVs, and LMXBs
For the 8 stars, the classifications either come from the SIMBAD database (for S1, P146, S37, and P340) or the optical spectra we show in this work (for P127, P194, P316, and P376). However, especially because they are X-ray emitters, we cannot rule out the possibility that some of them have binary companions, which could either be another star (i.e., they may be active binaries, ABs) or a white dwarf (WD). In three cases, parallax distances are available in the Gaia Data Release 1 catalog (Brown et al., 2016; Prusti et al., 2016): S1, P146, and P340 have distances of pc, pc, and pc, respectively. Thus, S1 and P340 are very nearby, and they may not require a binary companion to produce the observed X-rays. For S1, the 3–8 keV flux measured by NuSTAR is erg cm-2 s-1, which corresponds to a luminosity of erg s-1. For P340, the 3–8 keV flux is erg cm-2 s-1, and the luminosity is erg s-1. On the other hand, for P146, the 3–8 keV flux of erg cm-2 s-1 implies erg s-1, which either requires an early spectral type (i.e., a high mass star) or a binary companion.
In the strict sense of this study as a 8–24 keV survey, we only detect one star (P194), but it should be noted that P194 is in a part of the sky that received a large amount of exposure time (216 ks), and all of the other stars have 8–24 keV flux upper limits which are higher than the P194 flux. Despite this difference in exposure time, the fact remains that we know that P194 is a hard X-ray emitter. While some isolated M-type stars may produce soft X-ray emission (Hunsch et al., 1998), the hard X-ray emission from P194 (see Figure 3) probably indicates the presence of a binary companion. In Section 5, we discussed the possibility that P194 is a symbiotic. Such systems are known to produce hard X-ray emission (Kennea et al., 2009), and there are also cases where the optical emission lines from such systems are very weak (Mukai et al., 2016).
For the CVs, P82 was previously known to be the soft X-ray source RX J0425.6–5714. Being a polar-type, the spin of its white dwarf is synchronized to its orbit, and the period is 1.43 hr (Ritter & Kolb, 2003). As polars are generally relatively soft X-ray sources, it may be somewhat surprising that NuSTAR strongly detects the source at erg cm-2 s-1 in the 8–24 keV band (Figure 3); however, even higher-energy emission from polars is not unprecedented (Barlow et al., 2006). Given the high Galactic latitude of = –42∘, the source may be relatively nearby, but no distance estimate is available for RX J0425.6–5714. P98 is the CV V1193 Ori with an orbital period of 3.96 hr. Prior to NuSTAR, the only X-ray information published on V1193 Ori was a very weak ROSAT detection of its soft X-ray flux (Verbunt et al., 1997). Its distance is constrained to be 470 pc (Ringwald et al., 1994); thus, the 3–8 keV flux of erg cm-2 s-1 corresponds to a luminosity of erg s-1. For P497, the evidence that the X-ray spectrum is due to a 2 keV thermal plasma makes it likely that this source is a CV. The optical spectrum is dominated by a K or G type star, allowing for us to make a rough distance estimate. We assume that the spectral type is K0 V, which indicates an absolute magnitude of (Cox, 2000). The column density from the X-ray spectrum is cm-2 (Table 7), and this corresponds to (Güver & Özel, 2009). Table 3 lists an -band magnitude of 12.49, and – for a K0 V star, leading to an estimate of , and we calculate a distance of pc. Given the Galactic latitude of = –72∘, a much larger distance than this would be surprising (Revnivtsev et al., 2008). Thus, the unabsorbed 2–10 keV flux of erg cm-2 s-1 (Table 7) corresponds to a luminosity of erg s-1, which is reasonable for a CV, but is also possible for an AB (Sazonov et al., 2006).
While P144 and S20 may also be CVs, they are the only sources in this study for which an LMXB nature is equally (or perhaps marginally more) plausible. Although their optical spectra are different in that P144 has emission lines and S20 does not, we argue that both are dominated by emission from an accretion disk (possibly due to S20 being an UCXB transferring hydrogen-poor material). However, as we do not know the sizes of the accretion disks, the absolute magnitudes of P144 and S20 are unknown. For P144, the upper limit on the measured column density is cm-2, which is little help in constraining the distance to the source since the column density through the Galaxy along the line of sight to P144 (, = –4.66∘) is cm-2 (Kalberla et al., 2005). If P144 was a black hole LMXB in outburst, the accretion disk would account for all of the optical light; however, the fact that we see the Mg Ib line suggests that there is still a small contribution from the companion, and the putative black hole LMXB may be in or near quiescence. Black hole LMXBs in quiescence typically have X-ray luminosities between and erg s-1 (Garcia et al., 2001). For this range of luminosities, the unabsorbed 2–10 keV flux that we measure (Table 7) corresponds to a distance range of 0.2–7.5 kpc. While not at all constraining, this does show that P144 may plausibly be a quiescent black hole LMXB. As the vast majority of black hole LMXBs that we know of were discovered in outburst, the possibility that hard X-ray surveys may be able to find such systems in quiescence is highly significant. If S20 is a black hole or neutron star LMXB, it is certainly not in quiescence, and we will report on details of dedicated XMM and NuSTAR observations in a future paper.
7.2. HMXBs
A main result of this work is the discovery of the HMXB candidate S27, NuSTAR J105008–5958.8. Although to this point, we have focused on the HMXB evidence from the optical emission lines and the hard X-ray spectrum, another important feature is the diffuse interstellar band (DIB) 5780 Å absorption line (Figure 5). The EW of the line is Å, which corresponds to (Jenniskens & Desert, 1994) and, using , an optical extinction of . For this extinction and at the location of the source (, = –0.60∘), we use the Marshall et al. (2006) extinction maps to estimate a distance to S27 of 6–8 kpc. Although the source is from the Carina nebula, which is at a distance of 2.3 kpc, the larger distance for S27 indicates that they are not associated.
The distance estimate also allows us to determine the absolute optical magnitude and the X-ray luminosity. Convolving the flux values shown in Figure 5 with -band and -band filter profiles gives , which is near the USNO-B1.0 value (see Table 3), and . Combining this with the value and a distance of kpc gives = –, which is the absolute magnitude for the star and the circumstellar material combined. For Be X-ray binaries, there is a relationship between the H EW and the excess emission from the circumstellar material (Riquelme et al., 2012), and, for the S27 value of – Å, the correction is 0.3 magnitudes at -band. Thus, for the star alone, we estimate = –, which is consistent with main sequence star classifications between B2 and B3 (Cox, 2000) and our previous suggestion that the companion is a Be star. Concerning the X-rays, at a 2–10 keV unabsorbed flux of erg cm-2 s-1 and the 6–8 kpc distance range, the source luminosity is between erg s-1 and erg s-1. These luminosity values are higher than those that are seen for isolated B-type stars (e.g., Rauw et al., 2015), which, along with the fact that S27 is detected in the 8–24 keV band, strongly favors the presence of a compact object in the system. However, we still consider S27 to be an HMXB candidate (rather than a certain HMXB) because we cannot necessarily rule out the possibility that it is a colliding wind binary. Also, we consider below whether S27 may be a Cas analog (Shrader et al., 2015; Motch et al., 2015).
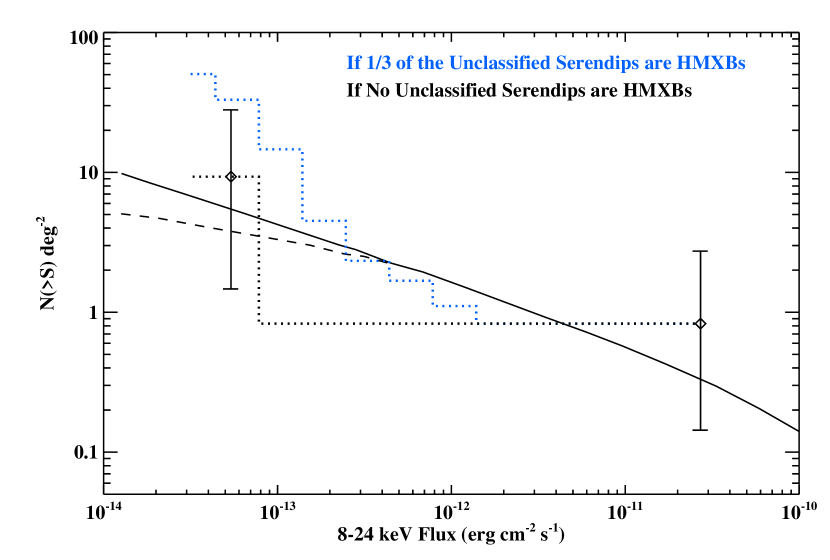
As constraining the faint end of the HMXB population is a goal of the NuSTAR Galactic surveys (Harrison et al., 2013), we discuss our HMXB results in the larger context of the luminosity function and surface density (log-log) for HMXBs in the Galaxy. Lutovinov et al. (2013) show that, with the INTEGRAL survey being complete for persistent HMXBs down to erg cm-2 s-1 (17–60 keV), the surface density is relatively well-constrained down to this level (although it is not uniform across the Galaxy). However, there is significant uncertainty below this level. Figure 7 shows predictions for the log-log (from Lutovinov et al., 2013) for what we might see by extending the HMXB search to lower flux levels. The dashed curve corresponds to a case where the luminosity curve flattens below erg s-1 as predicted for wind-fed accretion in HMXBs due to the fact that the minimum in the stellar mass distribution (8–10 for HMXBs) leads to a minimum in the mass transfer rate from the wind (Castor et al., 1975) and, thus, the luminosity (Lutovinov et al., 2013). At a flux of erg cm-2 s-1, this causes a drop in the number of HMXBs per square degree by a factor of 2 over a simple extrapolation of the slope at higher luminosities. In fact, the Lutovinov et al. (2013) model leaves out other physics, such as the possible impact of the propeller mechanism (Illarionov & Sunyaev, 1975), which could cause the surface density to drop even lower than the dashed curve. Although the curves from Lutovinov et al. (2013) are for the 17–60 keV band, we converted them to 8–24 keV using the spectral parameters reported in Coburn et al. (2002) for ten HMXBs. The mean of the 8–24 keV fluxes is 1.23 times larger than the mean of the 17–60 keV fluxes, and we shifted the curves by that amount.
In our study, S43 is a definite HMXB (e.g., Krivonos et al., 2015) with an 8–24 keV flux of erg cm-2 s-1, and S27 is a strong HMXB candidate with an 8–24 keV flux of erg cm-2 s-1 (Table 7). Although these are only two sources, we can still use this information to make a log-log plot and compare it to the predictions. We use the same approach that we used for our earlier Chandra study of the Norma spiral arm region. Equation 15 of Fornasini et al. (2014) depends on the sky coverage as a function of flux. Given that HMXBs are strongly clustered in the Galactic plane, we use the sky coverage within of the plane (see Figure 2). We assume that the probability functions are delta functions at the fluxes of S27 and S43. The Poisson errors are much larger than the uncertainty introduced by these approximations. Figure 7 compares the log-log for the two sources with 68% confidence Poisson errors to the curves from Lutovinov et al. (2013), and the measurements are consistent with both curves.
One factor that must be considered in the interpretation of the log-log is the incompleteness of the source classifications. In total, there are 30 serendips within of the Galactic plane detected in the 8–24 keV band. However, only six of these have been classified, including S27 and S43. Thus, we have produced completeness-corrected log-log curves using the fluxes of the 24 unclassified sources, and making two different assumptions about how many of them are HMXBs. One possibility is that none of them are HMXBs, leaving just S27 and S43 (see Figure 7). Motivated by the prevalence of HMXBs in the classified group (two of six), we also consider the possibility that 1/3 of the unclassified serendips (eight of 24) are HMXBs, and that is also shown in Figure 7. To produce the blue dotted curve, we used the following, which is similar to Equation 15 from Fornasini et al. (2014),
| (1) |
where are the probabilities that each source is an HMXB. Thus, for the 8–24 keV fluxes, , of S27 and S43, and for the 8–24 keV fluxes of the other 24 sources. Also, is the sky coverage for as shown in Figure 2. The resulting curve indicates that the surface density of faint HMXBs below erg cm-2 s-1 could be several times higher than the Lutovinov et al. (2013) predictions. However, if none or only a couple of the unclassified sources are HMXBs, then the surface density may be consistent with the predictions. Determining the nature of a large fraction of the 24 unclassified serendips would provide a definitive comparison.
In addition to classifying more of the serendips in the Galactic plane, it is also important to learn more about S27 (NuSTAR J105008–5958.8). The HMXBs considered by Lutovinov et al. (2013) in their study of the surface density and luminosity function were persistent systems. While many of the Lutovinov et al. (2013) HMXBs are persistent Be systems, a large fraction of the known Be systems are transient. In quiescence, the transient Be systems can have either hard power-law or soft blackbody spectra (Tsygankov et al., 2017). Thus, while the fact that S27 has a power-law spectrum does not distinguish between it being transient or persistent, it may be an indication that accretion onto a compact object is occurring.
S27 has some properties in common with the Cas binary system. Cas as well as about ten Cas analogs produce hard X-ray emission, but its origin is still debated. Cas is composed of a Be star in 203.6 day orbit with a white dwarf or possibly a neutron star. The hard X-ray emission may come from accretion onto the compact object, but it may also be produced by magnetic interactions between the Be star and its circumstellar disk (Shrader et al., 2015; Motch et al., 2015). In the neutron star scenario, the low X-ray luminosity may be explained if the rotation rate of the neutron star is high enough to centrifugally inhibit accretion. Postnov et al. (2017) recently considered such a scenario for Cas where the X-rays come from a hot shell of material accumulated outside the neutron star’s magnetosphere.
7.3. Survey Incompleteness
In considering the results related to Galactic hard X-ray populations, we must keep in mind that this study has only included sources with identifications via optical spectroscopy. For the full coverage area, of the 497 detected NuSTAR sources (in the 3–24 keV band for the primary catalog only), identifications were obtained for 276 sources, making the completeness fraction 56%. The main reasons why sources are not identified include: 1. the possibility that the NuSTAR source is spurious; 2. optical source confusion in crowded regions (indicated for many sources in Table 6 of Lansbury et al., 2017); 3. intrinsic faintness in the optical; 4. faintness of sources in the optical due to interstellar absorption; 5. lack of a soft X-ray counterpart, which could either be due to variability or the lack of deep enough X-ray coverage. While there is a 1–8 ks Swift/XRT observation with nearly every NuSTAR observation, the short XRT observations are not always deep enough to detect the faint sources.
The completeness levels strongly depend on Galactic latitude from 63% (261 identified out of 415) for sources that are more than away from the plane to 32% (8 identified out of 25) for sources that are 5–10∘ away, to 12% (7 identified out of 57) for sources within of the plane. The low fraction of identified sources close to the plane is consistent with the fact that there is more crowding and more extinction there. As stars and CVs are relatively nearby and are spread across latitudes, the incompleteness fractions suggest that we might find a factor of 2 more of these with a complete survey. However, the actual number is probably smaller since isolated stars that are bright enough to be detected by NuSTAR are very bright in the optical and are not likely to be missed (unless there is a lack of soft X-ray coverage), and CVs are also relatively bright in the optical.
At low Galactic latitudes, especially within of the plane, the small completeness fraction (12%) raises the question of what source types remain unidentified in the Galactic plane. Figure 2 shows that the serendip coverage in this region is very similar to the Norma coverage, and, for Norma, we estimated that about eight of the detected sources are AGN (Fornasini et al., 2017). Another source type to consider is magnetars, which are highly magnetized isolated neutron stars. Magnetars are so faint in the optical that there is no chance that any of these would be included in our study, but they could be detected by NuSTAR. In fact, we do know that one of the sources in the Lansbury et al. (2017) catalog, NuSTAR J183452–0845.6 (P420), is the magnetar Swift J1834.9–0846. Finally, as discussed in Section 7.2, a major question for our study is how many HMXBs we might be missing.
8. Conclusions and Future Work
The results presented here give a first systematic look at the Galactic sources that are being found in the NuSTAR serendipitous survey. As we have included 16 sources from all Galactic latitudes, it is not surprising that a relatively large fraction (11 out of 16) of the sources are stars or CVs. In addition, as this is a study of Galactic hard X-ray populations, we consider all detected sources other than the target of the observation, and this leads to the inclusion of some previously known sources such as the HMXB 2RXP J130159.6–635806 and the CVs V1193 Ori and RX J0425.6–5714. However, the survey has also uncovered new sources. NuSTAR J073959–3147.8 (P144) is an LMXB candidate with an X-ray spectrum that is well-described by a relatively hard power-law. If the system is a quiescent LMXB, the lack of a thermal blackbody component in the spectrum favors a black hole accretor over a neutron star. It is an important development if NuSTAR can help us pick out quiescent BH systems since there should be a large number of these. NuSTAR J092418–3142.2 (S20) is the brightest serendip, but the source has never been studied previously. We conclude that it is either an LMXB (possibly a UCXB) or a CV, and we will report on a dedicated XMM-Newton and NuSTAR observation of the source in an upcoming paper.
The discovery of the HMXB candidate NuSTAR J105008–5958.8 (S27) is especially interesting because of the possibility that there is a large population of faint HMXBs in the Galaxy. In addition to further studies of this source, potentially to determine its orbital period, the classifications of the NuSTAR serendips are especially incomplete in the Galactic plane, and determining the nature of the 24 serendips within of the plane would allow us to determine if the surface density of HMXBs is consistent with the predictions of Lutovinov et al. (2013). The work on searching for HMXBs in the Norma region is also on-going. The sky coverage for Norma is very similar to the Serendipitous survey coverage in the Galactic plane (see Figure 2), and there are three HMXB candidates in the Norma region (Rahoui et al., 2014; Fornasini et al., 2017). The nature of these HMXB candidates still requires confirmation, and we have an approved near-IR spectroscopy program to search for orbital motion. With continued effort on classifying sources from both the Serendipitous and Norma surveys, it will be possible to combine the results and stongly constrain the surface density of HMXBs in the Galaxy.
References
- Abbott et al. (2016) Abbott, B. P., Abbott, R., Abbott, T. D., et al. 2016, Physical Review Letters, 116, 061102
- Aird et al. (2015) Aird, J., Alexander, D. M., Ballantyne, D. R., et al. 2015, ApJ, 815, 66
- Ajello et al. (2012) Ajello, M., Alexander, D. M., Greiner, J., et al. 2012, ApJ, 749, 21
- Alexander et al. (2013) Alexander, D. M., Stern, D., Del Moro, A., et al. 2013, ApJ, 773, 125
- Barlow et al. (2006) Barlow, E. J., Knigge, C., Bird, A. J., et al. 2006, MNRAS, 372, 224
- Bird et al. (2016) Bird, A. J., Bazzano, A., Malizia, A., et al. 2016, ApJS, 223, 15
- Bond et al. (1987) Bond, H. E., Grauer, A. D., Burstein, D., & Marzke, R. O. 1987, PASP, 99, 1097
- Brorby et al. (2016) Brorby, M., Kaaret, P., Prestwich, A., & Mirabel, I. F. 2016, MNRAS, 457, 4081
- Brown et al. (2016) Brown, A. G. A., Vallenari, A., Prusti, T., et al. 2016, A&A, 595, A2
- Burrows et al. (2005) Burrows, D. N., Hill, J. E., Nousek, J. A., et al. 2005, Space Science Reviews, 120, 165
- Castor et al. (1975) Castor, J. I., Abbott, D. C., & Klein, R. I. 1975, ApJ, 195, 157
- Civano et al. (2015) Civano, F., Hickox, R. C., Puccetti, S., et al. 2015, ApJ, 808, 185
- Coburn et al. (2002) Coburn, W., Heindl, W. A., Rothschild, R. E., et al. 2002, ApJ, 580, 394
- Cox (2000) Cox, A. N., 2000, Allen’s astrophysical quantities, 4th ed. Publisher: New York: AIP Press; Springer; Edited by Arthur N. Cox.
- Dempsey et al. (1993) Dempsey, R. C., Linsky, J. L., Schmitt, J. H. M. M., & Fleming, T. A. 1993, ApJ, 413, 333
- Evans et al. (2010) Evans, I. N., Primini, F. A., Glotfelty, K. J., et al. 2010, ApJS, 189, 37
- Evans et al. (2014) Evans, P. A., Osborne, J. P., Beardmore, A. P., et al. 2014, ApJS, 210, 8
- Fornasini et al. (2014) Fornasini, F. M., Tomsick, J. A., Bodaghee, A., et al. 2014, ApJ, 796, 105
- Fornasini et al. (2017) Fornasini, F. M., Tomsick, J. A., Hong, J., et al. 2017, ApJS, 229, 33
- Franciosini et al. (2003) Franciosini, E., Pallavicini, R., & Tagliaferri, G. 2003, A&A, 399, 279
- Garcia et al. (2001) Garcia, M. R., McClintock, J. E., Narayan, R., et al. 2001, ApJ, 553, L47
- Güver & Özel (2009) Güver, T., & Özel, F. 2009, MNRAS, 400, 2050
- Halpern et al. (1998) Halpern, J. P., Leighly, K. M., Marshall, H. L., Eracleous, M., & Storchi-Bergmann, T. 1998, PASP, 110, 1394
- Harrison et al. (2013) Harrison, F. A., Craig, W. W., Christensen, F. E., et al. 2013, ApJ, 770, 103
- Hong et al. (2016) Hong, J., Mori, K., Hailey, C. J., et al. 2016, ApJ, 825, 132
- Hunsch et al. (1998) Hunsch, M., Schmitt, J. H. M. M., Schroder, K.-P., & Zickgraf, F.-J. 1998, A&A, 330, 225
- Illarionov & Sunyaev (1975) Illarionov, A. F., & Sunyaev, R. A. 1975, A&A, 39, 185
- in’t Zand et al. (2008) in’t Zand, J. J. M., Bassa, C. G., Jonker, P. G., et al. 2008, A&A, 485, 183
- Jenniskens & Desert (1994) Jenniskens, P., & Desert, F.-X. 1994, A&AS, 106, 39
- Kalberla et al. (2005) Kalberla, P. M. W., Burton, W. B., Hartmann, D., et al. 2005, A&A, 440, 775
- Kennea et al. (2009) Kennea, J. A., Mukai, K., Sokoloski, J. L., et al. 2009, ApJ, 701, 1992
- Krivonos et al. (2007) Krivonos, R., Revnivtsev, M., Churazov, E., et al. 2007, A&A, 463, 957
- Krivonos et al. (2012) Krivonos, R., Tsygankov, S., Lutovinov, A., et al. 2012, A&A, 545, A27
- Krivonos et al. (2015) Krivonos, R. A., Tsygankov, S. S., Lutovinov, A. A., et al. 2015, ApJ, 809, 140
- Lansbury et al. (2017) Lansbury, G. B., Stern, D., Aird, J., et al. 2017, ApJ, 836, 99
- Luna et al. (2013) Luna, G. J. M., Sokoloski, J. L., Mukai, K., & Nelson, T. 2013, A&A, 559, A6
- Lutovinov et al. (2013) Lutovinov, A. A., Revnivtsev, M. G., Tsygankov, S. S., & Krivonos, R. A. 2013, MNRAS, 431, 327
- Marshall et al. (2006) Marshall, D. J., Robin, A. C., Reylé, C., Schultheis, M., & Picaud, S. 2006, A&A, 453, 635
- Mineo et al. (2012) Mineo, S., Gilfanov, M., & Sunyaev, R. 2012, MNRAS, 419, 2095
- Montes et al. (1997) Montes, D., Fernandez-Figueroa, M. J., de Castro, E., & Sanz-Forcada, J. 1997, A&AS, 125
- Motch et al. (2015) Motch, C., Lopes de Oliveira, R., & Smith, M. A. 2015, ApJ, 806, 177
- Mukai et al. (2016) Mukai, K., Luna, G. J. M., Cusumano, G., et al. 2016, MNRAS, 461, L1
- Mullaney et al. (2015) Mullaney, J. R., Del-Moro, A., Aird, J., et al. 2015, ApJ, 808, 184
- Plotkin et al. (2013) Plotkin, R. M., Gallo, E., & Jonker, P. G. 2013, ApJ, 773, 59
- Postnov et al. (2017) Postnov, K., Oskinova, L., & Torrejón, J. M. 2017, MNRAS, 465, L119
- Pretorius & Knigge (2012) Pretorius, M. L., & Knigge, C. 2012, MNRAS, 419, 1442
- Prusti et al. (2016) Prusti, T., de Bruijne, J. H. J., Brown, A. G. A., et al. 2016, A&A, 595, A1
- Rahoui et al. (2014) Rahoui, F., Tomsick, J. A., Fornasini, F. M., Bodaghee, A., & Bauer, F. E. 2014, A&A, 568, A54
- Rauw et al. (2015) Rauw, G., Nazé, Y., Wright, N. J., et al. 2015, ApJS, 221, 1
- Revnivtsev et al. (2008) Revnivtsev, M., Sazonov, S., Krivonos, R., Ritter, H., & Sunyaev, R. 2008, A&A, 489, 1121
- Ringwald et al. (1994) Ringwald, F. A., Thorstensen, J. R., & Hamwey, R. M. 1994, MNRAS, 271, 323
- Riquelme et al. (2012) Riquelme, M. S., Torrejón, J. M., & Negueruela, I. 2012, A&A, 539, A114
- Ritter & Kolb (2003) Ritter, H., & Kolb, U. 2003, A&A, 404, 301
- Rosen et al. (2016) Rosen, S. R., Webb, N. A., Watson, M. G., et al. 2016, A&A, 590, A1
- Sazonov et al. (2006) Sazonov, S., Revnivtsev, M., Gilfanov, M., Churazov, E., & Sunyaev, R. 2006, A&A, 450, 117
- Shrader et al. (2015) Shrader, C. R., Hamaguchi, K., Sturner, S. J., et al. 2015, ApJ, 799, 84
- Strüder et al. (2001) Strüder, L., Briel, U., Dennerl, K., et al. 2001, A&A, 365, L18
- Sugizaki et al. (2001) Sugizaki, M., Mitsuda, K., Kaneda, H., et al. 2001, ApJS, 134, 77
- Tsygankov et al. (2017) Tsygankov, S. S., Wijnands, R., Lutovinov, A. A., Degenaar, N., & Poutanen, J. 2017, arXiv:1703.04634, submitted to MNRAS
- Verbunt et al. (1997) Verbunt, F., Bunk, W. H., Ritter, H., & Pfeffermann, E. 1997, A&A, 327, 602
- Verner et al. (1996) Verner, D. A., Ferland, G. J., Korista, K. T., & Yakovlev, D. G. 1996, ApJ, 465, 487
- Voss & Ajello (2010) Voss, R., & Ajello, M. 2010, ApJ, 721, 1843
- Walter et al. (2015) Walter, R., Lutovinov, A. A., Bozzo, E., & Tsygankov, S. S. 2015, A&A Rev., 23, 2
- Wenger et al. (2000) Wenger, M., Ochsenbein, F., Egret, D., et al. 2000, A&AS, 143, 9
- Wilms et al. (2000) Wilms, J., Allen, A., & McCray, R. 2000, ApJ, 542, 914
| Serendip | NuSTAR | RA (J2000)222Except for S20, these are the NuSTAR positions from Lansbury et al. (2017). The 90% confidence uncertainties are 14–22′′, depending on the source detection significance. For S20, a Swift position is given, and its uncertainty is 3.5′′. | Decl (J2000)a | NuSTAR | ||
| ID | Name | (deg) | (deg) | (deg) | (deg) | Exposure (ks) |
| S1 | J001639+8139.8 | 4.1662 | 81.6639 | 121.6049 | 18.8821 | 62 |
| P82 | J042538–5714.5 | 66.4114 | –57.2417 | 267.0583 | –42.0332 | 243 |
| P98 | J051626–0012.2 | 79.1107 | –0.2047 | 201.7790 | –21.1032 | 148 |
| P127 | J070014+1416.8 | 105.0607 | 14.2814 | 201.1168 | 8.3727 | 123 |
| P144 | J073959–3147.8 | 114.9977 | –31.7969 | 246.4540 | –4.6581 | 25 |
| P146 | J075611–4133.9 | 119.0475 | –41.5666 | 256.5893 | –6.7133 | 32 |
| S20 | J092418–3142.2 | 141.07572 | –31.70479 | 259.5671 | 13.2248 | – |
| P194 | J095838+6909.2 | 149.6588 | 69.1538 | 141.7846 | 41.0720 | 216 |
| S27 | J105008–5958.8 | 162.5362 | –59.9814 | 288.3008 | –0.6010 | 348 |
| S37 | J123559–3951.9 | 188.9960 | –39.8661 | 299.7133 | 22.9090 | 44 |
| S43 | J130157–6358.1 | 195.4894 | –63.9699 | 304.0859 | –1.1217 | 19 |
| P316 | J133628–3414.1 | 204.1200 | –34.2350 | 313.4391 | 27.7160 | 132 |
| P340 | J143636+5843.0 | 219.1532 | 58.7182 | 100.1750 | 53.5145 | 28 |
| P376 | J165351+3938.5 | 253.4627 | 39.6424 | 63.4489 | 38.8521 | 18 |
| P408 | J182604–0707.9 | 276.5178 | –7.1331 | 23.6887 | 2.3455 | 31 |
| P497 | J233426–2343.9 | 353.6111 | –23.7331 | 39.7136 | –72.3073 | 15 |
| Serendip | X-ray | RA (J2000) | Decl (J2000) | Separation333The angular distance between the positions reported in Table 1, which are NuSTAR positions except for S20, and the soft X-ray positions. |
|---|---|---|---|---|
| ID | Source | (deg) | (deg) | (arcsec) |
| S1 | 3XMM J001652.0+813948 | 4.21681 | 81.66335 | 26.5 |
| P82 | 3XMM J042538.6–571435 | 66.41093 | –57.24333 | 5.8 |
| P98 | Swift444Here, we give the X-ray position from the Lansbury et al. (2017) catalog, which was determined from an analysis of Swift/XRT archival data. However, we note that 1SXPS J051626.6–001215 is a cataloged Swift source (Evans et al., 2014) that is only away from the Lansbury et al. (2017) position. | 79.11136 | –0.20499 | 2.8 |
| P127 | 3XMM J070014.3+141644 | 105.05995 | 14.27906 | 8.8 |
| P144 | 3XMM J074000.5–314759 | 115.00208 | –31.79997 | 17.5 |
| P146 | CXO J075611.9–413358 | 119.04957 | –41.56628 | 5.8 |
| S20 | CXO J092418.2–314217 | 141.07582 | –31.70497 | 0.7 |
| P194 | 3XMM J095839.4+690910 | 149.66425 | 69.15279 | 7.9 |
| S27 | 3XMM J105008.1–595902 | 162.53416 | –59.98389 | 9.7 |
| S37 | CXO J123600.5–395215 | 189.00211 | –39.87102 | 24.5 |
| S43 | 3XMM J130158.7–635808 | 195.49500 | –63.96917 | 9.2 |
| P316 | 3XMM J133628.7–341356 | 204.11948 | –34.23235 | 9.8 |
| P340 | 3XMM J143637.4+584303 | 219.15605 | 58.71761 | 5.8 |
| P376 | 3XMM J165350.5+393821 | 253.46062 | 39.63944 | 12.1 |
| P408 | CXO J182604.6–070806 | 276.51929 | –7.13514 | 9.3 |
| P497 | Swift555Here, we give the X-ray position from the Lansbury et al. (2017) catalog, which was determined from an analysis of Swift/XRT archival data. However, we note that 1SXPS J233426.6–234411 is a cataloged Swift source (Evans et al., 2014) that is only away from the Lansbury et al. (2017) position. | 353.61102 | –23.73661 | 12.8 |
| Serendip | Optical | RA (J2000) | Decl (J2000) | Separation666The angular distance between the soft X-ray and optical positions. | -band |
|---|---|---|---|---|---|
| ID | Source | (deg) | (deg) | (arcsec) | magnitude |
| S1 | USNO-B1.0 1716-0000986 | 4.21885 | 81.66364 | 1.48 | 8.16 |
| P82 | USNO-B1.0 0327-0051610 | 66.41077 | –57.24344 | 0.50 | 18.21 |
| P98 | SDSS J051626.67-001214.3 | 79.11113 | –0.20400 | 3.67 | 13.98 |
| P127 | USNO-B1.0 1042-0123735 | 105.06069 | 14.27916 | 2.61 | 17.41 |
| P144 | USNO-B1.0 0582-0158974 | 115.00190 | –31.79980 | 0.84 | 17.11 |
| P146 | USNO-B1.0 0484-0117243 | 119.04954 | –41.56631 | 0.15 | 9.55 |
| S20 | Gaia-DR1 5631352971516952064 | 141.07585 | –31.70491 | 0.24 | |
| P194 | SDSS J095839.34+690912.1 | 149.66393 | 69.15337 | 2.15 | 15.47 |
| S27 | USNO-B1.0 0300-0199877 | 162.53468 | –59.98405 | 1.09 | 15.55 |
| S37 | SIMBAD777No optical counterpart was identified for this source in Lansbury et al. (2017). However, a search of the SIMBAD database (Wenger et al., 2000) at the Chandra position for S37 indicates an association with HD 109573B, and the position given in this table is that of HD 109573B. | 189.00231 | –39.87103 | 0.56 | 11.8 |
| S43 | 2MASS J13015871–6358089 | 195.49464 | –63.96916 | 0.57 | |
| P316 | USNO-B1.0 0557-0301166 | 204.12056 | –34.23311 | 4.25 | 18.63 |
| P340 | SDSS J143637.56+584303.3 | 219.15651 | 58.71761 | 0.86 | 13.98 |
| P376 | SDSS J165350.78+393821.9 | 253.46158 | 39.63944 | 2.67 | 17.61 |
| P408 | USNO-B1.0 0828-0514124 | 276.51929 | –7.13521 | 0.26 | 15.88 |
| P497 | USNO-B1.0 0662-0895815 | 353.61099 | –23.73609 | 1.87 | 12.49 |
| Serendip | NuSTAR | SIMBAD Identifiers | Wavelengths | Type of |
|---|---|---|---|---|
| ID | Name | Detected | Source | |
| Previously | ||||
| S1 | J001639+8139.8 | 11 including HD 1165 | optical, IR | Star |
| P82 | J042538–5714.5 | 6 including RX J0425.6–5714 | X-ray, UV, optical | CV/polar |
| P98 | J051626–0012.2 | 7 including V1193 Ori | optical, IR | CV/nova |
| P127 | J070014+1416.8 | – | – | – |
| P144 | J073959–3147.8 | – | – | – |
| P146 | J075611–4133.9 | 3 including TYC 7654-3811-1 | optical, IR | Star |
| S20 | J092418–3142.2 | – | – | – |
| P194 | J095838+6909.2 | 4 including 2XMM J095839.2+690910 | X-ray, optical, IR | – |
| S27 | J105008–5958.8 | – | – | – |
| S37 | J123559–3951.9 | 10 including HD 109573B | X-ray, optical, IR | Star |
| S43 | J130157–6358.1 | 8 including 2RXP J130159.6–635806 | X-ray | HMXB |
| P316 | J133628–3414.1 | – | – | – |
| P340 | J143636+5843.0 | 8 including TYC 3866-132-1 | X-ray, optical, IR | Star |
| P376 | J165351+3938.5 | – | – | – |
| P408 | J182604–0707.9 | – | – | – |
| P497 | J233426–2343.9 | 1RXS J233427.8–234419 | X-ray | – |
| Serendip | Element | 888Measured wavelength in Å. | EW999Equivalent width in Å. | FWHM101010Full-width at half-maximum in Å. Note that these values are not corrected for the instrumental resolution and should be taken as upper limits on the line widths. | 111111Intrinsic line flux in units of . |
| ID | |||||
| P144 | H I (5-2) | – | () | ||
| H I (4-2) | – | () | |||
| H I (3-2) | – | () | |||
| He I | – | () | |||
| S27 | H I (4-2) | – | () | ||
| H I (3-2) | – | () | |||
| H I (16-3) | – | () | |||
| H I (15-3) | – | () | |||
| H I (14-3) | – | () | |||
| H I (13-3) | – | () | |||
| H I (12-3) | – | () | |||
| H I (11-3) | – | () | |||
| P408 | H I (3-2) | – | () | ||
| P497 | H I (3-2)121212This line is only marginally detected. | – | () |
| Serendip | Satellite | ObsIDs | Date of | Exposure |
| ID | Observation | (ks) | ||
| P144 | NuSTAR | 60061351002 | 2014 April 20 | 22 |
| XMM-Newton | 0501210201 | 2007 May 25 | 22 | |
| Swift | 00080686001 | 2014 April 21 | 1.9 | |
| S27 | NuSTAR | 30001024002 | 2013 July 17 | 293 |
| NuSTAR | 30001024003 | 2013 July 17 | ||
| NuSTAR | 30001024005 | 2013 July 19 | ||
| NuSTAR | 30001024007 | 2013 July 25 | ||
| XMM-Newton | 0654870101 | 2011 August 6 | 77 | |
| Swift | 00080044001 | 2013 July 19 | 9.4 | |
| Swift | 00080044002 | 2013 July 21 | 8.0 | |
| P408 | NuSTAR | 60160688002 | 2015 May 3 | 20 |
| XMM-Newton | 0650591501 | 2011 March 7 | 23 | |
| Swift | 00081220001 | 2015 May 3 | 6.3 | |
| P497 | NuSTAR | 60160832002 | 2015 July 30 | 18 |
| XMM-Newton | 0760990101 | 2015 May 15 | 19 | |
| XMM-Newton | 0760990201 | 2015 November 17 | 20 | |
| Swift | 00081308002 | 2015 July 30 | 6.2 |
| Parameter | Units/Description | P144 | S27 | P408 | P497 |
|---|---|---|---|---|---|
| Absorbed power-law (tbabs*pegpwrlw) | |||||
| cm-2 | 0.46 | ||||
| Photon index | |||||
| 2–10 keV Flux131313This is the normalization for the pegpwrlw model, which is an unabsorbed flux. | erg cm-2 s-1 | ||||
| 8–24 keV Flux | erg cm-2 s-1 | ||||
| – | |||||
| 141414The fits that resulted in the parameters and values in this table did not include the Swift/XRT data. We performed a second round of fits with the XRT data to determine . | – | 0.77 | |||
| – | 8.1/12 | 27.2/15 | 14.5/13 | 91/83 | |
| Absorbed thermal bremsstrahlung (tbabs*bremss) | |||||
| cm-2 | 0.32 | ||||
| keV | 9 | 9 | |||
| Normalization151515, where is the distance to the source (in cm), and are the electron and ion densities (in cm-3), and is the volume of the emitting region (in cm3). | – | ||||
| – | |||||
| – | 7.5/12 | 26.7/15 | 12.3/13 | 109/83 | |
| Serendip | NuSTAR | Classification | Other possible | Primary method |
|---|---|---|---|---|
| ID | Name | classifications161616WD indicates the possibility of a white dwarf binary companion. The Star+WD systems could also be called CVs. As described in the text of the paper, AB is an active binary, consisting of two stars with at least one producing coronal X-ray emission. | of classification | |
| S1 | J001639+8139.8 | Star(K0) | – | SIMBAD |
| P82 | J042538–5714.5 | CV/polar | – | SIMBAD |
| P98 | J051626–0012.2 | CV/nova | – | SIMBAD |
| P127 | J070014+1416.8 | Star(F) | Star(F)+WD or AB | Optical spectrum |
| P144 | J073959–3147.8 | Black hole LMXB | CV | Optical and X-ray spectra |
| P146 | J075611–4133.9 | Star | Star+WD | SIMBAD and X-ray flux |
| S20 | J092418–3142.2 | LMXB | CV | X-ray flux and optical spectrum |
| P194 | J095838+6909.2 | Star(M) | Star(M)+WD or AB | Optical spectrum |
| S27 | J105008–5958.8 | HMXB | Star(Be)+WD or Star(Be) | Optical and X-ray spectra |
| S37 | J123559–3951.9 | Star(M2.5) | – | SIMBAD |
| S43 | J130157–6358.1 | HMXB | – | SIMBAD |
| P316 | J133628–3414.1 | Star(K-G) | Star(K-G)+WD or AB | Optical spectrum |
| P340 | J143636+5843.0 | Star | – | SIMBAD |
| P376 | J165351+3938.5 | Star(K-G) | Star(K-G)+WD or AB | Optical spectrum |
| P408 | J182604–0707.9 | CV | X-ray binary | Optical and X-ray spectra |
| P497 | J233426–2343.9 | CV | AB | Optical and X-ray spectra |