Comparing Neutron Star Kicks to Supernova Remnant Asymmetries
Abstract
Supernova explosions are inherently asymmetric and can accelerate new-born neutron stars (NSs) to hundreds of km s-1. Two prevailing theories to explain NS kicks are ejecta asymmetries (e.g., conservation of momentum between NS and ejecta) and anisotropic neutrino emission. Observations of supernova remnants (SNRs) can give us insights into the mechanism that generates these NS kicks. In this paper, we investigate the relationship between NS kick velocities and the X-ray morphologies of 18 SNRs observed with the Chandra X-ray Observatory and the Rntgen Satellite (ROSAT). We measure SNR asymmetries using the power-ratio method (a multipole expansion technique), focusing on the dipole, quadrupole, and octupole power-ratios. Our results show no correlation between the magnitude of the power-ratios and NS kick velocities, but we find that for Cas A and G292.01.8, whose emission traces the ejecta distribution, their NSs are preferentially moving opposite to the bulk of the X-ray emission. In addition, we find a similar result for PKS 1209–51, CTB 109, and Puppis A; however their emission is dominated by circumstellar/interstellar material, so their asymmetries may not reflect their ejecta distributions. Our results are consistent with the theory that NS kicks are a consequence of ejecta asymmetries as opposed to anisotropic neutrino emission. In the future, additional observations to measure NS proper motions within ejecta-dominated SNRs are necessary to constrain robustly the NS kick mechanism.
Subject headings:
ISM: supernova remnants, methods: data analysis, techniques: image processing, X-rays: ISM, stars: neutron, proper motions1. Introduction
In the past decades, evidence has mounted that supernova explosions (SNe) can have significant deviations from spherical symmetry. Spectropolarimetric studies that measure the polarization of light as it is scattered through the debris layers of expanding SNe have demonstrated that both Type Ia and core-collapse (CC) SNe are aspherical near maximum brightness (e.g., Wang & Wheeler 2008; Kasen et al. 2009; Inserra et al. 2016). Line profiles in nebular spectra (100–200 days after explosion) of SNe also show evidence of ejecta asymmetries (e.g., Mazzali et al. 2001; Maeda et al. 2010; Maeda 2012; Uchida et al. 2013; Winkler et al. 2014). Confirmation of these asymmetries is also possible via comparison of the SN light echo spectra from several dust concentrations around SNRs (e.g., Rest et al. 2011).
Neutron stars (NSs), the compact objects formed in some CC SNe, may provide information about the SN explosion mechanism and its effect on ejecta asymmetries. NSs are typically ‘kicked’ in the explosions to velocities of hundreds of km s-1 (Lyne & Lorimer, 1994; Arzoumanian et al., 2002; Hobbs et al., 2005; Faucher-Giguère & Kaspi, 2006), with some sources reaching velocities of 1000 km s-1 (e.g., Chatterjee et al. 2005; Winkler & Petre 2007). These 1000 km s-1 velocities are larger than can be accounted for by the disruption of a close binary system (which typically produce velocities of 100 km s-1: Lai 2001), suggesting that the explosion is the likely cause of these kicks.
Two theories have been proposed to explain the cause and direction of NS kicks. In the first scenario (hereafter the ejecta asymmetry model), hydrodynamical instabilities lead to asymmetric mass ejection, accelerating the NS in a direction opposite to the bulk of ejecta (Scheck et al., 2006; Wongwathanarat et al., 2013; Janka, 2017). For example, simulations by Wongwathanarat et al. (2013) reveal that gravitational forces from the anisotropic ejecta can generate NS recoil velocities of at least 700 km s-1, and 2D models by Scheck et al. (2006) have achieved NS velocities exceeding 1000 km s-1. This model predicts that the heavy elements (e.g., iron, titanium) are expelled in a direction opposite to the NS kick, while the intermediate-mass elements (e.g., carbon, oxygen, neon, magnesium) are only marginally affected.
In the second scenario, anisotropic neutrino emission carries away the bulk of the gravitational binding energy of the neutron star, and both the NS and the ejecta move opposite to the direction of the majority of that energy (Fryer & Kusenko, 2006). However, several authors have noted that strong (1016 G) magnetic fields and specific assumptions about the field configuration or nonstandard neutrino physics are necessary to generate kick velocities of 300 km s-1 (Scheck et al., 2006; Wongwathanarat et al., 2013). Both of these models can reproduce the observed spin-kick alignment in pulsars (Spruit & Phinney, 1998; Johnston et al., 2005; Fryer & Kusenko, 2006; Janka, 2017; Müller et al., 2017).
Supernova remnants (SNRs) offer the means to distinguish between these two scenarios. Several hundred SNRs have been identified in the Milky Way and the Large and Small Magellanic Clouds (e.g., Badenes et al. 2010; Green 2014), and many of these sources have detected compact objects and/or pulsar wind nebulae (e.g., Gaensler & Slane 2006; de Luca 2008). The metals synthesized in the explosions are shock-heated to X-ray emitting temperatures, and X-ray observations of SNRs have revealed complex morphologies that may reflect asymmetries in SN explosion mechanisms (see Weisskopf & Hughes 2006 and Vink 2012 for a review). For example, the young SNR Cassiopeia A (Cas A) has asymmetric velocity gradients in its ejecta knots and jets that are attributed to its explosion (DeLaney et al., 2010; Fesen et al., 2006; Hwang & Laming, 2012; Milisavljevic & Fesen, 2015; Grefenstette et al., 2017).
The complex structure of SNRs makes it difficult to systematically compare sources. To address this challenge, Lopez et al. (2009a) developed techniques to quantitatively characterize emission from SNRs. Subsequent work showed that the X-ray and infrared morphologies of CC SNRs are more elliptical and mirror asymmetric than those of Type Ia SNRs (Lopez et al., 2009b, 2011; Peters et al., 2013). The origin of these asymmetries remains unclear: they may reflect the asymmetries inherent to the explosion mechanism, or they may arise from interactions with an inhomogeneous medium. For example, kinematic studies demonstrate large-scale asymmetries in SNR ejecta (e.g., SN 1987A: Boggs et al. 2015; Cas A: Rest et al. 2011; Grefenstette et al. 2017), while observations and simulations show that interaction with a dense medium can alter the morphology and thermodynamic properties of SNRs (e.g., Tenorio-Tagle et al. 1985; Lazendic & Slane 2006; Slane et al. 2015).
In this paper, we examine the relationship between the X-ray morphology of a sample of Milky Way SNRs and their NS velocities to assess both the role of the explosion mechanism in shaping SNRs and to probe the origin of NS kicks. For this work, we exploit multi-epoch Chandra X-ray Observatory archival images to measure NS transverse velocities, and we compare them to the asymmetries of the X-ray morphologies as observed by Chandra and the Rntgen Satellite (ROSAT). In Section 2, we describe the observations used in this study and the selection criteria to build our sample. In Section 3, we explain the methods used to analyze the X-ray morphology and to measure the NS velocities. In Section 4, we present our results, while in Section 5, we discuss the implications regarding the origin of NS kicks. Section 6 summarizes our conclusions and outlines possible future work that would test SN models using SNRs and their compact objects.
2. Observations, Sample, and Data Analysis
We utilize archival X-ray observations of 18 SNRs selected based on the criteria discussed in the following paragraphs. Specifically, we employ X-ray imaging data from the Chandra Advanced CCD Imaging Spectrometer (ACIS) and ROSAT’s Position Sensitive Proportional Counter (PSPC). We did not include XMM-Newton observations in our analysis because no targets that met our selection criteria were imaged only by XMM-Newton. One source, CTB 109, has been observed by both ROSAT and XMM-Newton, and we opted to use the former because the SNR was imaged fully in one ROSAT pointing, whereas the XMM-Newton mosaic required stitching of several pointings together.
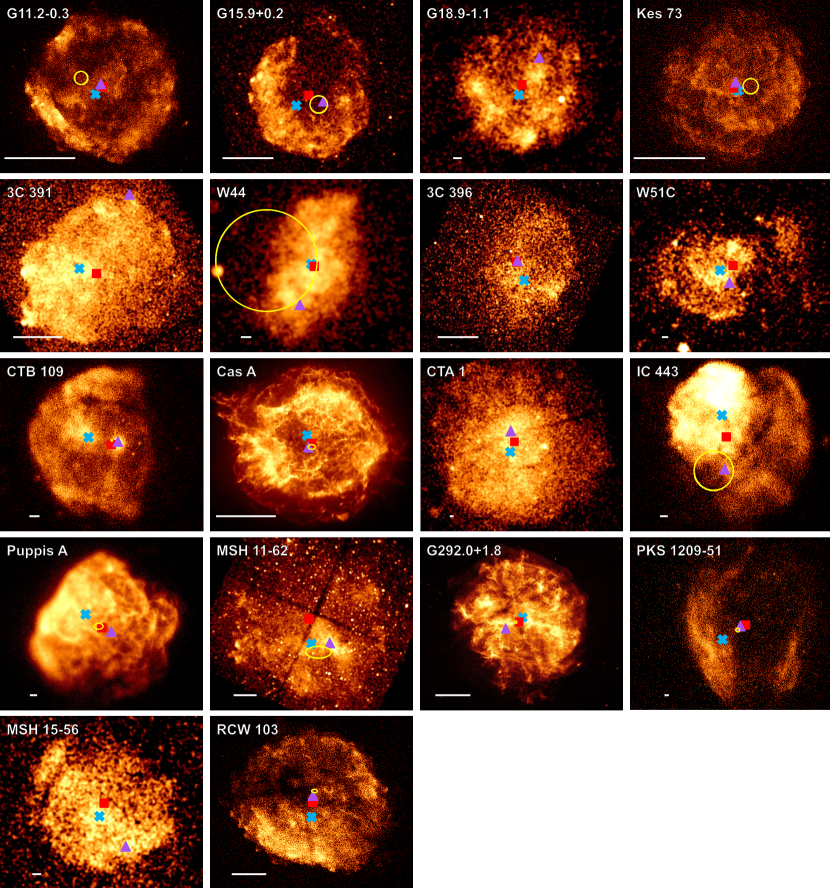
Images of the SNRs are shown in Figure 1. Our sample is comprised of relatively young (20 kyr old) Milky Way CC SNRs that are imaged fully by Chandra or ROSAT, have strong thermal X-ray emission, and have a detected NS with a reported or measurable transverse velocity. SNRs are typically classified as CC SNRs based on their elemental abundances and on the presence of a neutron star near their centers (see references in Table 2). We do not consider SNRs in other galaxies because they are too distant to measure NS proper motions. In addition, we exclude from our sample the SNRs dominated by non-thermal emission, as the X-ray morphologies would reflect the structure of the synchrotron radiation from the forward shock or a large PWN. For example, G21.5–0.9 was excluded because non-thermal emission from the PWN covers a large fraction of the remnant and dominates the full X-ray band (Safi-Harb et al., 2001).
Since we are investigating the spatial distribution of thermal X-ray emission, we only selected remnants whose emission is dominated (90%) by thermal emission in the 0.5–2.1 energy band. For the SNRs imaged fully by Chandra, we extracted X-ray spectra from multiple regions and fit the data in each region using XSPEC Version 12.9.0 (Arnaud, 1996) with AtomDB111atomdb.org 3.0.7 (Smith et al., 2001; Foster et al., 2012). For the larger SNRs imaged by ROSAT, we extracted and fit the X-ray spectra from multiple regions of Chandra observations if available( see Table 1). By fitting multiple regions, it allowed us to account for variations in the thermal properties across the remnant. We modeled all of the data as an absorbed (phabs) thermal plasma (vapec or vpshock) plus a power-law component. We allowed the elemental abundances (e.g., Mg, Si, S, Ar, Fe) to vary and capped the photon index to below 3.0 so the power-law component would reflect non-thermal emission. We used the solar abundance table from Anders & Grevesse (1989). We adopted the best-fit results to compute the total unabsorbed flux contributed by the thermal and power-law components. In Table 2 we have listed the relevant properties, including estimated ages, distances, and neutron star velocities (derived in this work or found in the literature) for our sample of 18 SNRs.
Data reduction and analysis was performed using the Chandra Interactive Analysis of Observations (ciao) Version 4.7 and ftools (Blackburn, 1995). For the remnants with diameters smaller than 16′ in X-rays, we produced exposure-corrected Chandra images in the 0.5–2.1 keV band, merging observations via the ciao command merge_obs. We then removed point sources using the commands wavdetect and dmfilth, including removal of the NS and associated PWN (if applicable) from the images. For all SNRs except for CTB 109, the PWN size is 2% of the radius of the remnant, and thus their removal does not dramatically affect the morphology of the SNRs. The PWN in CTB 109 is approximately 10% of the SNR radius. However, since the power-ratios weight more heavily emission at large radii, removal of the PWN near the origin has minimal effect on their values.
For the larger remnants, we analyzed ROSAT images but did not exposure correct them as doing so produced artifacts in the images that affected the power-ratio results. For example, the power-ratio values for G11.2–0.3 differed between the Chandra and exposure-corrected ROSAT images, but the values were consistent when using exposure-uncorrected ROSAT images. This effect held true for all SNRs with both Chandra and ROSAT observations, and thus we opted against exposure correction for the ROSAT images to enable comparison between the Chandra and ROSAT results.
2.1. Properties of the SNRs
As we aim to compare the ejecta distribution to the NS kick velocities, it is important to consider the contribution of ejecta and circumstellar/interstellar material (CSM/ISM) to the thermal X-ray emission of each remnant. Generally, the components that contribute most to the thermal X-ray emission in SNRs are bremsstrahlung continuum and emission lines from collisionally-ionized plasmas. Depending on the age and ambient density, the plasmas may be under-ionized (in non-equilibrium ionization: NEI) or in collisional ionization equilibrium (CIE; we note that ionization timescales 1012 s cm-3 suggest the plasma is in CIE: Smith & Hughes 2010). Alternatively, some SNRs have evidence of recombining and over-ionized plasmas thought to arise from rapid cooling caused by molecular cloud interactions (e.g., see Kawasaki et al. 2005). Given the low densities and young ages of our sample, thermal emission can arise from either the shock-heated ejecta or the CSM/ISM.
In the following paragraphs, we summarize the contribution of ejecta and CSM/ISM in each source’s X-ray emission based on previous studies. Ejecta emission is characterized by super-solar abundances of metals such as Mg, Si, and S, and CSM/ISM emission has sub-solar or solar metal abundances. In sources where the emission is primarily from ejecta, the asymmetries measured by the power-ratio method reflect the ejecta distribution from the explosion. For SNRs that have significant emission from CSM/ISM or dense molecular clouds, the asymmetries measured by the power-ratio method are influenced by the environment and thus may not reflect the asymmetries of the explosion. In our sample, multiple remnants show evidence of interactions with CSM/ISM (3C 391, W44, 3C 396, W51C, CTB 109, IC 443, Puppis A, and RCW 103; see details within this section), and we mark them as interacting (see e.g, Figure 2).
G11.20.3–G11.20.3 was first detected at X-ray wavelengths with Einstein HRI (Downes, 1984) and was subsequently observed with ROSAT (Reynolds et al., 1994) and with Chandra (Kaspi et al., 2001; Roberts et al., 2003; Lopez et al., 2011; Borkowski et al., 2016). The PWN and 65-ms period pulsar associated with G11.20.3 were discovered using ASCA observations (Vasisht et al., 1996; Torii et al., 1997), and Kaspi et al. (2001) showed that the pulsar is only 8′′ from the geometric center of the SNR. Borkowski et al. (2016) used multiple epochs of Chandra observations to measure a shell expansion rate that implied an age of 1400–2400 years, making G11.20.3 one of the youngest identified CC SNRs in the Milky Way. Lopez et al. (2011) performed a spatially-resolved spectroscopic analysis of 23 regions using Chandra data and found that the spectra were best-fit by a single absorbed, NEI component with absorbing columns of cm-2, temperatures of keV, and ionization timescales of s cm-3. The Chandra X-ray spectra have prominent Mg, Si, and S lines, and the fits by Lopez et al. (2011) showed these elements have supersolar abundances in most regions, indicating an ejecta origin of the emission.
G15.90.2–G15.90.2 is a young (a few thousand year old) SNR with a shell-like morphology in X-rays (Reynolds et al., 2006). Using deep Chandra observations, Klochkov et al. (2016) showed that the X-ray point source CXOU J181852.0150213 in G15.90.2 is a cooling, low-magnetized neutron star of the central compact object (CCO) class (e.g., Pavlov et al. 2004). Recently, Maggi & Acero (2017) analyzed archival XMM-Newton observations of G15.90.2, extracting spectra from several locations along the shell and interior. These data have strong Mg, Si, S, Ar, and Ca lines, as well as a weak Fe K feature. Maggi & Acero (2017) found that the spectra were best-fit by an absorbed, NEI plasma model, with absorbing columns of cm-2, temperatures of keV, and ionization timescales of s cm-3 (except in the northwest, where the faint shell has s cm-3). All regions showed enhanced abundances (with the solar values) of the detected metals.
G18.91.1–G18.91.1 is a composite SNR that was first observed at X-ray wavelengths with a pointed ROSAT observation by Fuerst et al. (1997). They found that the spectra were best described by an absorbed, NEI plasma model with temperature keV and a column density of cm-2. Subsequently, Harrus et al. (2004) analyzed ROSAT and ASCA observations of G18.91.1. These authors showed that the spectra from the SNR were predominantly thermal in nature, and the best-fit model was an absorbed, thermal plasma in non-equilibrium ionization, with cm-2, a temperature of keV, and an ionization timescale of s cm-3. Harrus et al. (2004) found marginal evidence for supersolar abundances of Mg and Si in their fits. Using follow-up Chandra observations of G18.91.1, Tüllmann et al. (2010) identified a faint X-ray point source, CXOU J182913.1125113, with an associated trail of diffuse emission thought to be a PWN. Spectra extracted from the region of the PWN required a power-law component as well as a thermal component to adequately fit the data, and Tüllmann et al. (2010) interpreted this result as evidence of contamination from the SNR’s thermal emission.
Kes 73–Kes 73 (G27.40.0) is a young (2000 years old), shell-type SNR with the magnetar 1E 1841045 located near its center (Gotthelf & Vasisht, 1997; Vasisht et al., 1997). Due to its small angular extent (4′ in diameter), Chandra and XMM-Newton observations were necessary to disentangle the magnetar’s emission from the ejecta; the latter has a clumpy substructure throughout the remnant (Lopez et al., 2011; Kumar et al., 2014). Kumar et al. (2014) performed fits to the Chandra and XMM-Newton X-ray spectra from nine regions of Kes 73 and found that the data were best described by two absorbed, thermal components, one hot NEI plasma (with keV and s cm-3) with solar abundances, and one colder component (with keV) near CIE (with s cm-3), with supersolar abundances of Si and S. Lopez et al. (2011) extracted Chandra spectra from 30 clumps identified in X-ray images, and their data were best-fit by an absorbed, single thermal plasma in NEI, with absorbing columns of cm-2, temperatures of keV, and ionization timescales of s cm-3. These authors found supersolar abundances of Mg, Si, and S in most regions, indicating an ejecta origin of the thermal emission.
3C 391 (G31.90.0)–3C 391 was first detected in X-rays using Einstein (Wang & Seward, 1984) and has been extensively followed up in multiple wavelengths. Radio observations revealed that the SNR exhibits a shell-like morphology, while extended radio emission indicative of a shock breakout into a low density environment is seen towards the southeast (Reynolds & Moffett, 1993). Two 1720 MHz OH masers (Frail et al., 1996b) as well as enhanced CO (Wilner et al., 1998) and [Oi] (Reach & Rho, 1996) emission is seen along the shell, evidence that the remnant is interacting with a nearby molecular cloud (e.g., Reach & Rho, 1999). 3C 391 has been studied in X-rays using Einstein (Wang & Seward, 1984), ROSAT (Rho & Petre, 1996), ASCA (Chen & Slane, 2001), Chandra (Chen et al., 2004) and Suzaku (Sato et al., 2014). These observations revealed a center-filled morphology characteristic of mixed-morphology SNRs (Rho & Petre, 1998). Using a deep Chandra observation, Chen et al. (2004) found that its X-ray emission is best described using a NEI plasma with approximately solar abundances of Mg, Si and S, and a uniform temperature throughout the SNR of keV approaching CIE. Follow-up observations using Suzaku further confirmed the presence of a near-CIE plasma; however, Sato et al. (2014) found that the X-ray spectrum of 3C 391 requires an additional high-temperature ( keV) recombining plasma (RP) component. The detection of enhanced Ca led Sato et al. (2014) to suggest that the RP component arises from ejecta from a 15M⊙ progenitor, and its high ionization timescale ( s cm-3) makes it one of the only SNR that shows evidence of overionization whose plasma is in/close to ionization equilibrium.
W44 (G34.70.4)–Due to its center-filled X-ray morphology and bright radio synchrotron shell, W44 is one of the most well studied mixed-morphology SNRs in radio (e.g., Kundu & Velusamy, 1972; Handa et al., 1987; Jones et al., 1993), X-rays (e.g, Harrus et al., 1997; Rho et al., 1994; Shelton et al., 2004; Kawasaki et al., 2005; Uchida et al., 2012) and gamma-rays (e.g., Ackermann et al., 2013). This 20 kyr (Wolszczan et al., 1991) remnant shows strong evidence of molecular cloud/shock interaction (e.g., Claussen et al., 1997; Frail & Mitchell, 1998; Seta et al., 1998, 2004; Reach et al., 2005; Uchida et al., 2012), and it is one of the brightest GeV gamma-ray SNRs detected (e.g., Ackermann et al., 2013). Shelton et al. (2004) found metal-rich ejecta at the center of the SNR using Chandra observations of W44. Uchida et al. (2012) confirmed these results with Suzaku and showed that the X-ray spectra of W44 are best described as an overionized plasma with enhanced abundances of Ne, Mg, Si, S, Ar, and Ca. There is a slight temperature gradient in the remnant, with a hotter temperature ( keV) at its center compared to its outer regions ( keV). Shelton et al. (2004) suggested that the complicated morphology and nature of this remnant arises from either evaporation of swept-up clouds (White & Long, 1991) or from thermal conduction (Cox et al., 1999; Shelton et al., 1999). The hard X-rays are not associated with the pulsar (B1953+01: Wolszczan et al. 1991), so the emission may arise from particles accelerated by the SNR shock front.
3C 396 (G39.20.3)–3C 396 is a middle-aged (3000–7000 years old), composite SNR (Harrus & Slane, 1999; Su et al., 2011). ASCA observations of 3C 396 revealed a non-thermal component dominates at the center of 3C 396 (Harrus & Slane, 1999), and Chandra observations resolved this emission as a PWN (Olbert et al., 2003). Su et al. (2011) extracted Chandra X-ray spectra from multiple locations around the perimeter of 3C 396, and emission lines from Si, S, Ar, and Ca were evident. They found the data were best-fit by an absorbed, single NEI plasma, with absorbing columns of cm-2, temperatures of keV, and ionization timescales of s cm-3 (although the southwest and east of the SNR only had lower-limits on of s cm-3 and s cm-3, respectively). Su et al. (2011) obtained supersolar abundances of Si, S, and Ca in several regions of the SNR, indicative of an ejecta origin for the thermal emission despite the moderate age of 3C 396. We note that 3C 396 is thought to be interacting with molecular clouds based on 12CO and 12CO observations, particularly on the western side where the SNR appears to be confined by a molecular wall (Su et al., 2011).
W51C (G49.20.7)–W51C is located in a complicated region of the sky and is associated with a number of compact Hii regions, dense molecular material, and the massive star forming region W51B (e.g., Bieging, 1975; Mufson & Liszt, 1979; Koo & Moon, 1997a; Carpenter & Sanders, 1998; Koo, 1999; Kumar et al., 2004). W51C has been detected in radio (Copetti & Schmidt, 1991; Subrahmanyan & Goss, 1995) all the way to TeV energies (Abdo et al., 2009; Feinstein et al., 2009; Aleksić et al., 2012; Jogler & Funk, 2016, e.g.,) It shows evidence of interaction with nearby molecular clouds based on the detection of two OH masers (Green et al., 1997; Brogan et al., 2013). This remnant has been extensively studied in X-rays using Einstein (Seward, 1990), ROSAT (Koo et al., 1995), ASCA (Koo et al., 2002), Chandra (Koo et al., 2005; Brogan et al., 2013), XMM-Newton (Sasaki et al., 2014) and Suzaku (Hanabata et al., 2013). These studies find that the X-ray emission arises from a relatively hot ( keV), NEI plasma with enhanced abundances of Ne, Mg, and Si in several regions. Based on the derived ejecta masses, Hanabata et al. (2013) and Sasaki et al. (2014) suggested that this remnant resulted from a 20M⊙ progenitor. Hanabata et al. (2013) also found hard X-ray emission spatially coincident with the molecular clouds and the two OH masers (Koo et al., 2005; Brogan et al., 2013; Sasaki et al., 2014).
CTB 109 (G1091.0)–CTB 109, first detected in X-rays by Einstein (Gregory & Fahlman, 1980), is the host of the anomalous X-ray pulsar (AXP) 1E 2259586 (Fahlman & Gregory, 1981). Radio (Hughes et al., 1981) and X-ray (Sasaki et al., 2004) observations have revealed that CTB 109 has a semi-circular morphology, likely a result of interactions with a giant molecular cloud (GMC) complex on its entire western side (Sasaki et al., 2013). CO extends toward the east from the GMC complex and along the northern side of the SNR, and significant gamma-ray emission is detected throughout the SNR (Castro et al., 2012).
Another distinct feature of this remnant is the “Lobe,” a region of bright ejecta emission resulting from interactions with dense ISM. Sasaki et al. (2013) performed spectral analysis on the Lobe and surrounding regions using Chandra observations. They analyzed 39 regions in the northeast of the remnant, fitting them with both a single- and two-component NEI model. The two-component model represents the emission from both the shocked ISM and the ejecta. They found that the temperature of the ISM component was keV across all regions, and the temperature of the ejecta component was higher at keV. The ionization timescale of the ejecta component was s cm-3 and they found absorbing columns of cm-2 in and west of the Lobe. Larger absorbing columns of cm-2 were found in the north where there is evidence of interaction with CO clouds (Sasaki et al., 2006). The spectral fits of Sasaki et al. (2013) revealed that the emission in CTB 109 is dominated by ISM below 0.6 keV and by ejecta above 1 keV.
Cas A (G111.72.1)–Cas A is one of the most studied remnants in the MW because it is the youngest CC SNR known in the galaxy with an age of only 340 years (Thorstensen et al., 2001). It was the target of Chandra’s first light observation (Hughes et al., 2000), and since then many megaseonds of Chandra time have been dedicated to studying it. Prominent features of Cas A are its distinct ejecta knots, which span from the center to and past the forward shock (Hughes et al., 2000; Hwang & Laming, 2003). Optical observations have shown that Cas A is an O-rich SNR (e.g., Chevalier & Kirshner 1978). Studies of light echoes from the explosion have revealed that Cas A was produced by an asymmetric Type IIb supernova with variations in ejecta velocities of 4000 km s-1 (Rest et al., 2011).
Hwang & Laming (2012) and Rutherford et al. (2013) performed spectral analysis of several regions in Cas A using Chandra ACIS observations, and modeled the data as an absorbed, NEI plasma. They found temperatures ranging from keV and an average column density of cm-2. The calculated abundances of Si, S, Ar, and Ca were 3–7 times the solar values, indicating that the emission from Cas A is dominated by ejecta emission.
We note that the reverse shock in Cas A has not yet propagated through the whole remnant (Gotthelf et al., 2001). However, Hwang & Laming (2012) estimate that the unshocked ejecta only comprise 10% of the total ejecta mass, so the X-ray emitting ejecta reflect the majority of the metals synthesized in the explosion.
CTA 1 (G119.510.2)–CTA 1 was first detected in X-rays by ROSAT (Seward et al., 1995) and has a center-filled X-ray morphology. It is a large SNR with a radio shell diameter of (Seward et al., 1995) and a derived age of 1.3 yr from a Sedov solution (Slane et al., 2004). Non-thermal X-rays in CTA 1 reveal the presence of a PWN with a central radio pulsar RX J0007.07303 that exhibits jet-like structure (Slane et al., 1997; Halpern et al., 2004). Slane et al. (2004) initially modeled the ASCA spectra of CTA 1 as an absorbed power-law and discovered that a thermal CIE component was required to fit the data below 1 keV. They found a column density of cm-2, a spectral index of , and a plasma temperature of keV. The non-thermal component arises from the synchrotron nebula that extends from the pulsar to the SNR shell.
To date, the abundances of the thermal plasma have not yet been constrained, and thus it is unknown whether the thermal X-rays arise from the ejecta or the CSM/ISM. However, given the mature age of the SNR, it is likely that the X-ray emission is ISM-dominated.
IC 443 (G189.13.0)–IC443 is another well studied mixed-morphology SNR. This source is coincident with both a giant molecular cloud complex (Cornett et al., 1977) and an OB1 association (Humphreys, 1978). It is also among the brightest gamma-ray SNRs in the MW (e.g., Esposito et al., 1996; Sturner & Dermer, 1995; Acciari et al., 2009; Ackermann et al., 2013). In addition to a number of radio studies (Braun & Strom, 1986; Snell et al., 2005), this remnant has been extensively followed up in X-rays (e.g., Petre et al., 1988; Kawasaki et al., 2002; Troja et al., 2006, 2008; Bocchino et al., 2009; Yamaguchi et al., 2009; Ohnishi et al., 2014). Originally, Troja et al. (2008) suggested that the X-ray emission of IC 443 could be well described by a two-component plasma, one low temperature ( keV), NEI component associated with shocked ISM and a hot, ( keV) ejecta component in CIE with supersolar abundances of Mg, Si and S. However, analysis of ASCA and Suzaku observations revealed that an additional low temperature ( keV), overionized plasma component is necessary to account for the line ratios and the radiative recombination continua features in the spectra (Kawasaki et al., 2002; Yamaguchi et al., 2009; Ohnishi et al., 2014).
Puppis A (G260.43.4)–Puppis A was first detected in X-rays with Einstein observations (Petre et al., 1982) and was subsequently observed with ROSAT (Aschenbach, 1993), Chandra (Hwang et al., 2005), XMM-Newton (Hui & Becker, 2006; Katsuda et al., 2010), and Suzaku (Hwang et al., 2008). The X-ray emission in Puppis A is thermal in nature (Luna et al., 2016), with evidence of knotty ejecta in the east and to the north of Puppis A (Katsuda et al., 2008, 2010; Dubner et al., 2013). Hwang et al. (2008) performed spectral analysis using Suzaku observations, modeling various regions in the east of the remnant. They used an absorbed NEI model and found a temperature of keV and a column density of cm-2. The northern regions showed slightly super-solar Si abundances, but most of the remnant is best-fit with sub-solar abundances, consistent with follow-up work demonstrating that the emission in Puppis A is dominated by CSM/ISM (Dubner et al., 2013; Luna et al., 2016). The emission on its eastern side is likely enhanced from interactions with a molecular cloud (Arendt et al., 2010; Dubner et al., 2013). In addition, there is evidence of dust absorption in the southwest from IR (Arendt et al., 2010) and X-ray (Dubner et al., 2013) observations, which may be the cause for the fainter X-ray emission in that region.
MSH 1162 (G291.00.1)–First observed with Einstein (Wilson, 1986), MSH 1162 is a centrally-bright SNR with a young pulsar powering a PWN. The distance estimate to MSH 1162 is uncertain, but thought to be near 5 kpc (Slane et al., 2012). In front of the SNR is the open cluster Tr 18 at a distance of kpc (Vazquez & Feinstein, 1990), which can be seen as the many point sources in Figure 1. X-ray observations with ASCA (Harrus et al., 1998), XMM-Newton, and Chandra (Slane et al., 2012) revealed that the spectrum of the remnant and pulsar can be best described using absorbed thermal and nonthermal components. Slane et al. (2012) fitted the spectra using a NEI plasma and a power-law component. They fixed the column density to the best-fit value for the PWN ( cm-2), and found an ionization timescale of s cm-3 and keV. There is evidence for super-solar abundances of Ne, Mg, and Si throughout the remnant, indicating that the thermal emission reflects the distribution of ejecta.
G292.01.8–G292.01.8 is an “oxygen-rich” SNR based on optical emission from fast ejecta knots rich in oxygen (Goss et al., 1979; Murdin & Clark, 1979). It has an elliptical X-ray morphology with a central equatorial belt running east to west (Park et al., 2002; Lee et al., 2009; Ghavamian & Williams, 2016). Several X-ray studies using Chandra (Park et al., 2004; Bhalerao et al., 2015) have shown that G292.01.8 has emission from both metal-rich ejecta and shocked CSM, with CSM mainly located in the equatorial belt. Bhalerao et al. (2015) performed spectral modeling of 33 regions. They modeled the spectra as an absorbed NEI plasma plus a power-law component for regions near the central pulsar. They allowed O, Ne, Mg, Si, S, and Fe abundances to vary and found that most regions in the remnant have super-solar abundances ( several times solar), indicating an ejecta origin of the X-ray remission. However, most of the emission from the equatorial belt has sub-solar abundances and is likely CSM material.
PKS 120951 (G296.510.0)–First detected in X-rays with HEAO-1 (Tuohy et al., 1979), the SNR PKS 120952 is a large (81′-diameter) SNR with a radio-silent central NS (Zavlin et al., 1998). The NS, 1E 1207.45209, was first discovered with Einstein (Helfand & Becker, 1984). Kellett et al. (1987) performed spectral analysis on EXOSAT data and found evidence for thermal emission. They used an absorbed single-temperature CIE plasma model, and found a column density of cm-2 and an average temperature of keV. However, due to its large and diffuse nature, Chandra, XMM-Newton, and Suzaku have not mapped the entirety of this SNR; most observations have focused on the vicinity of the CCO. Thus, the abundances of the thermal plasma have not been measured previously and the thermal emission could arise from ejecta or CSM/ISM.
PKS 120951 does show signs of interaction. In particular, Araya (2013) analyzed Fermi Gamma-ray Space Telescope observations of this SNR, and it was detected with 5- significance above 500 MeV. Many GeV-bright SNRs are known to be interacting with molecular clouds (e.g., Hewitt et al. 2009; Castro et al. 2013), so the Fermi detection of PKS 120951 may suggest that the remnant is interacting. It is unclear whether or how this remnant is interacting with CSM or ISM, so the emission could reflect the ejecta distribution or the local environment.
MSH 1556 (G326.31.8)–First detected in radio, (Mills et al., 1961), MSH 1556 is a composite SNR. Radio observations revealed a SNR shell and a luminous PWN (Dickel et al., 2000). It was also detected in X-rays by ROSAT (Kassim et al., 1993), ASCA (Plucinsky, 1998), XMM-Newton and Chandra (Temim et al., 2013). It has clumpy X-ray emission, with enhancement near the PWN. Temim et al. (2013) performed spectral analysis of eight regions in the southwest area of MSH 1556 using Chandra and XMM-Newton observations, focusing on the pulsar and the surrounding regions. An absorbed, two-component model with a power-law and a NEI plasma was needed to accurately fit the spectra. They found a best-fit column density of cm-3, a temperature of keV, and an ionization timescale of s cm-3 for most regions. The northern regions, the largest and most central to the SNR, showed enhanced abundances of Si and S (3–4 solar values: Temim et al. 2013). Regions near the pulsar showed abundances closer to solar values or were unconstrained by the fit.
RCW 103 (G332.40.4)–RCW 103 is a shell-type remnant with an estimated age of years (Carter et al., 1997). It is host to an unusual magnetar with a 6.67-hour periodicity thought to be generated by a fall-back accretion disk (Tong et al., 2016; Ho & Andersson, 2017; D’Aì et al., 2016) or a binary (De Luca et al., 2006). Oliva et al. (1990, 1999) performed IR spectroscopy of RCW 103 and found emission from molecular and ionized gas in the south. Further studies in the IR and radio revealed that this remnant is interacting with a molecular cloud in the southeast (Pinheiro Gonçalves et al., 2011).
In the X-rays, Lopez et al. (2011) and Frank et al. (2015) performed spectral analysis of RCW 103 using Chandra observations. Lopez et al. (2011) analyzed 31 regions and modeled the spectra as an absorbed NEI plasma. They found an average column density of cm-2, a temperature of keV, and an ionization timescale of s cm-3. In nearly all regions examined, the abundances of Mg and Si were found to be statistically above solar values, except in the southeast. Frank et al. (2015) also modeled the Chandra spectra with one NEI or with two thermal (one NEI and one CIE) components. They found that the single-component fits suggested the CSM dominates the X-ray emission (based on the subsolar best-fit abundances). However, in the two-component fits, they found that roughly half of the 27 regions analyzed have ejecta emission (with supersolar abundances of Ne, Mg, Si, S, and/or Fe). Frank et al. (2015) noted that it is challenging to disentangle the CSM and ejecta emission in RCW 103 as they are interspersed throughout the SNR.
3. Methods
We use the power-ratio method (PRM) to analyze the asymmetries of X-ray emission in SNRs. This method was employed to characterize the X-ray morphology of galaxy clusters (Buote & Tsai, 1995, 1996; Jeltema et al., 2005) and was adapted by Lopez et al. (2009a) for use on SNRs. Using the PRM, we calculate the multipole moments of extended emission to probe asymmetries. Power-ratios, the nth-order power moment divided by the zero-th power moment, are used to directly compare sources of different total fluxes. For a more detailed/mathematical description of this method and its application to SNRs, see Lopez et al. (2009a).
3.1. Center-of-Emission Analysis
In our first series of calculations, we adopt the center-of-mass of the emission (hereafter center-of-emission) as the origin of the multipole expansion. In this case, the dipole power-ratio, P1/P0, approaches zero while the higher-order moments give details about successively smaller-scale asymmetries. P2/P0 is the quadrupole power-ratio and quantifies ellipticity/elongation of an extended source. P3/P0 is the octupole power-ratio and is a measure of mirror asymmetry. Figure 1 shows the center-of-emission (blue crosses) for each SNR.
Uncertainties in the power-ratios are estimated via the Monte Carlo analysis described in Lopez et al. (2009a). The program AdaptiveBin (Sanders & Fabian, 2016) is used to bin the SNR into sections of equal total photon counts. Then, the counts in each bin are replaced by a number taken randomly from a Poisson distribution with the mean equaling the original number of counts. This process is repeated 100 times to create 100 mock images of each source. We then measure the power-ratios of these 100 images, and take the average as the true power-ratio. We adopt the sixteenth-highest and -lowest values as the confidence limits, chosen to match the 1- range of a Gaussian distribution.
3.2. Explosion Site Analysis
For the sources with reliable measures of the explosion sites (Cas A, G292.91.8, CTB 109, Puppis A, PKS 1209, and RCW 103), we also compute the power-ratios by adopting the explosion sites as the origin of the multipole expansion. In this case, the dipole power-ratio (P1/P0) measures the displacement between the center-of-emission and the explosion site.
The explosion sites are derived by back-evolving the proper motion of the NS or SNR filaments assuming ages given in the literature (listed in Table 2). The yellow ellipses in Figure 1 show the explosion site locations with sizes reflecting the 1- confidence region using the back-evolved NS velocities or filaments. For some sources (e.g., G11.2–0.3, G189.10.3), this method results in explosion sites that are unphysical, such as at the edge of the SNR shell, even though statistical uncertainties in the NS proper motion are small. Systematic uncertainties may be substantially larger, as in e.g., G11.20.3, where the ellipse is significantly offset from the center-of-emission and the geometric center. For these sources, we do not use the proper motion velocity. Other sources do not have precise enough NS or filament proper motions to determine reliable explosion sites. For example, G34.70.4 has large errors that provide almost no constraint on the explosion site, and both Kes 73 and MSH 1162 have velocity errors of km s-1. Consequently, for these sources, we do not perform the power-ratio analysis using the explosion site as the origin.
3.3. Neutron Star Velocities
Generally, two approaches are utilized to estimate NS velocities in literature: 1) a proper motion measurement using multi-epoch images (e.g., Auchettl et al. 2015); 2) approximation of the velocity, given the NS’s spatial offset from the geometric center and the age and distance of the SNR (e.g., Kaspi et al. 2001). The latter approach requires a single observation with a NS detection; thus it is the most common way to estimate velocities in the literature. However, this method can lead to significant errors as it assumes that the NS originated at the geometric center of the SNR. This assumption is not necessarily valid as interactions with an inhomogenous medium can distort the shape of SNRs so that the geometric center is not the actual explosion site. Furthermore, an assumption of age is necessary to convert geometric offsets to NS velocities, but SNR dynamical ages are often uncertain by a factor of (e.g., G350.10.3 has a calculated age of 600–1200 years: Lovchinsky et al. 2011) and have correlated errors with SNR distance estimates. In addition, growing evidence shows that spin–down ages of NSs might not represent the true ages of the sources (Popov & Turolla, 2012; Nakano et al., 2015; Rogers & Safi-Harb, 2017).
Proper motion measurements yield more accurate velocities but require multiple epochs of high spatial resolution images over a long time baseline. The average transverse velocity of isolated radio pulsars is close to 250 km s-1 (Hobbs et al., 2005), which corresponds to a motion of only 0.2′′ over a 10-year baseline for a Milky Way remnant at a distance of 3 kpc. Thus, sub-arcsecond spatial resolution is crucial for measuring NS proper motions, and Chandra is the only current X-ray facility with that capability.
We searched the literature for reported NS velocities associated with Galactic SNRs, preferably using proper motions, but including those estimated using the geometric offset method. NS proper motions have been accurately measured in four SNRs that meet our selection criteria (CTB 109, IC 443, Puppis A, and PKS 120951) using Chandra or near-infrared imaging. These values and associated references are listed in Table 2.
In addition, three SNRs (Cas A, G292.01.8, and W44) in our sample have NS velocities measured in the literature using methods other than the geometric offset or NS proper motion, and we adopt these values in our analysis. The explosion sites of Cas A and G292.01.8 were inferred from the motion of filaments detected through extensive monitoring of these SNRs (Thorstensen et al., 2001; Fesen et al., 2006; Winkler et al., 2009). Given the inferred distances and ages to these sources, we calculate the transverse velocities of their associated NSs using the inferred explosion sites and the current position of the NSs.
The velocity of the NS B195301 in the SNR W44 was estimated using multiple methods resulting in velocities of 315–470 km s-1 with a median value of 375 km s-1 (Frail et al., 1996a). These methods include the geometric offset method, a relation between the NS’s velocity and the SNR shock velocity, and balancing pressure between the PWN and the hot gas interior in W44 (see Frail et al. 1996a for more details).
For all other targets, we searched for multi-epoch Chandra archival observations to derive our own transverse NS velocities. Five sources (G11.20.3, G15.90.2, Kes 73, MSH 1162, and RCW 103) had multiple ACIS observations over a baseline of 10 years (see Table 1 for details). For each SNR, we used the two observations over the longest baseline in which the NS was detected to measure the NS proper motion. The observations used are listed in Table 1, denoted by the rows with “NS” as the purpose.
The astrometric accuracy of Chandra ACIS222See http://cxc.harvard.edu/cal/ASPECT/celmon/ is 0.6′′, which is of the same order of magnitude as the expected NS motion over the 10 year baselines. To improve this accuracy, we performed an astrometric correction using the positions of point sources across two epochs of Chandra observations (a similar method as in e.g., Section 2 of Becker et al. 2012). We identified point sources detected in all epochs of observations and separated them into two categories: sources associated with optical stars from the UCAC4 catalog (Zacharias et al., 2013) and sources likely to be active galactic nuclei (AGN) based on their high X-ray hardness ratios. We derived the true positions of the stars at both epochs, accounting for their proper motions, and assumed that AGN, as background sources, do not move. We calculated an error-weighted average of the difference in identified point sources’ known positions and their Chandra positions (as measured using the ciao command wavdetect) and used this value to correct the position of the NSs at each epoch. These corrected positions are used to calculate the NS’s motion over the two epochs. The velocities, along with their errors and directions, are listed in Table 2.
This method produces uncertainties of tens to hundreds of km s-1 and is likely more representative of the true velocities than those derived from geometric offsets. If the resulting proper motions were consistent with zero km s-1 at the 1- level and/or the velocity is significantly above 1000 km/s at the 1- level (as was the case for G11.20.3 and G15.90.2), then we adopted the velocity given by the geometric offset method. For the remaining remnants that did not have multi-epoch Chandra observations, we estimated the NS velocities using their offsets from the geometric center of the SNR and assume the SNRs’ dynamical ages are the NSs’ ages (listed in Table 2).
3.4. Checks

To verify the robustness of the PRM, we compared the derived power-ratios for individual sources observed with both Chandra and ROSAT. These values were consistent across our sample. We also explored whether the power-ratios correlated with physical size or age of the SNRs, and we found no statistically significant trends between any of these parameters.
Furthermore, we investigated whether the estimated NS velocities depended on the time baseline between the multi-epoch observations. For example, the reported velocity of the NS in Puppis A has decreased as observations with longer baselines were used, going from 1122 to 672 km s-1 with 5.5- and 10.5-year baselines, respectively (Hui & Becker, 2006; Becker et al., 2012). In our sample, we note that no NS proper motions with 10 year baselines had velocities over 1000 km s-1. Thus, long baselines (10 years) reduce systematic uncertainties and are crucial to derive reliable NS proper motions.
4. Results
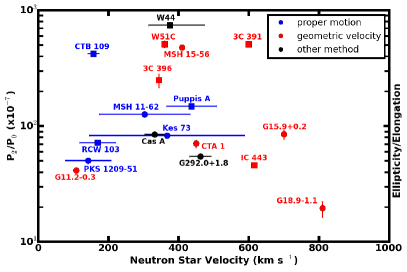
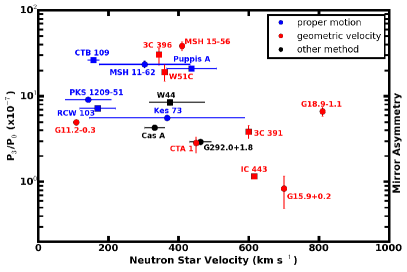
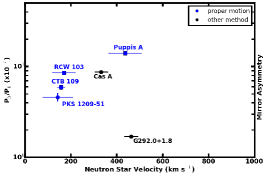
Figure 2 shows the quadrupole power-ratio (left) and octupole power-ratio (right) versus the NS transverse velocities using the center-of-emission as the origin of the multipole expansion. We find no correlation between either or and NS velocity. This lack of a significant correlation holds for both the proper motion and geometric offset velocity estimates when taking into account the large errors of the geometric estimates. In addition, both non-interacting and interacting SNRs (presented as circles and squares in Figure 2, respectively) do not show a trend in the power-ratios versus NS velocity. However, we note that most SNRs with large and are known to be interacting.
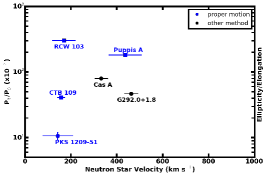
When we adopted the explosion site as the origin of the multipole expansion, we also found no correlation between the power-ratios (dipole, quadrupole, or octupole) and the NS velocities (see Figure 3). We note that the interacting SNRs tend to have larger dipole power-ratios than the non-interacting SNRs. However, the sample size of six SNRs in this analysis is small.
In addition to examining the magnitude of the power-ratios and NS velocities, we also investigated their directions. Each power-ratio – the dipole (P1/P0), quadrupole (P2/P0), and octupole (P3/P0) – has an associated direction. The dipole power-ratio angle points toward the bulk of the X-ray emission. The quadrupole power-ratio angle represents the semi-major axis of the ellipse that best matches the SNR’s X-ray emission. The octupole power-ratio angle points in the direction of the largest mirror asymmetry.
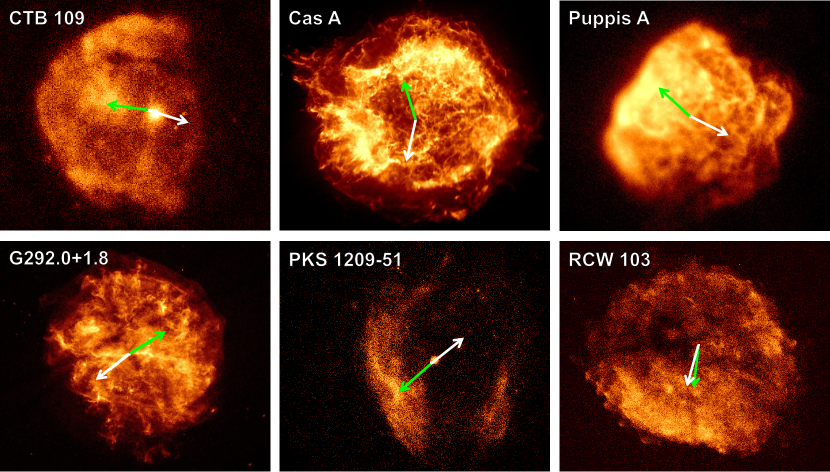
We compared the angle associated with each multipole term to the direction of the NS’s motion. For this analysis, we only used the six SNRs that had accurate explosion sites determined by NS or filament proper motion measurements (CTB 109, Cas A, Puppis A, G292.01.8, PKS 120951, RCW 103). Figure 4 shows images of these SNRs with their dipole angle and NS direction of motion labeled. We do not perform this calculation using the center-of-emission as the origin for the power-ratio analysis because the NS does not originate from the center-of-emission. Thus the difference in angles has no physical significance.
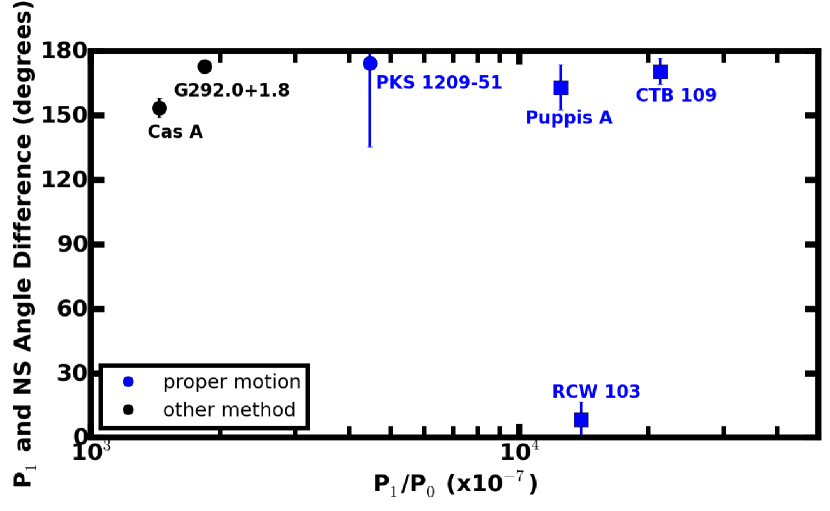
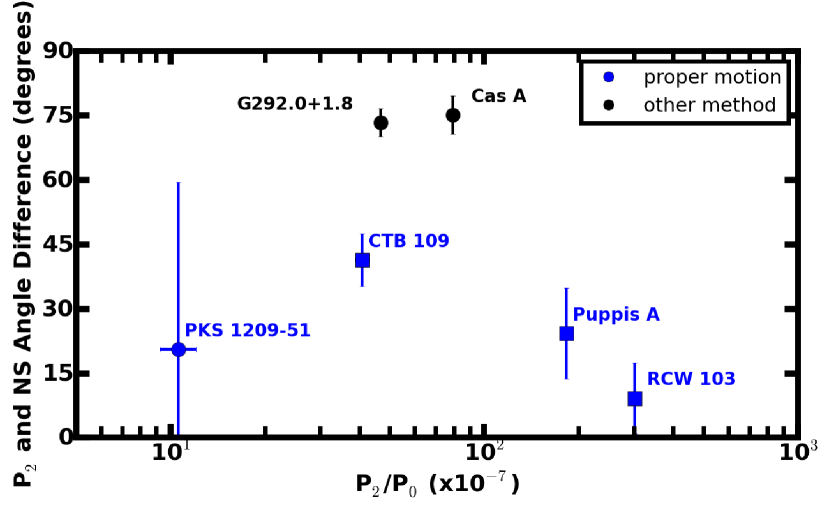
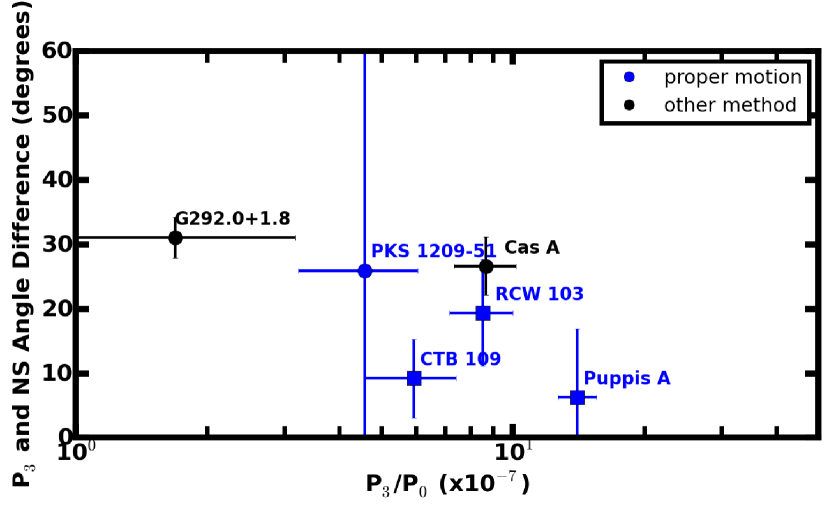
Figures 5 and 6 show the difference in the direction of the dipole, quadrupole, and octupole power-ratios and the direction of NS propagation, as a function of the respective power-ratios. Five of the six SNRs with well-constrained explosion sites (Cas A, G292.01.8, CTB 109, Puppis A, and PKS 120951) yielded dipole angle differences of 155–180∘, indicating that the NS is moving in the opposite direction as the majority of emission. However, in RCW 103, the NS is moving in the same direction as the dipole angle. We see no statistically significant trend for either the quadrupole or octupole power-ratio angle measurements. In the next paragraphs, we discuss each of the six sources of Figure 5 in turn, focusing on whether emission arises from ejecta or CSM/ISM. If the remnants’ emission are ejecta dominated, then the data in Figure 5 reflect the direction of ejecta compared to the NSs’ motion and thus can be compared to the predictions of SN explosion simulations. Otherwise, the emission may trace the CSM/ISM and be unrelated to the explosion and kick mechanism.
The dipole of Cas A points to the north/northeast, while the NS is moving to the south/southwest, producing an angle difference of 155∘. This result is consistent with the finding of Hwang & Laming (2012) who showed that the ejecta are recoiling in a direction that is 150∘ from the NS’s motion. As the youngest CC SNR known in the Milky Way, Cas A’s emission is ejecta-dominated (Hwang & Laming, 2012; Rutherford et al., 2013), and thus its morphology reflects the asymmetries of the explosion.
G292.01.8 is another SNR with ejecta-dominated emission where the NS direction (moving to the southeast) is opposite to the bulk of emission toward the northwest. As discussed in Section 2.1, G292.01.8 has shock-heated emission from CSM/ISM along the equatorial belt, but the dipole angle points to ejecta in the northwest. Thus, we conclude that the dipole angle reflects the bulk distribution of ejecta in G292.01.8.
PKS 120951 (G296.510.0) is the third SNR where the majority of the emission (to the southeast) is opposite to the NS’s motion (to the northwest). Although the SNR is bright in GeV gamma-rays (Araya, 2013), no other indicators of molecular cloud interaction have been found. Thus, it is unclear whether inhomogeneous heating from CSM/ISM interactions has altered the SNR’s X-ray morphology and affected the dipole angle direction. In addition, while the X-ray emission originates from a thermal plasma (Kellett et al., 1987), the abundances cannot be constrained with existing data, so the thermal emission could arise from ejecta or CSM/ISM.
Puppis A (G260.43.4) also has the majority of emission (to the northeast) opposite to the NS’s motion (to the southwest). The dipole angle points to a region with super-solar abundances, indicating an ejecta origin for that emission (Dubner et al., 2013). However, it is likely enhanced due to an interaction with a molecular cloud there. Furthermore, as discussed in Section 2.1, the integrated emission of the SNR is dominated by CSM/ISM overall. Thus, the X-ray morphology is influenced by the environment and may not reflect the distribution of the ejecta.
For CTB 109, the dipole direction is oriented toward the east while the NS is moving to the west. Spectral models by Sasaki et al. (2013) demonstrate that the SNR has significant ejecta emission in the 0.52.1 keV band. However, enhanced emission in the northeast results from interaction with ISM, and the west is dim because of a GMC complex there. Thus, the X-ray morphology may be reflective of its numerous interactions.
The NS in RCW 103 is moving in the same direction as the dipole angle (toward the southeast), contrary to the results from the other SNRs. The most likely reason for this result is that RCW 103 is interacting with a molecular cloud to the south (Frank et al., 2015), enhancing X-ray emission there. As Frank et al. (2015) discussed, the ejecta emission seems well-mixed with the CSM/ISM emission. There are no regions where ejecta dominates the emission relative to that from the CSM/ISM (like there are in CTB 109 and Puppis A), so the molecular cloud interaction plays the largest role in governing the dipole direction. Thus, the 0∘ angle difference may not reflect the relationship between the ejecta distribution and NS motion.
In addition, we note that the NS in RCW 103 has an unusual 6.67-hour periodicity, whose formation history is unknown (e.g., De Luca et al. 2008; Tong et al. 2016; Ho & Andersson 2017; D’Aì et al. 2016). Thus, an unusual explosion may have also affected the relationship between the bulk of the ejecta and the NS kick.
5. Discussion
We find no correlation between the NS velocities and the magnitude of the power-ratios in the 0.5–2.1 keV images. This result holds whether we adopt the center-of-emission (Figure 2) or the explosion site (Figure 3) as the origin of the multipole expansions. This finding implies that the small-scale (elliptical and mirror) asymmetries in the X-ray emission and the NS kicks may arise from or be affected by different processes. However, given the limitations of the geometric method (see Section 3.3), NS velocities estimated this way are not reliable (nine sources in our sample). Therefore, it is necessary to obtain more NS proper motion measurements before we can conclude robustly that small-scale asymmetries are uncorrelated with NS velocities. Additionally, we note that eight SNRs in our sample are interacting with molecular clouds. These interactions alter their X-ray morphologies and may produce their large power-ratios presented in Figure 2.
We do find a correlation between the dipole angle and the direction of NS motion in the explosion-site analysis: five out of the six SNRs (CTB 109, Cas A, Puppis A, G292.01.8, and PKS 120951) with reliable explosion site constraints have dipole moments directed opposite to the NS kick (see Figure 5). As discussed in Section 4, the X-ray emission in two of these SNRs (Cas A, and G292.01.8) is ejecta-dominated. It is unknown if the emission from PKS 120951 arises from ejecta or CSM/ISM, and both CTB 109’s and Puppis A’s interactions with molecular clouds may have affected their dipole angles. Consequently, it may be coincidental that these sources exhibit the 180∘ difference between dipole angle and NS direction. However, CTB 109 and Puppis A do have distinct ejecta knots found in the opposite direction as their NSs’ motion. It is unlikely that three out of the four interacting remnants by chance have emission directly opposed to their NSs’ motion (consistent with the ejecta-dominated remnants) if the dipole moment direction is due to molecular cloud interaction alone. Thus, it is probable that the ejecta of these remnants contribute to their emission and dipole directions.
RCW 103 has a dipole angle in the same direction as the NS’s motion. However, the X-ray morphology of RCW 103 may not reflect the ejecta distribution because of the bright emission produced by interaction with a molecular cloud. In addition, RCW 103 has no distinct, X-ray bright ejecta knots (Frank et al., 2015) to influence the dipole direction, so the relation of the ejecta dipole moment to the emission dipole moment is unknown.
Given that both of the ejecta-dominated sources and three other SNRs with possible ejecta emission have NSs moving opposite to their emission, our results are consistent with NSs being kicked opposite to the bulk of the SN ejecta (Wongwathanarat et al., 2013; Müller, 2016; Janka, 2017) rather than by anisotropic neutrino emission (Fryer & Kusenko, 2006).
Given the anti-correlation between NS direction and the position of the ejecta, we expect that there might be a relationship between the magnitude of the dipole power-ratios and the magnitude of the NS velocities. However, our small sample size prevents us from drawing a conclusion about the presence of such a trend. As shown in Figure 3, the remnants affected by CSM/ISM interactions have systematically higher dipole asymmetries than the ejecta-dominated remnants. Only Cas A and G292.01.8 are ejecta-dominated and two sources are not enough to draw a robust conclusion about the relationship between SNR ejecta and the magnitude of SNR velocities. In order to test robustly the relationship between NS velocities and the magnitude of SNR ejecta asymmetries, a larger sample of non-interacting SNRs with ejecta-dominated emission is needed.
We note that our bandpass is dominated by emission from O, Mg, and Si. Recent theoretical work predicts the distributions of O and Mg are only marginally correlated with NS motion, whereas heavier elements (Si and above) exhibit significant enhancement in the direction opposite to the NS kick (Wongwathanarat et al., 2013). These heavy metals are better tracers of explosion asymmetries; thus the dipole magnitude from only heavy element emission may show a stronger correlation with NS kick velocity than the emission in the 0.5–2.1 keV band. Future work can test this hypothesis, although only young SNRs have detectable radioactive Ti or are hot enough to produce Fe K emission (the Fe L complex at 0.9–1.1 keV is not optimal for this analysis because it is blended with Ne lines at CCD energy resolution, and absorption attenuates the emission at these lower energies).
The uncertainties in NS velocities limit the inferences we can draw from the data. The geometric method for assessing NS velocities requires several assumptions, as discussed in Section 3.3, making this method less reliable than other measurements. To get accurate transverse velocities, measurements of NS proper motions or of SNR filament expansions are needed. However, these studies require repeated, high spatial resolution images over 10 years. Among our sample, three SNRs (G11.20.3, G15.90.2, and W44) do not have NS proper motion measurements in the literature nor have long enough baselines in their multi-epoch Chandra ACIS observations to resolve the NS proper motion. Longer time baselines and the use of high spatial resolution imaging are crucial to measure NS positions and proper motions reliably.
6. Conclusion
We have investigated the relationship between NS velocities and SNR soft X-ray morphologies as imaged by ROSAT and Chandra in a sample of 18 Galactic sources. NS velocities are estimated using either proper motion measurements or the geometric method, and SNR asymmetries are quantified using the power-ratio method. In our sample of SNRs with robust explosion site determinations, we found that five out of six (CTB 109, Cas A, PKS 120951, G292.01.8, and Puppis A) have NS motions directed opposite to the majority of their X-ray emission. The X-ray emission reflects the distribution of ejecta in two of these SNRs (Cas A and G292.01.8). Two other SNRs (CTB 109 and Puppis A) show evidence of ejecta emission in the direction of the dipole moment, but significant CSM/ISM contribution makes it unclear if their morphologies reflect the ejecta. It is unknown how interactions have affected the shape of PKS 120951. Although environment may influence the morphologies of these SNRs, it is unlikely that three out of the four interacting SNRs with well-constrained explosion sites have the same trend as the ejecta-dominated remnants unless ejecta contribute non-negligibly to the emission.
Contrary to the other remnants, in RCW 103 the dipole moment points in the same direction as the NS motion (toward the southeast). However, molecular cloud interactions have enhanced the emission there, influencing the direction of the dipole. As it is hard to disentangle the CSM emission from the ejecta emission in the rest of this SNR, it remains possible that the NS is moving opposite of ejecta.
As both Cas A and G292.01.8 are ejecta-dominated, our results are consistent with predictions from models where the NS is kicked by ejecta asymmetries (Scheck et al., 2006; Wongwathanarat et al., 2013; Müller, 2016; Janka, 2017).
We did not find a correlation between the magnitude of SNR asymmetries and NS velocities. However, the absence of a trend may be due to the large uncertainties in NS velocity measurements and not being able to disentangle CSM/ISM and ejecta components sufficiently. In our sample, only two remnants are both ejecta-dominated and have precise NS velocities measured via proper motions. More X-ray observations of young SNRs and precise proper motion measurements of NSs are necessary to search for a robust trend in the relationship between NS velocities and SNR ejecta asymmetries.
Future work can help to elucidate the role of SN explosion and the surrounding environment in shaping SNRs. For example, SNRs’ asymmetries may evolve with age, particularly as mature SNR morphologies reflect their environments (e.g., Gaensler 1998; West et al. 2016). In addition, explosion asymmetries may differ by nature or characteristics of the compact objects (e.g., neutron stars or black holes; magnetic field strength of the NSs). For example, Duncan & Thompson (1992) suggested that magnetars may be formed by progenitors with rapidly-rotating cores that lead to bipolar explosions. A correlation between SNR quadrupole power-ratio and NS magnetic field would support this scenario.
| Source | ObsID | PurposeaaPRM indicates the observations were merged and used to calculate the power-ratios. NS indicates that the observations were used to calculate a NS proper motion. For the latter, two epochs were used for each calculation: ObsID values below 10000 were merged for the first epoch, and ObsID values above 10000 were summed for the second epoch. | ExposurebbThe summed exposure time in kiloseconds for all observations used to calculate the power-ratios. | BaselineccTime in years between epochs of images used to calculate NS proper motion. |
|---|---|---|---|---|
| (ks) | (yrs) | |||
| Chandra Observations | ||||
| G011.200.3 | 14830,14831,14832,15652,16323 | PRM | 388 | |
| 780,781,15652,16323 | NS | 13 | ||
| G015.900.2 | 5530,6288,6289,16766 | PRM | 121 | |
| 5530,6288,6289,16766 | NS | 10 | ||
| Kes 73 | 6732,16950,17668,17692,17693 | PRM | 120 | |
| 6732,17668,17692,17693 | NS | 15 | ||
| 3C 391 | 2786 | PRM | 60.9 | |
| W44 | 5548,6312,11231 | NS | 10 | |
| 3C 396 | 1988 | PRM | 98.4 | |
| Cas A | 4634,4635,4636,4637,4638 | PRM | 755 | |
| IC 443 | 5531,13736 | NS | 7 | |
| MSH 11–62 | 14822,14823,14824,16497,16512,16541,16566 | PRM | 358 | |
| 2782,14822,14824 | NS | 11 | ||
| G292.001.8 | 6677,6678,6679,8221,8447 | PRM | 470 | |
| RCW 103 | 11823,12224,17460 | PRM | 105 | |
| 123,17460 | NS | 16 | ||
| ROSAT Observations | ||||
| G018.901.1 | rp500040n00 | PRM | 14 | |
| W44 | rp500019n00 | PRM | 7.5 | |
| W51C | rp500152n00,rp500153a02,rp500153a01,rp500153n00 | PRM | 16.5 | |
| CTB 109 | rp400314n00,rp500064n00 | PRM | 40.6 | |
| CTA 1 | rp500070n00,rp500072n00,rp500073n00 | PRM | 24.5 | |
| G189.103.0 | rp500020n00,rp500021n00,rp500022n00,rp500045a00,rp500045a01 | PRM | 29.1 | |
| Puppis A | rp500055a01,rp500055n00,rp500056a01,rp500056n00,rp500057a01,rp500057n00 | PRM | 17.2 | |
| PKS 1209–51 | rp500239n00,rp500241n00,rp500242n00,rp500243n00 | PRM | 20.6 | |
| MSH 15–56 | rp500010n00 | PRM | 3.78 | |
| Source | Alt. | SizeaaThe values used in our analysis. The errors vary from source to source and can be found in the references. | AgeaaThe values used in our analysis. The errors vary from source to source and can be found in the references. | DistanceaaThe values used in our analysis. The errors vary from source to source and can be found in the references. | NS | NS | NS | NS | NS | NoteseeNotes include whether the source has a pulsar wind nebula (PWN), an anomalous X-ray pulsar (AXP), a soft gamma-ray repeater (SGR), or a Central Compact Object (CCO), whether the source is adjacent to or is interacting with an H ii region or molecular cloud (MC), and whether the source is considered a “mixed-morphology” SNR. | References | |
|---|---|---|---|---|---|---|---|---|---|---|---|---|
| Name | (arcmin) | (kyr) | (kpc) | Velocity | Velocity | DirectionccDirection is in the format where 0∘ points North, 90∘ points East, etc. | Direction | Methoddd“pm” denotes proper motion method, “geo” denotes geometric estimate, “exp” denotes expansion center via filament motion, and “mul” denotes multiple converging estimates. | ||||
| (km s-1) | 1- ErrorbbWe do not include error bars for or directions of the velocities calculated using the geometric method, as they do not reflect the uncertainty in attributing the geometric center as the explosion site. | (Degrees) | 1- Error | |||||||||
| G011.200.3 | SN AD386 | 4.0 | 1.65 | 4.4 | 108 | geo | PWN | 1,2 | ||||
| G015.900.2 | 7.0 | 2 | 8.5 | 700 | geo | 3 | ||||||
| G018.901.1 | 33 | 5.3 | 2 | 830 | geo | PWN | 4,5 | |||||
| G027.400.0 | Kes 73 | 4.0 | 2 | 7.5 | 367 | 222 | 78 | 31 | pmffThe proper motion was calculated in this work using Chandra ACIS observations. | AXP | 6,7 | |
| G031.900.0 | 3C 391 | 7.0 | 17 | 7.2 | 259 | geo | MC | 8,9,10,11 | ||||
| G034.700.4ggThe direction of motion of the NS in W44 is not reported in the literature. | W44 | 35 | 20 | 3 | 370 | 70 | 160 | mul | PWN; MM | 12,13,14 | ||
| G039.200.3 | 3C 396 | 8.0 | 3 | 6.2 | 344 | geo | PWN; MC | 15,16,17,18 | ||||
| G049.200.7 | W51C | 30 | 30 | 4.3 | 360 | geo | PWN; MC | 19,20,21 | ||||
| G109.101.0 | CTB 109 | 28 | 11 | 3.2 | 157 | 17 | 253 | 6 | pm | AXP | 22,23,24 | |
| G111.702.1 | Cas A | 5.0 | 0.33 | 3.4 | 332 | 20 | 170 | 5 | exp | CCO | 25,26 | |
| G119.510.2 | CTA 1 | 90 | 13 | 1.4 | 450 | geo | AXP | 27,28 | ||||
| G189.103.0 | IC 443 | 45 | 10 | 1.5 | 160hhThe proper motion of the NS in IC 443 was calculated in Swartz et al. (2015) using Chandra ACIS observations over a 7–year baseline. It is consistent with zero at the 1- level and has large directional errors, so we use the geometric estimate of 615 km s-1 in our analysis. | 240 | 270 | 87 | pm | MM; MC | 29 | |
| G260.403.4 | Puppis A | 60 | 4.5 | 2 | 437 | 72 | 244 | 11 | pm | 30,31 | ||
| G291.000.1 | MSH 1162 | 15 | 5.8 | 5 | 303 | 130 | 304 | 22 | pmffThe proper motion was calculated in this work using Chandra ACIS observations. | PWN | 32,33 | |
| G292.001.8 | MSH 11-54 | 12 | 3 | 6.3 | 462 | 31 | 128 | 11 | exp | PWN | 34,35,36 | |
| G296.510.0 | PKS 120951 | 90 | 7 | 2 | 142 | 66 | 307 | 39 | pm | 37,38,39 | ||
| G326.301.8 | MSH 1556 | 38 | 16.5 | 4.1 | 410 | geo | 40,41,42 | |||||
| G332.400.4 | RCW 103 | 10 | 2 | 3.3 | 169 | 51 | 163 | 8 | pmffThe proper motion was calculated in this work using Chandra ACIS observations. | SGR; MC | 7,43 |
Note. — References are as follows
[1] Kaspi et al. (2001)
[2] Dean et al. (2008)
[3] Reynolds et al. (2006)
[4] Harrus et al. (2004)
[5] Tüllmann et al. (2010)
[6] Kuiper et al. (2004)
[7] Lopez et al. (2011)
[8] Chen et al. (2004)
[9] Kawasaki et al. (2005)
[10] Su et al. (2014)
[11] Sato et al. (2014)
[12] Harrus et al. (1997)
[13] Shelton et al. (2004)
[14] Frail et al. (1996a)
[15] Harrus & Slane (1999)
[16] Safi-Harb et al. (2005)
[17] Olbert et al. (2003)
[18] Su et al. (2011)
[19] Koo et al. (1995)
[20] Koo et al. (2005)
[21] Tian & Leahy (2013)
[22] Patel et al. (2001)
[23] Tendulkar et al. (2013)
[24] Kothes & Foster (2012)
[25] Hwang et al. (2004)
[26] Thorstensen et al. (2001)
[27] Halpern et al. (2004)
[28] Slane et al. (2004)
[29] Swartz et al. (2015)
[30] Becker et al. (2012)
[31] Reynoso et al. (2017)
[32] Harrus et al. (1998)
[33] Slane et al. (2012)
[34] Vink et al. (2004)
[35] Park et al. (2007)
[36] Winkler et al. (2009)
[37] Vasisht et al. (1997)
[38] Zavlin et al. (2000)
[39] Halpern & Gotthelf (2015)
[40] Kassim et al. (1993)
[41] Temim et al. (2013)
[42] Sun et al. (1999)
[43] D’Aì et al. (2016)
References
- Abdo et al. (2009) Abdo, A. A., Allen, B. T., Aune, T., et al. 2009, ApJ, 700, L127
- Acciari et al. (2009) Acciari, V. A., Aliu, E., Arlen, T., et al. 2009, ApJ, 698, L133
- Ackermann et al. (2013) Ackermann, M., Ajello, M., Allafort, A., et al. 2013, Science, 339, 807
- Aleksić et al. (2012) Aleksić, J., Alvarez, E. A., Antonelli, L. A., et al. 2012, A&A, 541, A13
- Anders & Grevesse (1989) Anders, E., & Grevesse, N. 1989, Geochim. Cosmochim. Acta, 53, 197
- Araya (2013) Araya, M. 2013, MNRAS, 434, 2202
- Arendt et al. (2010) Arendt, R. G., Dwek, E., Blair, W. P., et al. 2010, ApJ, 725, 585
- Arnaud (1996) Arnaud, K. A. 1996, in Astronomical Society of the Pacific Conference Series, Vol. 101, Astronomical Data Analysis Software and Systems V, ed. G. H. Jacoby & J. Barnes, 17
- Arzoumanian et al. (2002) Arzoumanian, Z., Chernoff, D. F., & Cordes, J. M. 2002, ApJ, 568, 289
- Aschenbach (1993) Aschenbach, B. 1993, Advances in Space Research, 13
- Auchettl et al. (2015) Auchettl, K., Slane, P., Romani, R. W., et al. 2015, ApJ, 802, 68
- Badenes et al. (2010) Badenes, C., Maoz, D., & Draine, B. T. 2010, MNRAS, 407, 1301
- Becker et al. (2012) Becker, W., Prinz, T., Winkler, P. F., & Petre, R. 2012, ApJ, 755, 141
- Bhalerao et al. (2015) Bhalerao, J., Park, S., Dewey, D., et al. 2015, ApJ, 800, 65
- Bieging (1975) Bieging, J. 1975, in Lecture Notes in Physics, Berlin Springer Verlag, Vol. 42, H II regions and related topics, ed. T. L. Wilson & D. Downes, 443
- Blackburn (1995) Blackburn, J. K. 1995, in Astronomical Society of the Pacific Conference Series, Vol. 77, Astronomical Data Analysis Software and Systems IV, ed. R. A. Shaw, H. E. Payne, & J. J. E. Hayes, 367
- Bocchino et al. (2009) Bocchino, F., Miceli, M., & Troja, E. 2009, A&A, 498, 139
- Boggs et al. (2015) Boggs, S. E., Harrison, F. A., Miyasaka, H., et al. 2015, Science, 348, 670
- Borkowski et al. (2016) Borkowski, K. J., Reynolds, S. P., & Roberts, M. S. E. 2016, ApJ, 819, 160
- Braun & Strom (1986) Braun, R., & Strom, R. G. 1986, A&A, 164, 193
- Brogan et al. (2013) Brogan, C. L., Goss, W. M., Hunter, T. R., et al. 2013, ApJ, 771, 91
- Buote & Tsai (1995) Buote, D. A., & Tsai, J. C. 1995, ApJ, 452, 522
- Buote & Tsai (1996) —. 1996, ApJ, 458, 27
- Carpenter & Sanders (1998) Carpenter, J. M., & Sanders, D. B. 1998, AJ, 116, 1856
- Carter et al. (1997) Carter, L. M., Dickel, J. R., & Bomans, D. J. 1997, PASP, 109, 990
- Castro et al. (2013) Castro, D., Slane, P., Carlton, A., & Figueroa-Feliciano, E. 2013, ApJ, 774, 36
- Castro et al. (2012) Castro, D., Slane, P., Ellison, D. C., & Patnaude, D. J. 2012, ApJ, 756, 88
- Chatterjee et al. (2005) Chatterjee, S., Vlemmings, W. H. T., Brisken, W. F., et al. 2005, ApJ, 630, L61
- Chen & Slane (2001) Chen, Y., & Slane, P. O. 2001, ApJ, 563, 202
- Chen et al. (2004) Chen, Y., Su, Y., Slane, P. O., & Wang, Q. D. 2004, ApJ, 616, 885
- Chevalier & Kirshner (1978) Chevalier, R. A., & Kirshner, R. P. 1978, ApJ, 219, 931
- Claussen et al. (1997) Claussen, M. J., Frail, D. A., Goss, W. M., & Gaume, R. A. 1997, ApJ, 489, 143
- Copetti & Schmidt (1991) Copetti, M. V. F., & Schmidt, A. A. 1991, MNRAS, 250, 127
- Cornett et al. (1977) Cornett, R. H., Chin, G., & Knapp, G. R. 1977, A&A, 54, 889
- Cox et al. (1999) Cox, D. P., Shelton, R. L., Maciejewski, W., et al. 1999, ApJ, 524, 179
- D’Aì et al. (2016) D’Aì, A., Evans, P. A., Burrows, D. N., et al. 2016, MNRAS, 463, 2394
- de Luca (2008) de Luca, A. 2008, in American Institute of Physics Conference Series, Vol. 983, 40 Years of Pulsars: Millisecond Pulsars, Magnetars and More, ed. C. Bassa, Z. Wang, A. Cumming, & V. M. Kaspi, 311–319
- De Luca et al. (2006) De Luca, A., Caraveo, P. A., Mereghetti, S., Tiengo, A., & Bignami, G. F. 2006, Science, 313, 814
- De Luca et al. (2008) De Luca, A., Mignani, R. P., Zaggia, S., et al. 2008, ApJ, 682, 1185
- Dean et al. (2008) Dean, A. J., de Rosa, A., McBride, V. A., et al. 2008, MNRAS, 384, L29
- DeLaney et al. (2010) DeLaney, T., Rudnick, L., Stage, M. D., et al. 2010, ApJ, 725, 2038
- Dickel et al. (2000) Dickel, J. R., Milne, D. K., & Strom, R. G. 2000, ApJ, 543, 840
- Downes (1984) Downes, A. 1984, MNRAS, 210, 845
- Dubner et al. (2013) Dubner, G., Loiseau, N., Rodríguez-Pascual, P., et al. 2013, A&A, 555, A9
- Duncan & Thompson (1992) Duncan, R. C., & Thompson, C. 1992, ApJ, 392, L9
- Esposito et al. (1996) Esposito, J. A., Sreekumar, P., Hunter, S. D., & Kanbach, G. 1996, in Bulletin of the American Astronomical Society, Vol. 28, American Astronomical Society Meeting Abstracts, 1346
- Fahlman & Gregory (1981) Fahlman, G. G., & Gregory, P. C. 1981, Nature, 293, 202
- Faucher-Giguère & Kaspi (2006) Faucher-Giguère, C.-A., & Kaspi, V. M. 2006, ApJ, 643, 332
- Feinstein et al. (2009) Feinstein, F., Fiasson, A., Gallant, Y., et al. 2009, in American Institute of Physics Conference Series, Vol. 1112, American Institute of Physics Conference Series, ed. D. Bastieri & R. Rando, 54–62
- Fesen et al. (2006) Fesen, R. A., Hammell, M. C., Morse, J., et al. 2006, ApJ, 645, 283
- Foster et al. (2012) Foster, A. R., Ji, L., Smith, R. K., & Brickhouse, N. S. 2012, ApJ, 756, 128
- Frail et al. (1996a) Frail, D. A., Giacani, E. B., Goss, W. M., & Dubner, G. 1996a, ApJ, 464, L165
- Frail et al. (1996b) Frail, D. A., Goss, W. M., Reynoso, E. M., et al. 1996b, AJ, 111, 1651
- Frail & Mitchell (1998) Frail, D. A., & Mitchell, G. F. 1998, ApJ, 508, 690
- Frank et al. (2015) Frank, K. A., Burrows, D. N., & Park, S. 2015, ApJ, 810, 113
- Fryer & Kusenko (2006) Fryer, C. L., & Kusenko, A. 2006, ApJS, 163, 335
- Fuerst et al. (1997) Fuerst, E., Reich, W., & Aschenbach, B. 1997, A&A, 319, 655
- Gaensler (1998) Gaensler, B. M. 1998, ApJ, 493, 781
- Gaensler & Slane (2006) Gaensler, B. M., & Slane, P. O. 2006, ARA&A, 44, 17
- Ghavamian & Williams (2016) Ghavamian, P., & Williams, B. J. 2016, ApJ, 831, 188
- Goss et al. (1979) Goss, W. M., Shaver, P. A., Zealey, W. J., Murdin, P., & Clark, D. H. 1979, MNRAS, 188, 357
- Gotthelf et al. (2001) Gotthelf, E. V., Koralesky, B., Rudnick, L., et al. 2001, ApJ, 552, L39
- Gotthelf & Vasisht (1997) Gotthelf, E. V., & Vasisht, G. 1997, ApJ, 486, L133
- Green et al. (1997) Green, A. J., Frail, D. A., Goss, W. M., & Otrupcek, R. 1997, AJ, 114, 2058
- Green (2014) Green, D. A. 2014, Bulletin of the Astronomical Society of India, 42, 47
- Grefenstette et al. (2017) Grefenstette, B. W., Fryer, C. L., Harrison, F. A., et al. 2017, ApJ, 834, 19
- Gregory & Fahlman (1980) Gregory, P. C., & Fahlman, G. G. 1980, Nature, 287, 805
- Halpern & Gotthelf (2010) Halpern, J. P., & Gotthelf, E. V. 2010, ApJ, 725, 1384
- Halpern & Gotthelf (2015) —. 2015, ApJ, 812, 61
- Halpern et al. (2004) Halpern, J. P., Gotthelf, E. V., Camilo, F., Helfand, D. J., & Ransom, S. M. 2004, ApJ, 612, 398
- Hanabata et al. (2013) Hanabata, Y., Sawada, M., Katagiri, H., Bamba, A., & Fukazawa, Y. 2013, PASJ, 65, 42
- Handa et al. (1987) Handa, T., Sofue, Y., Nakai, N., Hirabayashi, H., & Inoue, M. 1987, PASJ, 39, 709
- Harrus et al. (1997) Harrus, I. M., Hughes, J. P., Singh, K. P., Koyama, K., & Asaoka, I. 1997, ApJ, 488, 781
- Harrus et al. (1998) Harrus, I. M., Hughes, J. P., & Slane, P. O. 1998, ApJ, 499, 273
- Harrus & Slane (1999) Harrus, I. M., & Slane, P. O. 1999, ApJ, 516, 811
- Harrus et al. (2004) Harrus, I. M., Slane, P. O., Hughes, J. P., & Plucinsky, P. P. 2004, ApJ, 603, 152
- Helfand & Becker (1984) Helfand, D. J., & Becker, R. H. 1984, Nature, 307, 215
- Hewitt et al. (2009) Hewitt, J. W., Yusef-Zadeh, F., & Wardle, M. 2009, ApJ, 706, L270
- Ho & Andersson (2017) Ho, W. C. G., & Andersson, N. 2017, MNRAS, 464, L65
- Hobbs et al. (2005) Hobbs, G., Lorimer, D. R., Lyne, A. G., & Kramer, M. 2005, MNRAS, 360, 974
- Hughes et al. (2000) Hughes, J. P., Rakowski, C. E., Burrows, D. N., & Slane, P. O. 2000, ApJ, 528, L109
- Hughes et al. (1981) Hughes, V. A., Harten, R. H., & van den Bergh, S. 1981, ApJ, 246, L127
- Hui & Becker (2006) Hui, C. Y., & Becker, W. 2006, A&A, 457, L33
- Humphreys (1978) Humphreys, R. M. 1978, ApJS, 38, 309
- Hwang et al. (2005) Hwang, U., Flanagan, K. A., & Petre, R. 2005, ApJ, 635, 355
- Hwang & Laming (2003) Hwang, U., & Laming, J. M. 2003, ApJ, 597, 362
- Hwang & Laming (2012) —. 2012, ApJ, 746, 130
- Hwang et al. (2008) Hwang, U., Petre, R., & Flanagan, K. A. 2008, ApJ, 676, 378
- Hwang et al. (2004) Hwang, U., Laming, J. M., Badenes, C., et al. 2004, ApJ, 615, L117
- Inserra et al. (2016) Inserra, C., Bulla, M., Sim, S. A., & Smartt, S. J. 2016, ApJ, 831, 79
- Janka (2017) Janka, H.-T. 2017, ApJ, 837, 84
- Jeltema et al. (2005) Jeltema, T. E., Canizares, C. R., Bautz, M. W., & Buote, D. A. 2005, ApJ, 624, 606
- Jogler & Funk (2016) Jogler, T., & Funk, S. 2016, ApJ, 816, 100
- Johnston et al. (2005) Johnston, S., Hobbs, G., Vigeland, S., et al. 2005, MNRAS, 364, 1397
- Jones et al. (1993) Jones, L. R., Smith, A., & Angelini, L. 1993, MNRAS, 265, 631
- Kasen et al. (2009) Kasen, D., Röpke, F. K., & Woosley, S. E. 2009, Nature, 460, 869
- Kaspi et al. (2001) Kaspi, V. M., Roberts, M. E., Vasisht, G., et al. 2001, ApJ, 560, 371
- Kassim et al. (1993) Kassim, N. E., Hertz, P., & Weiler, K. W. 1993, ApJ, 419, 733
- Katsuda et al. (2010) Katsuda, S., Hwang, U., Petre, R., et al. 2010, ApJ, 714, 1725
- Katsuda et al. (2008) Katsuda, S., Mori, K., Tsunemi, H., et al. 2008, ApJ, 678, 297
- Kawasaki et al. (2005) Kawasaki, M., Ozaki, M., Nagase, F., Inoue, H., & Petre, R. 2005, ApJ, 631, 935
- Kawasaki et al. (2002) Kawasaki, M. T., Ozaki, M., Nagase, F., et al. 2002, ApJ, 572, 897
- Kellett et al. (1987) Kellett, B. J., Branduardi-Raymont, G., Culhane, J. L., et al. 1987, MNRAS, 225, 199
- Klochkov et al. (2016) Klochkov, D., Suleimanov, V., Sasaki, M., & Santangelo, A. 2016, A&A, 592, L12
- Koo (1999) Koo, B.-C. 1999, ApJ, 518, 760
- Koo et al. (1995) Koo, B.-C., Kim, K.-T., & Seward, F. D. 1995, ApJ, 447, 211
- Koo et al. (2002) Koo, B.-C., Lee, J.-J., & Seward, F. D. 2002, AJ, 123, 1629
- Koo et al. (2005) Koo, B.-C., Lee, J.-J., Seward, F. D., & Moon, D.-S. 2005, ApJ, 633, 946
- Koo & Moon (1997a) Koo, B.-C., & Moon, D.-S. 1997a, ApJ, 475, 194
- Koo & Moon (1997b) —. 1997b, ApJ, 485, 263
- Kothes & Foster (2012) Kothes, R., & Foster, T. 2012, ApJ, 746, L4
- Kuiper et al. (2004) Kuiper, L., Hermsen, W., & Mendez, M. 2004, ApJ, 613, 1173
- Kumar et al. (2014) Kumar, H. S., Safi-Harb, S., Slane, P. O., & Gotthelf, E. V. 2014, ApJ, 781, 41
- Kumar et al. (2004) Kumar, M. S. N., Kamath, U. S., & Davis, C. J. 2004, MNRAS, 353, 1025
- Kundu & Velusamy (1972) Kundu, M. R., & Velusamy, T. 1972, A&A, 20, 237
- Lai (2001) Lai, D. 2001, in Lecture Notes in Physics, Berlin Springer Verlag, Vol. 578, Physics of Neutron Star Interiors, ed. D. Blaschke, N. K. Glendenning, & A. Sedrakian, 424
- Lazendic & Slane (2006) Lazendic, J. S., & Slane, P. O. 2006, ApJ, 647, 350
- Lee et al. (2009) Lee, H.-G., Koo, B.-C., Moon, D.-S., et al. 2009, ApJ, 706, 441
- Lopez et al. (2009b) Lopez, L. A., Ramirez-Ruiz, E., Badenes, C., et al. 2009b, ApJ, 706, L106
- Lopez et al. (2011) Lopez, L. A., Ramirez-Ruiz, E., Huppenkothen, D., Badenes, C., & Pooley, D. A. 2011, ApJ, 732, 114
- Lopez et al. (2009a) Lopez, L. A., Ramirez-Ruiz, E., Pooley, D. A., & Jeltema, T. E. 2009a, ApJ, 691, 875
- Lovchinsky et al. (2011) Lovchinsky, I., Slane, P., Gaensler, B. M., et al. 2011, ApJ, 731, 70
- Luna et al. (2016) Luna, G. J. M., Smith, M. J. S., Dubner, G., Giacani, E., & Castelletti, G. 2016, A&A, 590, A70
- Lyne & Lorimer (1994) Lyne, A. G., & Lorimer, D. R. 1994, Nature, 369, 127
- Maeda (2012) Maeda, K. 2012, in IAU Symposium, Vol. 279, Death of Massive Stars: Supernovae and Gamma-Ray Bursts, ed. P. Roming, N. Kawai, & E. Pian, 261–268
- Maeda et al. (2010) Maeda, K., Röpke, F. K., Fink, M., et al. 2010, ApJ, 712, 624
- Maggi & Acero (2017) Maggi, P., & Acero, F. 2017, A&A, 597, A65
- Mazzali et al. (2001) Mazzali, P. A., Nomoto, K., Patat, F., & Maeda, K. 2001, ApJ, 559, 1047
- Milisavljevic & Fesen (2015) Milisavljevic, D., & Fesen, R. A. 2015, Science, 347, 526
- Mills et al. (1961) Mills, B. Y., Slee, O. B., & Hill, E. R. 1961, Australian Journal of Physics, 14, 497
- Mufson & Liszt (1979) Mufson, S. L., & Liszt, H. S. 1979, ApJ, 232, 451
- Müller (2016) Müller, B. 2016, Publications of the Astronomical Society of Australia, 33, e048
- Müller et al. (2017) Müller, B., Melson, T., Heger, A., & Janka, H.-T. 2017, ArXiv e-prints
- Murdin & Clark (1979) Murdin, P., & Clark, D. H. 1979, MNRAS, 189, 501
- Nakano et al. (2015) Nakano, T., Murakami, H., Makishima, K., et al. 2015, PASJ, 67, 9
- Ohnishi et al. (2014) Ohnishi, T., Uchida, H., Tsuru, T. G., et al. 2014, ApJ, 784, 74
- Olbert et al. (2003) Olbert, C. M., Keohane, J. W., Arnaud, K. A., et al. 2003, ApJ, 592, L45
- Oliva et al. (1990) Oliva, E., Moorwood, A. F. M., & Danziger, I. J. 1990, A&A, 240, 453
- Oliva et al. (1999) Oliva, E., Moorwood, A. F. M., Drapatz, S., Lutz, D., & Sturm, E. 1999, A&A, 343, 943
- Park et al. (2007) Park, S., Hughes, J. P., Slane, P. O., et al. 2007, ApJ, 670, L121
- Park et al. (2004) —. 2004, ApJ, 602, L33
- Park et al. (2002) Park, S., Roming, P. W. A., Hughes, J. P., et al. 2002, ApJ, 564, L39
- Patel et al. (2001) Patel, S. K., Kouveliotou, C., Woods, P. M., et al. 2001, ApJ, 563, L45
- Pavlov et al. (2004) Pavlov, G. G., Sanwal, D., & Teter, M. A. 2004, in IAU Symposium, Vol. 218, Young Neutron Stars and Their Environments, ed. F. Camilo & B. M. Gaensler, 239
- Peters et al. (2013) Peters, C. L., Lopez, L. A., Ramirez-Ruiz, E., Stassun, K. G., & Figueroa-Feliciano, E. 2013, ApJ, 771, L38
- Petre et al. (1982) Petre, R., Kriss, G. A., Winkler, P. F., & Canizares, C. R. 1982, ApJ, 258, 22
- Petre et al. (1988) Petre, R., Szymkowiak, A. E., Seward, F. D., & Willingale, R. 1988, ApJ, 335, 215
- Pinheiro Gonçalves et al. (2011) Pinheiro Gonçalves, D., Noriega-Crespo, A., Paladini, R., Martin, P. G., & Carey, S. J. 2011, AJ, 142, 47
- Plucinsky (1998) Plucinsky, P. P. 1998, Mem. Soc. Astron. Italiana, 69, 939
- Popov & Turolla (2012) Popov, S. B., & Turolla, R. 2012, Ap&SS, 341, 457
- Reach & Rho (1996) Reach, W. T., & Rho, J. 1996, A&A, 315, L277
- Reach & Rho (1999) —. 1999, ApJ, 511, 836
- Reach et al. (2005) Reach, W. T., Rho, J., & Jarrett, T. H. 2005, ApJ, 618, 297
- Rest et al. (2011) Rest, A., Foley, R. J., Sinnott, B., et al. 2011, ApJ, 732, 3
- Reynolds et al. (2006) Reynolds, S. P., Borkowski, K. J., Hwang, U., et al. 2006, ApJ, 652, L45
- Reynolds et al. (1994) Reynolds, S. P., Lyutikov, M., Blandford, R. D., & Seward, F. D. 1994, MNRAS, 271, L1
- Reynolds & Moffett (1993) Reynolds, S. P., & Moffett, D. A. 1993, AJ, 105, 2226
- Reynoso et al. (2017) Reynoso, E. M., Cichowolski, S., & Walsh, A. J. 2017, MNRAS, 464, 3029
- Rho & Petre (1998) Rho, J., & Petre, R. 1998, ApJ, 503, L167
- Rho et al. (1994) Rho, J., Petre, R., Schlegel, E. M., & Hester, J. J. 1994, ApJ, 430, 757
- Rho & Petre (1996) Rho, J.-H., & Petre, R. 1996, ApJ, 467, 698
- Roberts et al. (2003) Roberts, M. S. E., Tam, C. R., Kaspi, V. M., et al. 2003, ApJ, 588, 992
- Rogers & Safi-Harb (2017) Rogers, A., & Safi-Harb, S. 2017, MNRAS, 465, 383
- Rutherford et al. (2013) Rutherford, J., Dewey, D., Figueroa-Feliciano, E., et al. 2013, ApJ, 769, 64
- Safi-Harb et al. (2005) Safi-Harb, S., Dubner, G., Petre, R., Holt, S. S., & Durouchoux, P. 2005, ApJ, 618, 321
- Safi-Harb et al. (2001) Safi-Harb, S., Harrus, I. M., Petre, R., et al. 2001, ApJ, 561, 308
- Sanders & Fabian (2016) Sanders, J. S., & Fabian, A. C. 2016, AdaptiveBin: Adaptive Binning, Astrophysics Source Code Library
- Sasaki et al. (2014) Sasaki, M., Heinitz, C., Warth, G., & Pühlhofer, G. 2014, A&A, 563, A9
- Sasaki et al. (2006) Sasaki, M., Kothes, R., Plucinsky, P. P., Gaetz, T. J., & Brunt, C. M. 2006, ApJ, 642, L149
- Sasaki et al. (2013) Sasaki, M., Plucinsky, P. P., Gaetz, T. J., & Bocchino, F. 2013, A&A, 552, A45
- Sasaki et al. (2004) Sasaki, M., Plucinsky, P. P., Gaetz, T. J., et al. 2004, ApJ, 617, 322
- Sato et al. (2014) Sato, T., Koyama, K., Takahashi, T., Odaka, H., & Nakashima, S. 2014, PASJ, 66, 124
- Scheck et al. (2006) Scheck, L., Kifonidis, K., Janka, H.-T., & Müller, E. 2006, A&A, 457, 963
- Seta et al. (2004) Seta, M., Hasegawa, T., Sakamoto, S., et al. 2004, AJ, 127, 1098
- Seta et al. (1998) Seta, M., Hasegawa, T., Dame, T. M., et al. 1998, ApJ, 505, 286
- Seward (1990) Seward, F. D. 1990, ApJS, 73, 781
- Seward et al. (1995) Seward, F. D., Schmidt, B., & Slane, P. 1995, ApJ, 453, 284
- Shelton et al. (1999) Shelton, R. L., Cox, D. P., Maciejewski, W., et al. 1999, ApJ, 524, 192
- Shelton et al. (2004) Shelton, R. L., Kuntz, K. D., & Petre, R. 2004, ApJ, 611, 906
- Slane et al. (2015) Slane, P., Bykov, A., Ellison, D. C., Dubner, G., & Castro, D. 2015, Space Sci. Rev., 188, 187
- Slane et al. (1997) Slane, P., Seward, F. D., Bandiera, R., Torii, K., & Tsunemi, H. 1997, ApJ, 485, 221
- Slane et al. (2004) Slane, P., Zimmerman, E. R., Hughes, J. P., et al. 2004, ApJ, 601, 1045
- Slane et al. (2012) Slane, P., Hughes, J. P., Temim, T., et al. 2012, ApJ, 749, 131
- Smith et al. (2001) Smith, R. K., Brickhouse, N. S., Liedahl, D. A., & Raymond, J. C. 2001, ApJ, 556, L91
- Smith & Hughes (2010) Smith, R. K., & Hughes, J. P. 2010, ApJ, 718, 583
- Snell et al. (2005) Snell, R. L., Hollenbach, D., Howe, J. E., et al. 2005, ApJ, 620, 758
- Spruit & Phinney (1998) Spruit, H., & Phinney, E. S. 1998, Nature, 393, 139
- Sturner & Dermer (1995) Sturner, S. J., & Dermer, C. D. 1995, A&A, 293
- Su et al. (2014) Su, H., Tian, W., Zhu, H., & Xiang, F. Y. 2014, in IAU Symposium, Vol. 296, Supernova Environmental Impacts, ed. A. Ray & R. A. McCray, 372–373
- Su et al. (2011) Su, Y., Chen, Y., Yang, J., et al. 2011, ApJ, 727, 43
- Subrahmanyan & Goss (1995) Subrahmanyan, R., & Goss, W. M. 1995, MNRAS, 275, 755
- Sun et al. (1999) Sun, M., Wang, Z.-R., & Chen, Y. 1999, ApJ, 511, 274
- Swartz et al. (2015) Swartz, D. A., Pavlov, G. G., Clarke, T., et al. 2015, ApJ, 808, 84
- Temim et al. (2013) Temim, T., Slane, P., Castro, D., et al. 2013, ApJ, 768, 61
- Tendulkar et al. (2013) Tendulkar, S. P., Cameron, P. B., & Kulkarni, S. R. 2013, ApJ, 772, 31
- Tenorio-Tagle et al. (1985) Tenorio-Tagle, G., Bodenheimer, P., & Yorke, H. W. 1985, A&A, 145, 70
- Thorstensen et al. (2001) Thorstensen, J. R., Fesen, R. A., & van den Bergh, S. 2001, AJ, 122, 297
- Tian & Leahy (2013) Tian, W. W., & Leahy, D. A. 2013, ApJ, 769, L17
- Tong et al. (2016) Tong, H., Wang, W., Liu, X. W., & Xu, R. X. 2016, ApJ, 833, 265
- Torii et al. (1997) Torii, K., Tsunemi, H., Dotani, T., & Mitsuda, K. 1997, ApJ, 489, L145
- Troja et al. (2008) Troja, E., Bocchino, F., Miceli, M., & Reale, F. 2008, A&A, 485, 777
- Troja et al. (2006) Troja, E., Bocchino, F., & Reale, F. 2006, ApJ, 649, 258
- Tüllmann et al. (2010) Tüllmann, R., Plucinsky, P. P., Gaetz, T. J., et al. 2010, ApJ, 720, 848
- Tuohy et al. (1979) Tuohy, I. R., Cordova, F. A., Garmire, G. P., et al. 1979, ApJ, 230, L27
- Uchida et al. (2013) Uchida, H., Yamaguchi, H., & Koyama, K. 2013, ApJ, 771, 56
- Uchida et al. (2012) Uchida, H., Koyama, K., Yamaguchi, H., et al. 2012, PASJ, 64, 141
- Vasisht et al. (1996) Vasisht, G., Aoki, T., Dotani, T., Kulkarni, S. R., & Nagase, F. 1996, ApJ, 456, L59
- Vasisht et al. (1997) Vasisht, G., Kulkarni, S. R., Anderson, S. B., Hamilton, T. T., & Kawai, N. 1997, ApJ, 476, L43+
- Vazquez & Feinstein (1990) Vazquez, R. A., & Feinstein, A. 1990, A&AS, 86, 209
- Vink (2012) Vink, J. 2012, A&A Rev., 20, 49
- Vink et al. (2004) Vink, J., Bleeker, J., Kaastra, J. S., & Rasmussen, A. 2004, Nuclear Physics B Proceedings Supplements, 132, 62
- Wang & Wheeler (2008) Wang, L., & Wheeler, J. C. 2008, ARA&A, 46, 433
- Wang & Seward (1984) Wang, Z. R., & Seward, F. D. 1984, ApJ, 279, 705
- Weisskopf & Hughes (2006) Weisskopf, M. C., & Hughes, J. P. 2006, Six Years of Chandra Observations of Supernova Remnants, ed. J. W. Mason, 55
- West et al. (2016) West, J. L., Safi-Harb, S., Jaffe, T., et al. 2016, A&A, 587, A148
- White & Long (1991) White, R. L., & Long, K. S. 1991, ApJ, 373, 543
- Wilner et al. (1998) Wilner, D. J., Reynolds, S. P., & Moffett, D. A. 1998, AJ, 115, 247
- Wilson (1986) Wilson, A. S. 1986, ApJ, 302, 718
- Winkler & Petre (2007) Winkler, P. F., & Petre, R. 2007, ApJ, 670, 635
- Winkler et al. (2009) Winkler, P. F., Twelker, K., Reith, C. N., & Long, K. S. 2009, ApJ, 692, 1489
- Winkler et al. (2014) Winkler, P. F., Williams, B. J., Reynolds, S. P., et al. 2014, ApJ, 781, 65
- Wolszczan et al. (1991) Wolszczan, A., Cordes, J. M., & Dewey, R. J. 1991, ApJ, 372, L99
- Wongwathanarat et al. (2013) Wongwathanarat, A., Janka, H.-T., & Müller, E. 2013, A&A, 552, A126
- Yamaguchi et al. (2009) Yamaguchi, H., Ozawa, M., Koyama, K., et al. 2009, ApJ, 705, L6
- Zacharias et al. (2013) Zacharias, N., Finch, C. T., Girard, T. M., et al. 2013, AJ, 145, 44
- Zavlin et al. (2000) Zavlin, V. E., Pavlov, G. G., Sanwal, D., & Trümper, J. 2000, ApJ, 540, L25
- Zavlin et al. (1998) Zavlin, V. E., Pavlov, G. G., & Trumper, J. 1998, A&A, 331, 821