Survival of Massive Star-forming Galaxies in Cluster Cores Drives Gas-Phase Metallicity Gradients : The Effects of Ram Pressure Stripping
Abstract
Recent observations of galaxies in a cluster at show that their integrated gas-phase metallicities increase with decreasing cluster-centric distance. To test if ram pressure stripping (RPS) is the underlying cause, we use a semi-analytic model to quantify the “observational bias” that RPS introduces into the aperture-based metallicity measurements. We take integral field spectroscopy of local galaxies, remove gas from their outer galactic disks via RPS, and then conduct mock slit observations of cluster galaxies at . Our RPS model predicts a typical cluster-scale metallicity gradient of dex/Mpc. By removing gas from the outer galactic disks, RPS introduces a mean metallicity enhancement of dex at a fixed stellar mass. This gas removal and subsequent quenching of star formation preferentially removes low mass cluster galaxies from the observed star-forming population. As only the more massive star-forming galaxies survive to reach the cluster core, RPS produces a cluster-scale stellar mass gradient of /Mpc. This mass segregation drives the predicted cluster-scale metallicity gradient of dex/Mpc. However, the effects of RPS alone can not explain the higher metallicities measured in cluster galaxies at . We hypothesize that additional mechanisms including steep internal metallicity gradients and self-enrichment due to gas strangulation are needed to reproduce our observations at .
Subject headings:
galaxies: clusters: general – galaxies: evolution – galaxies: abundances – galaxies: clusters: intracluster medium – galaxies: interactions1. introduction
Understanding the link between internal properties of galaxies such as stellar mass, gas fraction, chemical abundance and the large-scale environment continues to be a rich area of research. Numerous studies have established that galaxy clusters have significantly larger fractions of elliptical and S0-type galaxies relative to the field galaxy populations (Dressler, 1980; Poggianti et al., 1999; Van der Wel, 2008). Galaxies in local galaxy clusters have lower star-formation rates and are deficient in both the molecular and atomic gas compared to field galaxies (Kauffmann et al., 2004; Balogh et al., 2004; Chung et al., 2009; Hughes & Cortese, 2009; Cortese et al., 2011; Boselli et al., 2014a; Odekon et al., 2016; Brown et al., 2017). The removal of the cold/hot gas reservoir for an infalling galaxy via ram pressure stripping (RPS; Gunn & Gott, 1972) by the hot diffuse intracluster medium (ICM) can explain some of the differences between cluster and field galaxies such as lower gas fraction and lower star formation rates in cluster galaxies (Abramson et al., 2011; Chung et al., 2009; Boselli et al., 2014b).
The gas-phase metallicity of a galaxy is regulated by its star-formation history and galactic gas inflows/outflows. The interactions between the ICM and circum-galactic medium (IGM/CGM) can potentially affect the chemical evolution of cluster galaxies. Previous studies testing for environmental effects on chemical evolution have focused on measuring the stellar mass-metallicity relation (the MZ relation) variation with the local density. Observations of the MZ relation find minimal to negligible evidence of environmental influence (Cooper et al., 2008; Ellison et al., 2009; Scudder et al., 2012; Hughes et al., 2013; Pasquali et al., 2012; Peng & Maiolino, 2014; Darvish et al., 2015; Pilyugin et al., 2017). For example, Ellison et al. (2009) and Pilyugin et al. (2017) find that galaxies in high density environments have an enhanced metallicity of dex compared to field galaxies. However, both Ellison et al. (2009) and Pilyugin et al. (2017) conclude that the metal enhancement depends more strongly on the local environment density than the large-scale environment density at redshift .
In a recent paper (Gupta et al., 2016, hereafter Gupta16), we measure the integrated gas-phase metallicities of cluster galaxies in MACS J1115+01 () and study the correlation of the galaxy’s metallicity with the projected cluster radius. Using this complementary method of testing for environmental effects on chemical evolution, we find that MACS J1115+01 has a negative cluster-scale metallicity gradient of dex/Mpc. In addition, cluster galaxies are on average dex more metal rich relative to field galaxies at a fixed stellar mass. Ellison et al. (2009) also observed that galaxies at small cluster-centric distance ( R200) have a higher median metallicity than galaxies at larger cluster-centric distance ( R200) by dex.
In Gupta16, we propose two scenarios that can potentially explain the observed negative cluster-scale metallicity gradient: disk truncation due to ram pressure stripping and self-enrichment due to strangulation. Self enrichment leads to the physical enhancement in the metallicity of cluster galaxies, whereas disk truncation can introduce an observational bias in the integrated metallicity measured from a fixed aperture/slit.
Truncation of the gas disk by RPS can introduce a purely observationally-driven increase in the integrated gas-metallicities of an individual galaxy. RPS removes the gas reservoir outside the galactic radius where the gravitational restoring force is equal to the pressure gradient exerted on the infalling galaxy by the ICM (Gunn & Gott, 1972). Stripping of gas from the outer-galactic disk instantaneously suppresses the star formation in the outer part of the galaxy. The metallicity measurements via optical strong emission lines are sensitive to star-forming regions of the galaxy. Thus, the integrated emission line flux for a cluster galaxy with truncated galactic disk will be biased towards the central metal-rich part of the galaxy, resulting in an enhanced integrated metallicity measurement. For example, Hughes et al. (2013) used disk truncation to explain the enhanced metallicity of cluster galaxies. They truncate the radial metallicity profile of NGC 4254 from Skillman et al. (1996) to and estimate a metallicity enhancement of 0.1 dex. However, their use of a fixed truncation radius does not consider the scatter in the truncation radius caused by different orbital parameters and physical properties of infalling galaxies. Thus a detailed model of RPS in a cluster environment is required to better understand how disk truncation increases the observed gas-metallicities of cluster members and potentially produces cluster-scale metallicity gradients as measured by Gupta16.
In this paper, we focus on the effect of disk truncation on the integrated metallicity of cluster members. We simulate RPS in a galaxy cluster using the semi-analytic prescription by Luo et al. (2016) and Tecce et al. (2010). We select galaxies from the Calar Alto Legacy Integral Field Area (CALIFA) survey data release 3 (Sánchez et al., 2012) and distribute them uniformly in a galaxy cluster. We manually truncate the 3-dimensional (3D) datacubes of CALIFA galaxies based on the stripping radii calculated from the RPS model. We then conduct mock slit observations of the truncated CALIFA galaxies redshifted to to estimate their integrated metallicity and compare with the cluster member metallicity gradients from Gupta16. This paper is organized as follows. In Section 2, we describe the sample selection, the mock observation technique and the metallicity estimation. Our analytic model for the ram pressure stripping is described in Section 3. In Section 4, we describe the simulation of disk truncated cluster galaxies. In Section 5, we compare our results with observations. In Section 6, we discuss the strengths and weakness of our model. We assume a standard , , , .
2. Simulating Slit Spectroscopy of Cluster Galaxies at
Disk-truncation due to RPS of outer galactic-disk introduces an observational bias in the integrated metallicity measurements via slit spectroscopy. To determine if RPS can generate an increase in the gas-phase metallicity of cluster galaxies with decreasing cluster-centric distance, we first start with integral field unit (IFU) spectroscopy of nearby field galaxies. We can quantify the strength of the observational bias introduced in the integrated metallicity measurements by disk truncation after manually truncating the IFU datacubes using a semi-analytic model of RPS and conducting mock slit observations.
2.1. CALIFA: IFU spectroscopy at
We select our sample from the publicly available integral field data from the third data release (DR3) of the Calar Alto Legacy Integral Field Area (CALIFA) survey (Sánchez et al., 2012). We choose the CALIFA survey because it has better spatial resolution per galaxy compared to other ongoing local IFU surveys because of the narrower redshift range ( pc Sánchez et al., 2016). Specific details of DR3 are presented in Sánchez et al. (2016) and Walcher et al. (2014). CALIFA DR3 contains about 650 galaxies in the redshift range of . The primary CALIFA sample is derived from the Sloan Digital Sky Survey Data Release 7 (SDSS DR7; York et al., 2000; Abazajian et al., 2009). We select CALIFA galaxies with reliable stellar disk scale length provided in the Méndez-Abreu et al. (2017) catalog, restricting our sample to 280 galaxies. Each CALIFA datacube has a spatial field of view of on a rectangular grid of . The average spatial resolution is , corresponding to an average physical resolution of kpc. The CALIFA survey has two resolution modes, low-resolution (V500) and high-resolution (V1200), with a spectral coverages of Å and Å respectively. In this study, we will use the datacubes in the low-resolution mode (V500) that have a full width half maximum (FWHM) spectral resolution of 6 Å because we need a wide spectral coverage to measure the gas-phase metallicity.
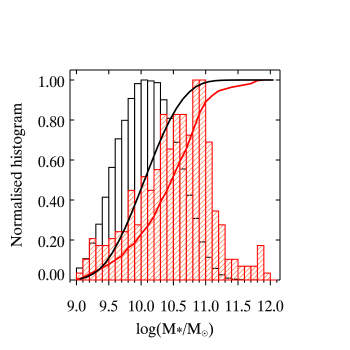
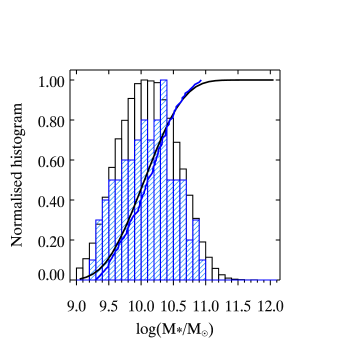
To simulate disk truncation in cluster galaxies, we require a representative sample of field galaxies. The SDSS DR7 survey has million galaxies and typically represents field galaxies. Using the stellar mass estimates by González Delgado et al. (2014) for the CALIFA sample, we find that the CALIFA DR3 sample is biased towards higher stellar mass relative to the full SDSS DR7 data (Figure 1: left panel). Stellar masses of the SDSS DR7 galaxies are taken from the MPA-JHU catalogs (Kauffmann et al., 2003; Brinchmann et al., 2004). We generate the stellar mass function of SDSS DR7 galaxies and populate it with CALIFA DR3 galaxies. Due to the limited number of galaxies with stellar masses below in the CALIFA sample, we only match the stellar mass function at stellar mass . The blue histogram in the right panel of Figure 1 shows the stellar mass distribution of the selected CALIFA galaxies. A two sided Kolmogorov–Smirnov (KS) test yield a probability of 99% for the stellar mass distribution of the SDSS sample and the selected CALIFA sample to be derived from the same parent population. Our final sample consists of galaxies in the mass range of .
2.2. Redshifting CALIFA to
The clusters observed in Gupta16 were at a redshift of , whereas the average redshift of the selected CALIFA sample is . To redshift the CALIFA galaxies to , we use basic cosmology equations of angular size variation and surface brightness dimming. The mean redshift of the selected CALIFA sample is , leading to an average reduction in angular size and total flux by a factor of and respectively.
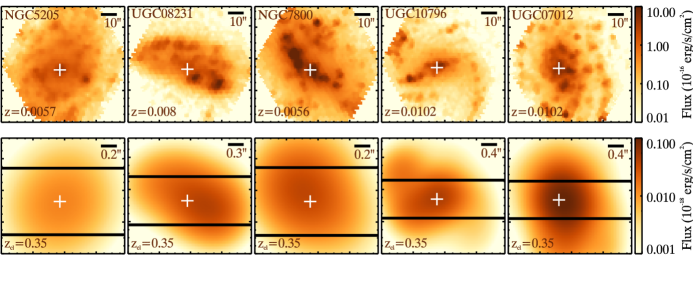
The observations in Gupta16 were conducted with the DEIMOS spectrograph on the Keck-II telescope, which is a multi-slit spectrograph in seeing-limited conditions. To consider the effect of beam smearing in high-redshift observations, we match the spatial resolution of the redshifted datacubes with DEIMOS/Keck observations. The seeing of DEIMOS observations in Gupta16 was , corresponding to a spatial resolution of 3.952 kpc at . The average seeing of CALIFA data is , with a spatial sampling of . We convolve each wavelength slice in redshifted datacubes with the point spread function (PSF) of DEIMOS observations. The top panel in Figure 2 shows the wavelength-collapsed H intensity maps for five randomly selected galaxies from the CALIFA sample and the corresponding H intensity map in the bottom panel after redshifting the datacubes to and convolving with a seeing of .
2.3. Mock slit spectroscopy
We estimate the metallicity of cluster galaxies in Gupta16 using integrated spectra from Keck/DEIMOS observations. To make a realistic comparison with the cluster-scale abundance gradient observed in Gupta16, we conduct mock DEIMOS observations of the selected CALIFA galaxies after redshifting them to . We generate a single slit spectrum for each redshifted IFU datacube by positioning a DEIMOS slit on the galaxy center (Figure 2: bottom panel) and integrating the flux within the slit.
2.4. Emission line fitting and metallicity estimation
We extract emission line fluxes by following the same procedure as described in Gupta16. In summary, we fit multiple Gaussian profiles to the 1D slit spectrum. The initial redshift is taken from the CALIFA catalog. We extract emission line fluxes of the following strong emission lines: H, [O III] , H, [N II] and [S II] . We remove galaxies with signal-to-noise (S/N) for any emission line. The AGN galaxies are removed using the [O III]/H and [N II]/H diagram and the theoretical calibration of Kewley et al. (2001).
The metallicity of the star-forming galaxies is derived using the new diagnostic by Dopita et al. (2016) based on the ratio of [N II]/H and [N II]/[S II]. The metallicity calibration by Dopita et al. (2016) is given by:
| (1) |
Out of the 91 galaxies in the mass-selected CALIFA sample, we can reliably measure the metallicity of 61 galaxies after implementing the S/N cut and removing AGN galaxies.
3. modeling the effect of disk truncation on gas metallicity measurements
RPS leads to many physical changes in properties of galaxies in the cluster environment. The atomic and molecular gas are observed trailing behind infalling cluster galaxies, giving direct evidence of RPS in cluster environments (Abramson et al., 2011; Boselli et al., 2014b; De Grandi et al., 2016). Observations of jellyfish galaxies show extreme stripping events where even the dense star-forming regions are stripped (Owen et al., 2006; Cortese et al., 2007; Owers et al., 2012; McPartland et al., 2016; Monroe et al., 2017). The gas removal by RPS can explain why cluster galaxies are HI deficient compared to field galaxies and why the HI deficiency increases as the galaxy moves closer to the cluster center (Hughes & Cortese, 2009). The HI disk for field galaxies extends beyond the stellar disk (Cormier et al., 2016), whereas the HI disk in cluster galaxies is usually smaller or the same size as the stellar disk (Chung et al., 2009; Boselli et al., 2014b). The gas removal due to RPS in cluster environment has been used to explain the formation of S0-type galaxies in rich galaxy clusters (Sun et al., 2006; Aragón-Salamanca et al., 2006; Bedregal et al., 2011). The RPS leads to reduction in total mass and size of the gaseous disk of satellite galaxies, a phenomenon we refer to as disk truncation.
Disk galaxies in the local universe have a universal negative internal metallicity gradient (Zaritsky et al., 1994; Sánchez et al., 2014; Ho et al., 2015). If the progenitor of a cluster satellite exhibited a negative internal metallicity gradient before falling into the cluster, its integrated metallicity after disk truncation might be modified because of the removal of the low-metallicity outer portions of the disk. This picture is somewhat simplified because it ignores satellite-satellite interactions and residual star formation in the satellites that may lead to the production of more metals. However, in our treatment, we will neglect satellite-satellite interactions and residual star formation and focus on the zeroth order effect of disk truncation. Our goal is to test whether a simple disk-truncation model is sufficient to explain the metallicity gradient for cluster satellites observed in Gupta16.
3.1. Our disk truncation model
Studying disk truncation in cluster satellites in its full complexity is very challenging because the simulation of full physics of multi-phase interstellar medium (ISM) and its hydrodynamical interaction with the ICM requires sophisticated modeling and can only be achieved using expensive, high-resolution numerical simulations (Roediger & Hensler, 2005; Steinhauser et al., 2016; Luo et al., 2016). Hydrodynamical simulations use RPS of cold gas to obtain the star formation rate suppression and color transformation in simulated galaxy clusters (Abadi et al., 1999; Balogh et al., 2000; Roediger & Hensler, 2005; Roediger & Brüggen, 2007; Heß & Springel, 2012; Steinhauser et al., 2016).
Semi-analytic models of galaxy formation usually have a simplistic description of the RPS of the gaseous component in cluster galaxies. Most semi-analytic models follow the prescription by Gunn & Gott (1972) for both the hot and the cold gas to calculate the stripping radius and the mass loss (McCarthy et al., 2008; Tecce et al., 2010; Guo et al., 2011; Luo et al., 2016). Comparisons with hydrodynamical simulations suggest that most semi-analytic models overestimate the strength of RPS, producing a larger fraction of red galaxies in clusters (Guo et al., 2013; Wang et al., 2014; Steinhauser et al., 2016). To test the effect of disk truncation on integrated metallicity observations, we choose a simplified approach that allows us to explicitly parameterize the physics of disk truncation.
We use an analytic model of disk truncation that depends only on the orbital parameters of the satellite galaxy and the local ICM properties. The procedure is summarized as follows:
-
1.
We assume that the mass-selected CALIFA galaxies (for details see § 2.1) are uniformly distributed in the cluster as a first order initial condition for RPS to act upon (further discussed in Section 6.1). We assign the orbital velocity to each galaxy using the radial velocity distribution for MACS J1115+01 from Gupta16 (§ 4).
- 2.
-
3.
We conduct mock DEIMOS observations of the simulated disks and measure the integrated metallicity for each simulated cluster galaxy (§ 2.4). We calculate the cluster-scale metallicity gradient following the same procedure of Gupta16.
-
4.
The above procedure generates one realisation of the disk truncation simulation with a cluster-scale metallicity gradient measurement. We repeat the above process until the mean cluster scale metallicity gradient converges (Figure 9), which requires a minimum of 150 realisations.
Our procedure does not take into account the full dynamics of the disk interaction with the ICM. We will discuss the ramifications of our assumptions in Section 6. Our current approach, albeit simple, provides a useful framework to understand the physical effect of disk truncation on the cluster galaxy metallicity.
3.2. An analytic model for the ram pressure stripping of cold gas
The multi-phase ISM of a galaxy can be divided into a cold and a hot component, primarily composed of the molecular hydrogen and neutral/ionized hydrogen, respectively. Explicit modeling of the stripping of different phases of the ISM requires properly designed numerical studies and is beyond the scope of our model. Both numerical simulations and observations show that the warmer neutral/ionized gas is stripped first (McCarthy et al., 2008; Chung et al., 2009; Boselli et al., 2014b; Steinhauser et al., 2016), but the stripping of the hot gas would not instantaneously affect the star formation rate because of large cooling timescales. The stripping of the cold gas component from the outer disk of a galaxy would quench the star formation almost immediately, resulting in the loss of emission line flux from the stripped part of the galactic disk. Thus, the stripping of the cold gas from the outer parts of the galactic disk will directly affect the average metallicity measurement for the satellite galaxy.
We follow the prescription by Gunn & Gott (1972) to model the RPS of gas in a galaxy falling into the ICM. We assume that the cold gas is fully stripped beyond the galacto-centric radius at which the internal gravitational potential energy density of the satellite galaxy is balanced by the RP. We define as the galactic radius at which the ISM pressure is equal to the RP exerted by the ICM. The RP experienced by a galaxy at a cluster-centric distance of falling into the ICM with an orbital velocity of is
| (2) |
where is the ICM density at . The cold gas is gravitationally bound with the ISM of the galaxy. Thus, the cold gas will be stripped only if the RP exceeds the gravitational restoring force due to the ISM (). We use Equation (3) given by Tecce et al. (2010) to determine the
| (3) |
where is the stellar surface mass density and is the surface mass density of the gas. At , and thus we can equate (2) and (3), for a galaxy at a cluster-centric distance of
| (4) |
To estimate we need to model the stellar and gas surface mass density profile ( & ), and the ICM density profile (). The cold gas disk at radius from the galactic center will be stripped away.
We assume that both the stellar disk and the gas disk follow exponential surface density profiles
| (5) |
and
| (6) |
where and are the scale length of stellar and gas disks, respectively, and and are the corresponding central surface mass density. The total stellar mass of an exponential surface density disk is given by and the total gas mass is . We assume the same scale length for both the stellar and the cold gas disk, i.e., , which is corroborated by the spatially resolved observations of the molecular gas for local field galaxies (Bigiel & Blitz, 2012; Cormier et al., 2016). The ratio of central surface mass density of the gas and the stellar disk is equal to the molecular gas fraction () of the galaxy,
| (7) |
The molecular gas fraction for local field galaxies depends weakly on the stellar mass and has a typical value of (Boselli et al., 2014a). Thus, for a complete model of the gas and stellar surface density profiles, we only require the total stellar mass (obtained from the CALIFA catalogs) and the scale length of stellar disk . We use Méndez-Abreu et al. (2017) catalog to obtain for CALIFA DR3 galaxies.
We evaluate the RP stripping radius () in Equation (4), using the modelled stellar and gas surface density profile (Equation (5) to (7)) as
| (8) |
The modelled stripping radius () depends weakly on the ICM density () and the orbital velocity () of the satellite galaxy. A similar model of RPS has been used in various semi-analytic models of galaxy evolution (De Lucia et al., 2004; Tecce et al., 2010; Guo et al., 2011).
Different models can be used to generate the ICM density profile () of the cluster. We use the Makino et al. (1998) model to generate the ICM density profile of MACS J1115+01. According to Makino et al. (1998), if the dark matter halo of the cluster follows the Navarro, Frenk and White (NFW; Navarro et al., 1997) density profile,
| (9) |
where and are the scale density and scale length; then the ICM density is given by:
| (10) |
where is the central gas density and B is the ratio of the gravitational energy to the kinetic energy. In this formalism, B is given by:
| (11) |
where is the mean particle weight, is the proton mass and is the temperature of the hot ICM gas. The central gas density () is given by,
| (12) |
again taken from Makino et al. (1998), where is the ratio of the gas mass to the total baryonic fraction in the cluster and is the concentration parameter given by the ratio of the virial radius to the scale length. Observationally, ranges from (Gonzalez et al., 2013). We adopt . Thus, we require only four parameters, (scale density of NFW profile), (scale length of NFW profile), (X-ray temperature) and (concentration parameter) to determine the density profile of the hot ICM. To compare with the cluster-scale metallicity gradient observations for MACS J1115+01, we use the cluster parameters for MACS J1115+01 provided by Merten et al. (2015) to model the density profile of ICM (, , keV and ). Thus, the stripping radius in Equation (8) only depends on and . Before constructing a more realistic model of disk truncation in a galaxy cluster, we investigate the effect of the internal metallicity gradient on the cluster-scale metallicity gradient using an idealised approach in next subsection (§ 3.3).
3.3. Internal metallicity gradients vs. cluster-scale gradients
IFU observations of local field galaxies indicate the existence of a universal negative internal metallicity gradient for local disk galaxies (Zaritsky et al., 1994; Sánchez et al., 2014; Ho et al., 2015). The observation of metallicity enhancement via truncation of outer-galactic disk is based on the assumption that all galaxies have a negative internal metallicity gradient. To quantify the effect of an internal metallicity gradient on cluster-scale metallicity gradient, we manually place a galaxy with fixed internal properties (such as stellar mass and internal metallicity gradient) at different cluster-centric distances.
We define as the cluster-scale gradient in the integrated metallicity of star-forming cluster galaxies and as the internal metallicity gradient of a satellite galaxy. We assume that a galaxy with a particular is falling into the cluster with an orbital velocity of km/s. The empirical stellar mass-size relation is used to estimate the stellar disk scale length for this galaxy (Mosleh et al., 2013). We manually place the satellite galaxy at different cluster-centric distance and estimate the stripping radius at each cluster-centric distance using our RPS model (Equation (8)). We estimate the integrated metallicity () at each cluster-centric distance by taking an intensity-weighted average of within using following equation:
| (13) |
where we assume an exponentially declining profile for the intensity (Hughes et al., 2013). We perform a linear fit between and the cluster-centric distance to estimate . To estimate the relation between and , we assume that the internal metallicity gradient of the infalling galaxy varies between (Yuan et al., 2011; Jones et al., 2013; Ho et al., 2015) and measure for each value of the .
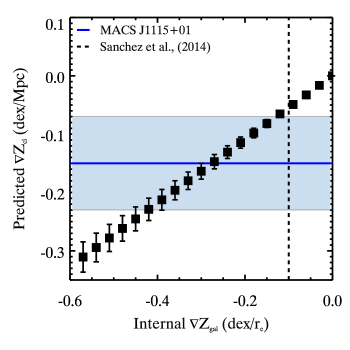
Figure 3 shows that is directly proportional to the of the satellite galaxy, i.e., . Our RPS model predicts a of dex/Mpc, when adopting a , characteristic for CALIFA galaxies (Sánchez et al., 2014). By using the CALIFA sample to simulate cluster galaxies at , we neglect the possible evolution in the internal metallicity gradients of star-forming galaxies out to a redshift of .
The evolution of the internal metallicity gradient of star-forming galaxies with redshift is contentious. Star-forming galaxies at have a universal negative internal metallicity gradient (Sánchez et al., 2014; Ho et al., 2015). The adaptive-optics observations of lensed galaxies show that the internal metallicity gradient steepens with redshift (Yuan et al., 2011; Jones et al., 2013). In contrast, seeing limited observations of non-lensed galaxies find a flat metallicity gradient for high redshift galaxies (Wuyts et al., 2016). Yuan et al. (2013) show that low spatial resolution in seeing limited conditions leads to gradient flattening in the high-redshift observations. If observed for MACS J1115+01 in Gupta16 is caused only by the truncation of outer-galactic disks, then we predict an for MACS J1115+01 cluster members in this idealised model. This internal gradient is significantly steeper than any observations of high-redshift galaxies and is unlikely to be real. Nevertheless, the variation in would introduce scatter in the observed and would be interesting to conduct observations to measure for MACS J1115+01 cluster members.
Using a single galaxy with fixed internal properties disregards the scatter introduced in the predicted due to the scatter in internal properties of infalling galaxies. To realistically simulate disk truncation in MACS J1115+01, we use a stellar mass selected sample of CALIFA galaxies.
4. Simulating disk truncation in a galaxy cluster
We simulate disk truncation in a galaxy cluster by uniformly distributing the mass selected CALIFA galaxies at different cluster-centric radii. The stripping radius for each galaxy is evaluated using Equation (8). To compare with the observations from Gupta16, we model the ICM density profile using Equations (10) to (12), where the cluster parameters were obtained from Merten et al. (2015) for MACS J1115+01. We neglect the central 200 kpc region in the cluster because all galaxies closer than 200 kpc will be completely stripped of the cold gas according to Equation (8). Note that our results do not change significantly by using a minimum cluster-centric radius of 500 kpc as used in Gupta16.
The observations in Gupta16 give us the velocity dispersion along the line-of-sight (km/s) for the cluster members. To assign orbital velocity, we assume that our simulated galaxy cluster is isotropic, i.e., all three components of velocities have the same Gaussian distribution with dispersion equal to . The orbital velocity is given by . Thus, follow a Maxwell-Boltzmann distribution with mean = 1532 km/s and dispersion = 646 km/s. We assign the orbital velocity independent of a galaxy’s position in the cluster.
4.1. Galaxies with truncated galactic disks
We compare the observation from Gupta16 to observed for the mass matched sample from CALIFA DR3. We define T-CALIFA as the sample of cluster galaxies at with truncated galactic disks for which metallicity is estimated via the mock DEIMOS observations. The stripping radius for each T-CALIFA galaxy is estimated using Equation (8) after assigning orbital parameters, i.e., cluster-centric radius and orbital velocity. To simulate the disk truncation, we set the flux at to zero for each wavelength slice, thereby suppressing the emission line flux outside the stripping radius. We emphasize that our disk truncation model removes only the cold gas at . Other components of the galaxy such as stars, dust and the halo are intact (§ 5.3). However, because we are simulating observed emission line fluxes, it is reasonable to cut off data at because no emission line would be detected at . After disk truncation, we redshift the galaxies to (§ 2.2) and conduct mock observations with DEIMOS (§ 2.3). The metallicity is estimated using emission line ratios [N II]/H and [N II]/[S II] (§ 2.4) extracted from the 1D-slit spectrum for each T-CALIFA galaxy.
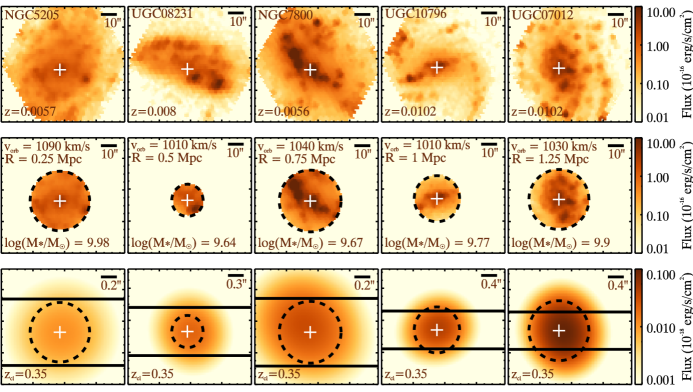
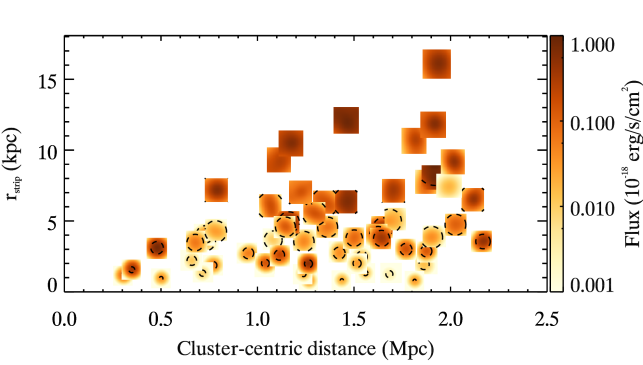
Figure 4 gives a figurative description of our disk truncation simulation for a random sample of 5 galaxies. The truncation radius for each galaxy is calculated after assigning the galaxy an orbital velocity and distance from the cluster center. The middle row in Figure 4 shows the truncated galactic disks after reassigning the flux outside to zero. After truncating the galactic disk, we redshift the galaxies to (§ 2.2) and convolve with the PSF of (Figure 4: bottom panel). We truncate the galactic disk before redshifting to avoid spatial resolution effects in disk truncation. The 1D spectrum of the truncated galaxy is extracted by integrating the flux within a DEIMOS slit (§ 2.3) at each wavelength slice. Figure 5 shows the relation between and cluster-centric distance for the full mass selected CALIFA sample. The mean stripping radius gets smaller as cluster galaxies move closer to the cluster center. The stellar mass of infalling galaxies varies almost 2 orders in magnitude, resulting in a large scatter in the of galaxies at a particular cluster-centric distance.
4.2. Comparison sample
To estimate the metallicity enhancement due to disk truncation, we compare the mass-metallicity relation for the T-CALIFA galaxies with the following control samples:
4.2.1 SDSS7 (Fiber spectroscopy)
To have a direct comparison with the metallicity offset in the mass-metallicity relation observed in Gupta16, we use the SDSS DR7 galaxy sample as one of our control sample. The stellar mass and emission line flux measurements for SDSS DR7 galaxies are taken from the publicly available MPA-JHU catalogs 111 See http://wwwmpa.mpa-garching.mpg.de/SDSS/DR7/Data/stellarmass.html (Kauffmann et al., 2003; Brinchmann et al., 2004). We use the same selection criteria as Gupta16 to ensure a consistent comparison sample. In brief, we remove galaxies with aperture coverage of leading to a redshift selection of and remove AGN galaxies using the Baldwin-Phillips-Terlevich (BPT) diagram (Baldwin et al., 1981; Phillips et al., 1986; Veilleux & Osterbrock, 1987) procedure described in Kewley et al. (2006). We further remove galaxies with signal-to-noise (S/N) ratio for any of the following emission lines: [O II] , H, [O III] , [N II] , H and [S II] .
4.2.2 Non-truncated CALIFA sample
We define NT-CALIFA as the mass selected CALIFA galaxy sample redshifted to for which no disk truncation is performed. We extract the mass-metallicity relation for NT-CALIFA sample to directly compare the effect of disk truncation on metallicity. We use the same stellar mass matched sample of galaxies from the full CALIFA DR3 catalog as used for the T-CALIFA sample, redshift them to , extract 1D slit spectra and measure the global metallicity again using emission line ratios [N II]/H and [N II]/[S II]. The NT-CALIFA sample undergo the exact sample treatment as the T-CALIFA sample except for the disk truncation. The metallicity enhancement observed between T-CALIFA and NT-CALIFA samples can only be attributed to the bias introduced in the metallicity measurement because of disk truncation.
5. Comparison with observations
We extract the integrated metallicity of disk truncated cluster galaxies at (T-CALIFA; § 4.1). To measure the metallicity we use emission line ratios [N II]/[S II] and [N II]/H and apply a S/N cut of 3 for all necessary emission lines. Additionally, we remove galaxies that have an AGN or the star-formation rate is less than (§ 2.4). Méndez-Abreu et al. (2017) provide measurement of for nearly 280 CALIFA DR3 galaxies out of the full CALIFA DR3 sample of 650 galaxies. The stripping radii estimation requires accurate measurement of , further limiting the sample size of galaxies with reliable gas-phase metallicity estimates. To estimate the scatter introduced by the RP model, we perform multiple realisations of the disk truncation simulation, each time redistributing the mass matched CALIFA galaxies in the galaxy cluster and reassigning the orbital velocity based on the Gaussian random distribution. The mean cluster-scale metallicity gradient converges in about 150 realisations of disk truncation simulation, but to avoid underestimation of scatter we repeat our disk truncation simulation for 200 realisations. Out of the 91 galaxies in the mass matched CALIFA sample, we are left with 25-30 galaxies per realisation for which metallicities could be determined.
5.1. Offset in the stellar mass-gas metallicity relation
The metallicity enhancement produced by disk truncation can be quantified by estimating the offset between the mass-metallicity (MZ) relation of the T-CALIFA sample and control samples. We compare the MZ relation for the T-CALIFA sample with two control samples: SDSS7 and NT-CALIFA (§ 4.2). We use the logarithmic form proposed by Zahid et al. (2013) parameterised as
| (14) |
to fit the MZ relation, where is the asymptotic metallicity, is the characteristic mass and represents the power law slope. The control samples are fit keeping all three parameters free. To estimate the metallicity offset between the T-CALIFA and control samples, we fit the T-CALIFA sample as a single parameter model keeping the and fixed to the comparison control sample’s best-fit values. The difference in the asymptotic metallicity () for the T-CALIFA sample and the comparison control sample is equivalent to the metallicity offset between two samples.
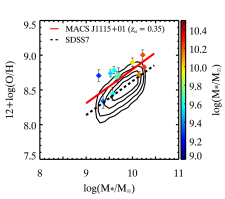
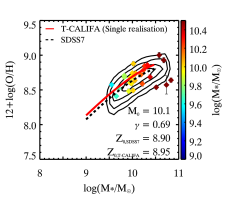
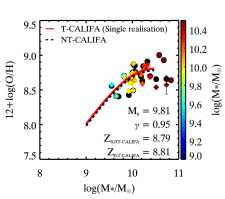
In Gupta16, we observe a dex metallicity enhancement for cluster members in MACS J1115+01 at a fixed stellar mass (Figure 6: left panel). Figure 6 shows one realisation of the MZ relation of the T-CALIFA sample in comparison with the SDSS7 (Figure 6: middle panel) and the NT-CALIFA sample (Figure 6: right panel). The fit parameters for the MZ relation of the T-CALIFA galaxies and the referenced control sample are listed in the legend of Figure 6. For a statistical estimate of the metallicity offset between the T-CALIFA and control samples, we measure the metallicity offset for each realisation of disk truncation simulation.
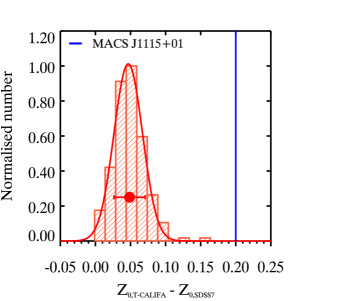
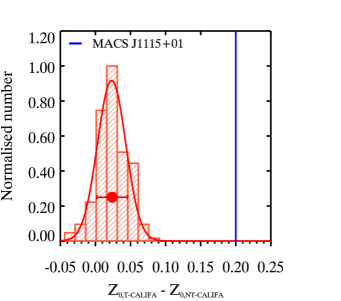
Figure 7 gives the distribution of the metallicity offset between the T-CALIFA and the control samples. Our model predicts a mean metallicity enhancement of dex for the disk truncated CALIFA galaxies with a 1-sigma scatter of 0.02 dex on the MZ relation. Disk truncation produces the slightly higher mean metallicity enhancement between the T-CALIFA and the SDSS7 sample but within the statistical uncertainties. The truncation of outer-galactic disk due to the RPS produces a 0.02 dex enhancement in the integrated metallicity of cluster galaxies at a fixed stellar mass. The mean metallicity enhancement from disk truncation is significantly less than the metallicity enhancement observed for MACS J1115+01 in Gupta16 ( dex).
5.2. Cluster-scale metallicity gradient
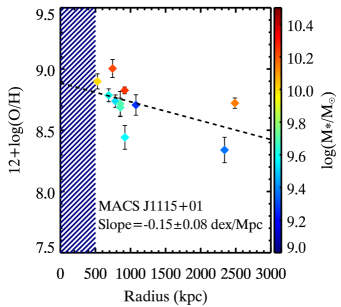
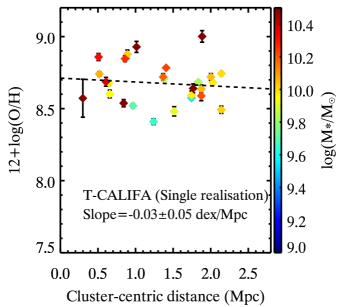
In Gupta16, we observe dex/Mpc in the integrated metallicity of star-forming galaxies for MACS J1115+01 (Figure 8: Left panel). Our disk truncation simulation aims at understanding the contribution of RPS in the observed for MACS J1115+01. We have simulated disk truncation using the IFU datacubes from the CALIFA survey and manually truncate them using a semi-analytic model of RPS. The right panel in Figure 8 shows the distribution of the integrated metallicity of the T-CALIFA sample with the cluster-centric distance for one realisation of the disk truncation simulation. We perform robust linear regression to derive the for each realisation of the disk truncation simulation.
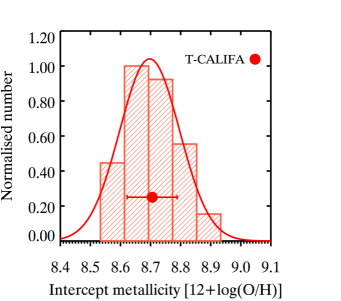
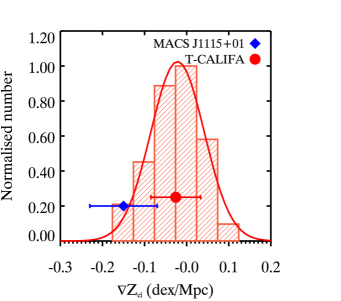
Figure 9 shows the distribution of the intercept metallicity and produced from multiple realisations of the disk truncation simulation (§ 4). Our disk truncation simulations produce a mean of dex/Mpc with a 1-sigma scatter of dex/Mpc in the integrated ISM metallicity of star-forming galaxies. The mean cluster-scale metallicity gradient from the disk truncation simulation is shallower than the observed for MACS J1115+01, although both are consistent with each other within 1-sigma standard deviations. We require measurement of in more galaxy clusters to distinguish the existing distribution from the distribution produced by the truncation of outer-galactic disk. We investigate the origin of the scatter in our simulated cluster-scale metallicity gradient in the following subsection (§ 5.3).
5.3. The scatter in cluster-scale metallicity gradient
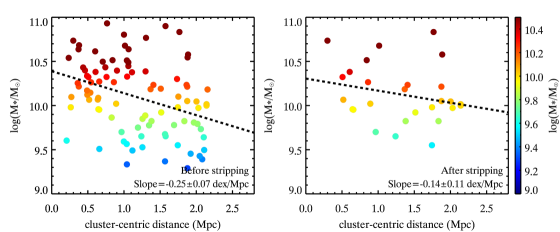
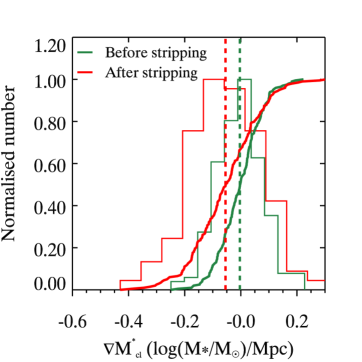
The predicted cluster-scale metallicity gradient from our disk truncation simulation ranges from (Figure 9: right panel). To simulate cluster galaxies, we uniformly distribute the mass selected CALIFA galaxies with respect to the cluster-centric distance (§ 4.1). We define as the best-fit slope between the stellar mass of simulated cluster galaxies and the cluster-centric distance (see the Appendix). Before truncating the galactic disk, we measure a mean /Mpc (Figure 10) because of the uniform distribution of selected CALIFA galaxies with respect to the cluster-centric distance. The redistribution of galaxies in the cluster for each realisation introduces a scatter of /Mpc in the before stripping the galactic disks (Figure 10).
The RPS shifts the distribution towards negative values and increases the scatter. The mean after disk truncation is /Mpc with a 1-sigma scatter of /Mpc (Figure 10). The after truncation is estimated by only including galaxies with measurable metallicities (see the Appendix). The KS-test yields a probability of nearly zero for the distribution before and after truncation to be derived from the same distribution. The negative implies that the star-forming galaxies near the cluster center are more massive than the star-forming galaxies in the cluster outskirts.
Our RPS model does not directly affect the stellar mass of cluster galaxies. The cold gas supply of the low-mass galaxies near the cluster center gets completely stripped of due to RPS. The star formation in fully gas stripped low mass galaxies is suppressed instantaneously resulting in the complete loss of emission line flux. Therefore, we cannot measure the metallicity of the fully gas stripped low mass galaxies near the cluster center via optical emission lines. A disk truncation simulation realisation with an initial of zero can have a negative after truncation because of the selective removal of the low mass galaxies from the cluster core.
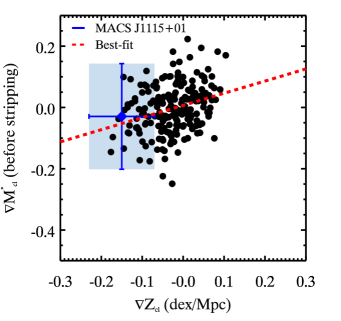
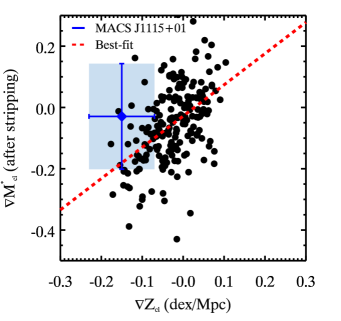
We find that the predicted by our disk truncation simulation has a direct correlation with the measured after performing disk truncation. The shows a weak correlation with the prior to disk truncation (Figure 11: left panel). We find a slope of /dex between the measured before disk truncation and the cluster-scale metallicity gradient. On comparing the with the measured after disk truncation, we find a significantly steeper slope of /dex (Figure 11: right panel). The best-fit slope of /dex between the and the after disk truncation imply that the cluster-scale metallicity gradient in our disk truncation simulation is most sensitive to the introduced by RPS. The negative introduced by the RPS results in a negative because massive galaxies are also metal-rich.
The observed in Gupta16 for MACS J1115+01 is /Mpc. The large measurement error in the for MACS J1115+01 does not rule out that the observed is induced by . Almost 85% of disk truncation realisations lie outside the 1-sigma range of the and the observed for MACS J1115+01 in Gupta16 (Figure 11: right panel). To separate the effect of from the effect of , we select disk truncation realisations with after truncation. We estimate a mean of dex/Mpc with 1-sigma scatter of dex/Mpc for disk truncation realisations with zero after truncation. The stellar mass independent is statistically consistent with the dex/Mpc predicted in Section 3.3 for a cluster galaxy with equivalent to the characteristic of CALIFA galaxies (; Figure 3). The negative cluster-scale metallicity gradient in our disk truncation simulation is caused by the negative gradient in stellar mass induced by the selective removal of low mass galaxies from the cluster core.
6. Discussion
6.1. Assumptions in disk truncation model and theoretical uncertainties
Here, we discuss some of the inherent assumptions in our RP model and their potential effect on the RP strength and thus the metallicity gradient measurements:
-
•
Effect of inclination angle: The basic equation of RP stripping by Gunn & Gott (1972) assumes that galaxies are falling face-on in the cluster, i.e., the infalling galaxies experience maximum RP. Hydrodynamical simulations of RP stripping suggest that the inclination angle does not play a significant role as long as the galaxies are not moving at an almost edge-on geometry (Roediger & Brüggen, 2006; Jáchym et al., 2009; Steinhauser et al., 2016). The total mass loss due to stripping is not affected by the inclination angle but the mass-loss rate is highest for galaxies falling face-on in the cluster (Steinhauser et al., 2016). Hence, we are safe to neglect the role of inclination angle on RP stripping strength.
-
•
Sharp cut-off in radial gas profile: Our model assumes that all the cold gas outside the will be removed instantaneously, causing a sharp cut-off in the radial profile of cold gas. Most semi-analytic models with a sharp cut-off in cold gas profile overproduce the fraction of quenched galaxies in the cluster (Guo et al., 2013), suggesting an overestimation of the RP stripping effect. Recent simulations by Luo et al. (2016) relaxes this assumption by assuming that only a fraction of cold gas is removed outside of the stripping radius. However, the continuous cold gas depletion models also fail to improve the over-estimation of the quenched galaxy fraction. Our model uses a sharp cut-off in the radial cold gas profile, thus our results correspond to maximum RP stripping.
-
•
Galactic orbits in the cluster: The Gunn & Gott (1972) formalism assumes that all galaxies are falling into the cluster in radial orbits and are on their first pass through the cluster. Three-dimensional hydrodynamical simulations suggest that the RPS strength depends on the orbit of the infalling galaxies. McCarthy et al. (2008) show that galaxies with peripheral orbits undergo a single RP stripping event whereas galaxies with radial orbits undergo multiple RP stripping events depending on the number of pericentric passage. However, more than 80% of the total mass-loss occurs on the first passage. Steinhauser et al. (2016) show that galaxies with extreme radial orbits undergo significant RPS, whereas galaxies in peripheral orbits only experience mild stripping of gas mass. Thus, the assumption about the galactic orbit would significantly effect the average RPS experienced by satellite cluster galaxies. Our RP prescription assumes that all satellite galaxies have radial orbits, thus providing a upper bound to RP stripping in clusters.
-
•
Instantaneous gas stripping: The RP model assumes instantaneous stripping of cold gas and that the surface gas profile inside the stripping radius remains unaltered. The metallicity measurements via optical emission lines are sensitive only towards the star-forming regions. The RPS timescales are of the order of Myr, whereas the depletion timescale of cluster galaxies are Gyr. Thus, the star-formation is instantaneously suppressed in the truncated region of the galaxy because . The star-formation inside the stripping radius continues at least till . Relaxing the instantaneous stripping assumption would not significantly affect the RP strength and its effect on integrated metallicity.
-
•
ICM density profile: To describe the ICM density, we use the re-scaled NFW density profile, re-scaled based on the baryonic fraction and the kinetic energy (Makino et al., 1998). Tecce et al. (2010) show that the analytic form for the ICM density overestimates the RP particularly for galaxy cluster at . The analytic form of the ICM density assumes that the galaxy cluster are relaxed dynamical structures that might not be true particularly at high redshift. Our simulated galaxy cluster is at and is a dynamically relaxed system as suggested by the X-ray observations (Allen et al., 2007). The analytic form is expected to provide a good description of the density profile of the cluster. The stripping radius changes logarithmically with the ICM density , i.e., depends weakly on the ICM density. Changing the ICM density profile would not significantly affect the cluster-scale metallicity gradient distribution.
-
•
Stellar and gas disk scale length: To model the surface mass density of the stellar and gaseous component of galaxies, we assume that both the stellar disk and the gaseous disk have the same scale length. Neutral HI gas disks can extend up to twice the stellar disk size (Swaters et al., 2005; Bosma & A., 2016, and references therein), but the cold gas disk closely follows the stellar disk (Bigiel & Blitz, 2012; Cormier et al., 2016). However, the stripping radius in Equation 8 is directly proportional to the scale length of the cold gas disk, therefore uncertainty in the gas disk scale length can significantly affect the stripping radii. We assume same scale length for both gas and stellar disk because otherwise the RPS model would not have an analytic solution.
-
•
Radial distribution of cluster galaxies: To setup our disk truncation simulation, we assume that galaxies are uniformly distributed across the cluster radius. The surface density distribution of both red and blue satellite galaxies follows the NFW profile, albeit with different concentration parameters (Collister & Lahav, 2005; Budzynski et al., 2012; Zenteno et al., 2016). The RPS can modify the radial distribution of star-forming galaxies in the cluster. Ascertaining the radial distribution of star-forming galaxies in clusters without RP is non-trivial both observationally and via simulations. A uniform radial distribution provides a first order initial condition for the RPS to act upon. Choosing a different initial radial density distribution without invoking the stellar mass segregation would not significantly affect the predicted cluster-scale metallicity gradient distribution.
A uniform radial distribution underestimates the average RPS particularly at radii close to the cluster center. Underestimating the average RPS can potentially affect the mean metallicity enhancement of the MZ relation. To assess the effect of the radial distribution on the MZ relation, we weight galaxies according to the radial distance while fitting the MZ relation. Galaxies near the cluster center have higher weights than galaxies in the outskirts. We do not observe a significant change in the mean and 1-sigma scatter of the metallicity enhancement. Thus, the effect of RPS on the gas-phase metallicity is unaffected by the radial distribution of galaxies in the cluster.
-
•
Redshift evolution of internal properties of galaxies: We neglect any redshift evolution in the stellar mass function of field galaxies and by matching the stellar mass function with the SDSS DR7 data at and simply redshifting the CALIFA galaxies to . The shape of the stellar mass function does not change significantly at intermediate redshift but the characteristic galaxy mass is higher in the high redshift clusters than in the local galaxy clusters or field galaxies (Vulcani et al., 2011). An absolute shift in the characteristic stellar mass would not affect the cluster-scale metallicity gradient. Observations of local field galaxies show that all isolated spiral galaxies have the same internal metallicity gradient within (Ho et al., 2015; Sánchez et al., 2016). However, the internal metallicity gradient of spiral galaxies evolves with redshift (Yuan et al., 2013; Jones et al., 2013; Wuyts et al., 2016). In our simulation, we redshift the CALIFA galaxies from an average redshift of to . This assumes no metallicity gradient evolution till redshift of , which might not be true. If the internal metallicity gradient of infalling galaxies steepens with redshift then the cluster-scale metallicity gradient distribution from disk truncation would shift towards more negative values (see § 3.3).
Considering all assumptions incorporated in our disk-truncation model and the results from recent hydrodynamical simulations, the analytic model of RP stripping used in semi-analytic models corresponds to maximum stripping strength (Steinhauser et al., 2016; Natarajan et al., 2017). The cluster-scale metallicity gradient estimated via our disk-truncation model provides an upper-bound to cluster-scale metallicity gradient produced purely by RP stripping.
6.2. Origin of cluster-scale metallicity gradient in the RPS simulation
RPS introduces a mean negative gradient in the stellar mass of galaxies with the cluster-centric distance (Figure 10). RP completely strips off the cold gas supply of the low stellar mass galaxies in the cluster core, i.e., only high stellar mass galaxies continue to form stars in the cluster core. Numerical simulations of RPS also conclude that the gas fraction lost due to stripping is higher for low mass galaxies (Bekki, 2009). The metallicity measurements via optical emission lines are sensitive only to star-forming galaxies. Thus, selective quenching of the low mass galaxies in the cluster core introduces a negative gradient in the stellar mass of star-forming galaxies. The mean negative cluster-scale metallicity gradient in our disk truncation simulation is caused by the negative stellar mass gradient (Figure 11: right panel).
Our simulation predict a nearly flat purely by the stripping of outer galactic disk that is inconsistent with the in observations ( dex/Mpc compared to dex/Mpc). Our maximal RPS model predicts significantly smaller metallicity enhancement of the MZ relation than observations ( dex compared to dex). We suspect that additional physical mechanisms such as self-enrichment via strangulation might be necessary to fully reproduce the observed cluster-scale metallicity gradient and metallicity enhancement of the MZ relation. Observations of more galaxy clusters are required to fully sample the existing cluster-scale metallicity gradient distribution and differentiate from the metallicity gradient distribution produced purely by disk truncation.
7. Conclusion
The truncation of the outer-galactic disk in the cluster environment due to RPS has been used to explain the enhanced metallicity of cluster galaxies compared to counterpart field galaxies (Hughes et al., 2013). In Gupta16, we present the first observation of a cluster-scale gradient in the ISM metallicity of star-forming cluster members. We hypothesize that the self-enrichment of cluster members via strangulation and/or the truncation of outer-galactic disk can produce a negative gradient in the integrated metallicity of cluster members. In this paper, we simulate disk-truncation using an analytic model of RPS. We use a stellar-mass matched sample of CALIFA galaxy (Figure 1) to create a mock sample of disk truncated cluster galaxies. We compare the prediction from our disk truncation simulations with the observations from Gupta16 by conducting mock DEIMOS observations.
Our model of disk truncation results in a mean cluster-scale metallicity gradient of dex/Mpc with a 1-sigma scatter of dex/Mpc (Figure 9: right panel). The cluster-scale metallicity gradient observed for MACS J1115+01 in Gupta16 lies within the cluster-scale metallicity gradient distribution produced by our disk truncation simulation (Figure 9: right panel). We estimate a metallicity enhancement of dex by comparing the MZ relation of the selected CALIFA galaxies before and after disk truncation (Figure 7: right panel). The metallicity enhancement from disk truncation is significantly smaller than the metallicity enhancement observed for MACS J1115+01 ( dex). The random distribution of galaxies in the clusters produces a /Mpc scatter in the stellar mass gradient of cluster members. The scatter in stellar mass distribution is the primary source of scatter in the cluster-scale metallicity gradient estimated in our disk truncation simulation.
RPS induces a negative gradient in the stellar mass of star-forming galaxies (Figure 10). The stellar mass of a galaxy remains unaffected in our RPS model, but RPS leads to complete loss of the gas supply of low mass galaxies in the cluster core. Only massive galaxies continue to form stars in the cluster cores, resulting in a negative gradient in the stellar mass of star-forming cluster galaxies with cluster-centric distance. The cluster-scale metallicity gradient predicted in our disk truncation simulation is most sensitive to the stellar mass gradient induced by the RPS (Figure 11: right panel). The mass segregation induced by the selective removal of low mass galaxies drive the negative cluster-scale metallicity gradient predicted in our simulation.
The stellar mass independent cluster-scale metallicity gradient predicted by our disk truncation simulation is dex/Mpc with a 1-sigma scatter of dex/Mpc, which is significantly smaller than the gradient of dex/Mpc observed in MACS J1115+01. Some of the assumptions in our RPS model such as the sharp cut-off in the radial gas profile and single infall in radial orbits only maximize the strength of RP in galaxy clusters (§ 6.1). Thus, the truncation of outer galactic disk via RPS alone can not explain the cluster-scale metallicity gradient observed in MACS J1115+01.
Observations of cluster-scale metallicity gradients in more galaxy clusters are required to characterise the full range of cluster-scale metallicity gradients existing in galaxy clusters. A flat mean cluster-scale metallicity gradient and the small metallicity enhancement of the MZ relation in our disk truncation simulation suggest that additional physical mechanisms such as strangulation are likely to be required to reproduce the observed cluster-scale metallicity gradient. In the future, we plan to incorporate a simple chemical evolution model with stripped neutral Hydrogen to understand the effect of strangulation on the integrated cluster member metallicities.
Acknowledgements
The author thank the referee for providing useful comments and suggestions to improve the quality of the paper. This study uses data provided by the Calar Alto Legacy Integral Field Area (CALIFA) survey (http://califa.caha.es/). Based on observations collected at the Centro Astronómico Hispano Alemán (CAHA) at Calar Alto, operated jointly by the Max-Planck-Institut fűr Astronomie and the Instituto de Astrofísica de Andalucía (CSIC). A.G. acknowledges I-Ting Ho for help with the CALIFA data and Melanie Kaasinen for her help in the editing of this paper. L.J.K. gratefully acknowledges support from an Australian Research Council (ARC) Laureate Fellowship (FL150100113). K. Tran acknowledges support by the National Science Foundation under Grant #1410728. Davide Martizzi was supported by the Swiss National Science Foundation as an Advanced Postdoc.Mobility Fellow until November 2016; grant number P300P2_161062.
References
- Abadi et al. (1999) Abadi, M. G., Moore, B., & Bower, R. G. 1999, Monthly Notices of the Royal Astronomical Society, 308, 947
- Abazajian et al. (2009) Abazajian, K. N., Adelman-McCarthy, J. K., Agüeros, M. A., et al. 2009, The Astrophysical Journal Supplement Series, 182, 543
- Abramson et al. (2011) Abramson, A., Kenney, J. D. P., Crowl, H. H., et al. 2011, The Astronomical Journal, 141, 164
- Allen et al. (2007) Allen, S. W., Rapetti, D. A., Schmidt, R. W., et al. 2007, Monthly Notices of the Royal Astronomical Society, 383, 879
- Aragón-Salamanca et al. (2006) Aragón-Salamanca, A., Bedregal, A. G., & Merrifield, M. R. 2006, Astronomy and Astrophysics, 458, 101
- Baldwin et al. (1981) Baldwin, a., Phillips, M. M., & Terlevich, R. 1981, Publications of the Astronomical Society of the Pacific, 93, 817
- Balogh et al. (2004) Balogh, M., Eke, V., Miller, C., et al. 2004, Monthly Notices of the Royal Astronomical Society, 348, 1355
- Balogh et al. (2000) Balogh, M. L., Navarro, J. F., & Morris, S. L. 2000, The Astrophysical Journal, 540, 113
- Bedregal et al. (2011) Bedregal, A. G., Cardiel, N., Aragón-Salamanca, A., & Merrifield, M. R. 2011, Monthly Notices of the Royal Astronomical Society, 415, 2063
- Bekki (2009) Bekki, K. 2009, Monthly Notices of the Royal Astronomical Society, 399, 2221
- Bigiel & Blitz (2012) Bigiel, F., & Blitz, L. 2012, The Astrophysical Journal, 756, 183
- Boselli et al. (2014a) Boselli, A., Cortese, L., & Boquien, M. 2014a, Astronomy & Astrophysics, 564, A65
- Boselli et al. (2014b) —. 2014b, Astronomy & Astrophysics, 564, A65
- Bosma & A. (2016) Bosma, A., & A. 2016, eprint arXiv:1612.05272, 1
- Brinchmann et al. (2004) Brinchmann, J., Charlot, S., White, S. D. M., et al. 2004, Monthly Notices of the Royal Astronomical Society, 351, 1151
- Brown et al. (2017) Brown, T., Catinella, B., Cortese, L., et al. 2017, Monthly Notices of the Royal Astronomical Society, 466, 1275
- Budzynski et al. (2012) Budzynski, J. M., Koposov, S. E., McCarthy, I. G., McGee, S. L., & Belokurov, V. 2012, Monthly Notices of the Royal Astronomical Society, 423, 104
- Chung et al. (2009) Chung, A., van Gorkom, J. H., Kenney, J. D. P., Crowl, H., & Vollmer, B. 2009, The Astronomical Journal, 138, 1741
- Collister & Lahav (2005) Collister, A. A., & Lahav, O. 2005, Monthly Notices of the Royal Astronomical Society, 361, 415
- Cooper et al. (2008) Cooper, M. C., Tremonti, C. A., Newman, J. A., & Zabludoff, A. I. 2008, Monthly Notices of the Royal Astronomical Society, 390, 245
- Cormier et al. (2016) Cormier, D., Bigiel, F., Wang, J., et al. 2016, Monthly Notices of the Royal Astronomical Society, 463, 1724
- Cortese et al. (2011) Cortese, L., Catinella, B., Boissier, S., Boselli, A., & Heinis, S. 2011, Monthly Notices of the Royal Astronomical Society, 415, 1797
- Cortese et al. (2007) Cortese, L., Marcillac, D., Richard, J., et al. 2007, Monthly Notices of the Royal Astronomical Society, 376, 157
- Darvish et al. (2015) Darvish, B., Mobasher, B., Sobral, D., et al. 2015, The Astrophysical Journal, 814, 84
- De Grandi et al. (2016) De Grandi, S., Eckert, D., Molendi, S., et al. 2016, arXiv, 2142, 1
- De Lucia et al. (2004) De Lucia, G., Kauffmann, G., & White, S. D. M. 2004, Monthly Notices of the Royal Astronomical Society, 349, 1101
- Dopita et al. (2016) Dopita, M. A., Kewley, L. J., Sutherland, R. S., & Nicholls, D. C. 2016, Astrophysics and Space Science, 311, 177
- Dressler (1980) Dressler, A. 1980, The Astrophysical Journal, 236, 351
- Ellison et al. (2009) Ellison, S. L., Simard, L., Cowan, N. B., et al. 2009, Monthly Notices of the Royal Astronomical Society, 396, 1257
- Gonzalez et al. (2013) Gonzalez, A. H., Sivanandam, S., Zabludoff, A. I., & Zaritsky, D. 2013, The Astrophysical Journal, 778, 14
- González Delgado et al. (2014) González Delgado, R. M., Cid Fernandes, R., García-Benito, R., et al. 2014, The Astrophysical Journal, 791, L16
- Gunn & Gott (1972) Gunn, J. E., & Gott, J. R. I. 1972, The Astrophysical Journal, 176, 1
- Guo et al. (2013) Guo, Q., Cole, S., Eke, V., Frenk, C., & Helly, J. 2013, Monthly Notices of the Royal Astronomical Society, 434, 1838
- Guo et al. (2011) Guo, Q., White, S., Boylan-Kolchin, M., et al. 2011, Monthly Notices of the Royal Astronomical Society, 413, 101
- Gupta et al. (2016) Gupta, A., Yuan, T., Tran, K.-V. H., et al. 2016, The Astrophysical Journal, 831, 104
- Heß & Springel (2012) Heß, S., & Springel, V. 2012, Monthly Notices of the Royal Astronomical Society, 426, 3112
- Hinshaw et al. (2013) Hinshaw, G., Larson, D., Komatsu, E., et al. 2013, The Astrophysical Journal Supplement Series, 208, 19
- Ho et al. (2015) Ho, I.-T., Kudritzki, R.-P., Kewley, L. J., et al. 2015, Monthly Notices of the Royal Astronomical Society, 448, 2030
- Hughes & Cortese (2009) Hughes, T. M., & Cortese, L. 2009, Monthly Notices of the Royal Astronomical Society: Letters, 396, 41
- Hughes et al. (2013) Hughes, T. M., Cortese, L., Boselli, A., Gavazzi, G., & Davies, J. I. 2013, Astronomy & Astrophysics, 550, A115
- Jáchym et al. (2009) Jáchym, P., Köppen, J., Palouš, J., & Combes, F. 2009, Astronomy and Astrophysics, 500, 693
- Jones et al. (2013) Jones, T., Ellis, R. S., Richard, J., & Jullo, E. 2013, The Astrophysical Journal, 765, 48
- Kauffmann et al. (2004) Kauffmann, G., White, S. D. M., Heckman, T. M., et al. 2004, Monthly Notices of the Royal Astronomical Society, 353, 713
- Kauffmann et al. (2003) Kauffmann, G., Heckman, T. M., White, S. D. M., et al. 2003, Monthly Notices of the Royal Astronomical Society, 341, 54
- Kewley et al. (2001) Kewley, L. J., Dopita, M. a., Sutherland, R. S., Heisler, C. a., & Trevena, J. 2001, The Astrophysical Journal, 556, 121
- Kewley et al. (2006) Kewley, L. J., Groves, B., Kauffmann, G., & Heckman, T. 2006, Monthly Notices of the Royal Astronomical Society, 372, 961
- Luo et al. (2016) Luo, Y., Kang, X., Kauffmann, G., & Fu, J. 2016, Monthly Notices of the Royal Astronomical Society, 458, 366
- Makino et al. (1998) Makino, N., Sasaki, S., & Suto, Y. 1998, The Astrophysical Journal, 497, 555
- McCarthy et al. (2008) McCarthy, I. G., Frenk, C. S., Font, A. S., et al. 2008, Monthly Notices of the Royal Astronomical Society, 383, 593
- McPartland et al. (2016) McPartland, C., Ebeling, H., Roediger, E., & Blumenthal, K. 2016, Monthly Notices of the Royal Astronomical Society, 455, 2994
- Méndez-Abreu et al. (2017) Méndez-Abreu, J., Ruiz-Lara, T., Sánchez-Menguiano, L., et al. 2017, Astronomy & Astrophysics, 598, A32
- Merten et al. (2015) Merten, J., Meneghetti, M., Postman, M., et al. 2015, The Astrophysical Journal, 806, 4
- Monroe et al. (2017) Monroe, J. T., Tran, K.-V. H., & Gonzalez, A. H. 2017, The Astrophysical Journal, 836, 1
- Mosleh et al. (2013) Mosleh, M., Williams, R. J., & Franx, M. 2013, The Astrophysical Journal, 777, 117
- Natarajan et al. (2017) Natarajan, P., Chadayammuri, U., Jauzac, M., et al. 2017, arXiv:1702.04348
- Navarro et al. (1997) Navarro, J. F., Frenk, C. S., & White, S. D. M. 1997, The Astrophysical Journal, 490, 493
- Odekon et al. (2016) Odekon, M. C., Koopmann, R. A., Haynes, M. P., et al. 2016, The Astrophysical Journal, 824, 17
- Owen et al. (2006) Owen, F. N., Keel, W. C., Wang, Q. D., Ledlow, M. J., & Morrison, G. E. 2006, The Astronomical Journal, 131, 1974
- Owers et al. (2012) Owers, M. S., Couch, W. J., Nulsen, P. E. J., & Randall, S. W. 2012, The Astrophysical Journal, 750, L23
- Pasquali et al. (2012) Pasquali, A., Gallazzi, A., & van den Bosch, F. C. 2012, Monthly Notices of the Royal Astronomical Society, 425, 273
- Peng & Maiolino (2014) Peng, Y.-j., & Maiolino, R. 2014, Monthly Notices of the Royal Astronomical Society, 438, 262
- Phillips et al. (1986) Phillips, M. M., Jenkins, C. R., Dopita, M. A., Sadler, E. M., & Binette, L. 1986, The Astronomical Journal, 91, 1062
- Pilyugin et al. (2017) Pilyugin, L. S., Grebel, E. K., Zinchenko, I. A., Nefedyev, Y. A., & Mattsson, L. 2017, Monthly Notices of the Royal Astronomical Society, 465, 1358
- Poggianti et al. (1999) Poggianti, B., Smail, I., Dressler, A., et al. 1999, ApJ, 518, 576
- Roediger & Brüggen (2006) Roediger, E., & Brüggen, M. 2006, Monthly Notices of the Royal Astronomical Society, 369, 567
- Roediger & Brüggen (2007) —. 2007, Monthly Notices of the Royal Astronomical Society, 380, 1399
- Roediger & Hensler (2005) Roediger, E., & Hensler, G. 2005, Astronomy and Astrophysics, 433, 875
- Sánchez et al. (2012) Sánchez, S. F., Kennicutt, R. C., Gil de Paz, A., et al. 2012, Astronomy & Astrophysics, 538, A8
- Sánchez et al. (2014) Sánchez, S. F., Rosales-Ortega, F. F., Iglesias-Páramo, J., et al. 2014, Astronomy & Astrophysics, 563, A49
- Sánchez et al. (2016) Sánchez, S. F., García-Benito, R., Zibetti, S., et al. 2016, Astronomy & Astrophysics, 594, A36
- Scudder et al. (2012) Scudder, J. M., Ellison, S. L., & Mendel, J. T. 2012, Monthly Notices of the Royal Astronomical Society, 423, 2690
- Skillman et al. (1996) Skillman, E. D., Kennicutt, R. C., Shields, G. A., & Zaritsky, D. 1996, ApJ, 462, 147
- Steinhauser et al. (2016) Steinhauser, D., Schindler, S., & Springel, V. 2016, Astronomy & Astrophysics, 591, A51
- Sun et al. (2006) Sun, M., Jones, C., Forman, W., et al. 2006, The Astrophysical Journal Letters, 637, L81
- Swaters et al. (2005) Swaters, R. a., van Albada, T. S., van der Hulst, J. M., & Sancisi, R. 2005, Astronomy & Astrophysics, 390, 829
- Tecce et al. (2010) Tecce, T. E., Cora, S. A., Tissera, P. B., Abadi, M. G., & Lagos, C. d. P. 2010, Monthly Notices of the Royal Astronomical Society, 408, 2008
- Van der Wel (2008) Van der Wel, A. 2008, The Astrophysical Journal, 675, L13
- Veilleux & Osterbrock (1987) Veilleux, S., & Osterbrock, D. E. 1987, The Astrophysical Journal Supplement Series, 63, 295
- Vulcani et al. (2011) Vulcani, B., Poggianti, B. M., Aragón-Salamanca, A., et al. 2011, Monthly Notices of the Royal Astronomical Society, 412, 246
- Walcher et al. (2014) Walcher, C. J., Wisotzki, L., Bekeraité, S., et al. 2014, Astronomy & Astrophysics, 569, A1
- Wang et al. (2014) Wang, J., Fu, J., Aumer, M., et al. 2014, Monthly Notices of the Royal Astronomical Society, 441, 2159
- Wuyts et al. (2016) Wuyts, E., Wisnioski, E., Fossati, M., et al. 2016, The Astrophysical Journal, 827, 74
- York et al. (2000) York, D. G., Adelman, J., Anderson, J. E., et al. 2000, The Astronomical Journal, 120, 1579
- Yuan et al. (2013) Yuan, T.-T., Kewley, L. J., & Rich, J. 2013, The Astrophysical Journal, 767, 106
- Yuan et al. (2011) Yuan, T.-T., Kewley, L. J., Swinbank, a. M., Richard, J., & Livermore, R. C. 2011, The Astrophysical Journal, 732, L14
- Zahid et al. (2013) Zahid, H. J., Geller, M. J., Kewley, L. J., et al. 2013, The Astrophysical Journal, 771, L19
- Zaritsky et al. (1994) Zaritsky, D., Kennicutt, Robert C., J., & Huchra, J. P. 1994, The Astrophysical Journal, 420, 87
- Zenteno et al. (2016) Zenteno, A., Mohr, J. J., Desai, S., et al. 2016, Monthly Notices of the Royal Astronomical Society, 462, 830
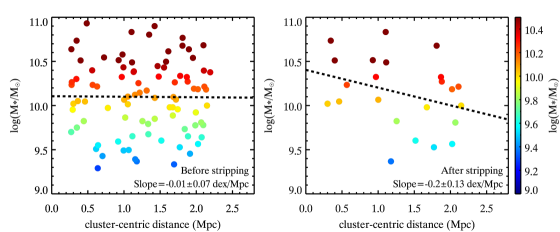
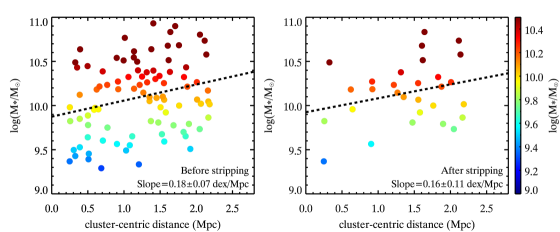
In section 5.3, we compare the stellar mass gradient in our disk truncation simulation with the predicted cluster-scale gradient in integrated metallicity. The is the best-fit slope between the stellar mass of galaxies and the cluster-centric distance for a single realisation of disk truncation simulation. For each realisation of disk truncation simulation, we measure a before and after applying the RPS model. The after stripping is measured by only including galaxies for which gas-phase metallicity can be estimated. Figure 12 shows the stellar mass distribution for three realisations of the disk truncation simulation before and after stripping. For realisations with an initial equal to either positive or negative, the after truncation remains statistically unchanged (Figure 12: top & bottom rows). Whereas, the disk truncation realisation with a zero before stripping can have a after stripping (Figure 12: middle row).