CO excitation in the Seyfert galaxy NGC7130
Abstract
We present a coherent multi-band modelling of the CO Spectral Energy Distribution of the local Seyfert Galaxy NGC7130 to assess the impact of the AGN activity on the molecular gas. We take advantage of all the available data from X-ray to the sub-mm, including ALMA data. The high-resolution () ALMA CO(6-5) data constrain the spatial extension of the CO emission down to 70 pc scale. From the analysis of the archival Chandra and NuSTAR data, we infer the presence of a buried, Compton-thick AGN of moderate luminosity, erg s-1. We explore photodissociation and X-ray-dominated regions (PDRs and XDRs) models to reproduce the CO emission. We find that PDRs can reproduce the CO lines up to J6, however, the higher rotational ladder requires the presence of a separate source of excitation. We consider X-ray heating by the AGN as a source of excitation, and find that it can reproduce the observed CO Spectral Energy Distribution. By adopting a composite PDR+XDR model, we derive molecular cloud properties. Our study clearly indicates the capabilities offered by current-generation of instruments to shed light on the properties of nearby galaxies adopting state-of-the art physical modelling.
keywords:
galaxies: active – galaxies: ISM – ISM: photodissociation region (PDR)1 Introduction
In the far-IR and sub-mm range there are several molecular and atomic lines that probe the different phases of the interstellar medium (ISM) and whose study gives important constraints on its physical condition. In particular, the carbon monoxide (CO) molecule is a good tracer of the molecular gas phase being the second most abundant molecule after the molecular hydrogen (H2).
The CO spectral line energy distribution (i.e. CO SLED) is sensitive to the molecular gas kinetic temperature and can provide constraints on the dominant heating mechanism, controlled by radiative heating from stars and Active Galactic Nuclei (AGN) (e.g. Obreschkow et al. 2009). While the CO SLED line fluxes usually rise up to the CO(5-4) transition and then decrease for typical region around newly formed stars (‘Photon Dissociated Region’, PDR), the high rotational transition levels, if excited, trace the presence of warm gas (<<) heated by X-ray photons (‘X-ray Dominated Regions’, XDRs, e.g. van der Werf et al. 2010) or by shocks (e.g. Panuzzo et al. 2010, Meijerink et al. 2013). This has been shown firstly with observations from ground–based telescopes, mainly for high- galaxies and AGN, taking advantage of the possibility to probe the rest-frame mid/high-J transitions (>500-600 GHz) with sub-mm/mm facilities such as the IRAM and CARMA interferometers (i.e. Solomon & Vanden Bout 2005). Subsequently the Herschel satellite has extended the CO detections to high transitions levels also in the local Universe, using both the PACS and SPIRE/FTS spectrometers (Pereira-Santaella et al. 2013 and Rosenberg et al. 2015). With the advent of the sub-mm/mm ALMA telescope, a further step has been done in this field, thanks to its high instantaneous sensitivity and spatial resolution. In the local Universe, regions of the order of 50-100 pc can be easily resolved supplying crucial information on the modelling.
NGC7130 is a local (=0.0161) Luminous Infrared Galaxy ( , see Gruppioni et al. 2016) with an “ambiguous” nature. On the one hand, it was optically morphologically classified as a peculiar Sa spiral galaxy (Lu 1998) and a Seyfert 1.9 source from the optical emission line ratio (Véron-Cetty & Véron 2006). Recently Gruppioni et al. (2016) from a SED-decomposition analysis found that the data were well reproduced without the need of an AGN torus component. On the other hand, the presence of a buried or low-luminosity AGN is suggested by the fine structure IR lines and X-ray data. In the mid-IR, Tommasin et al. (2010) detected [NeV] lines at 14.32m and 24.31m which, due to their high ionization potential of 97 eV, can be reasonably excited only by an AGN. In the far-IR, Spinoglio et al. (2015) found a low [OIII]88m/[OIV]26m ratio (1), similar to other Seyfert rather than to starbust galaxies. In the X-ray band, Levenson et al. (2005), analyzing Chandra data, claimed the presence of a buried Compton-thick AGN (> cm-2) with observed low luminosity ( erg s-1), dominating at energies >2 keV. From the K iron emission line, the same authors estimated an intrinsic 2–10 keV luminosity of erg s-1. Indications of extreme obscuration towards this source came also from Risaliti et al. (1999) on the basis of the 2–10 keV/[OIII] flux ratio. Summarizing, NGC7130 seems a prototype of a strong starburst probably hosting a Compton-thick AGN.
The goal of this letter is to definitively assess the impact of the AGN activity on the molecular gas in NGC7130. This will be achieved via the modelling of the NGC7130 CO SLED. A coherent multi-phase (and multi-band) analysis of NGC7130 build upon literature data and new X-ray observations will be presented. The paper is structured as follows: in Sec. 2 we provide details on the new Chandra and NuSTAR data, and we highlight the importance of the high-resolution ALMA archival observations in devising a precise CO SLED model. In Sec. 3 we present the model assumptions and the results. Finally, in Sec. 4 we draw a short summary.
2 Data
2.1 Chandra and NuSTAR data
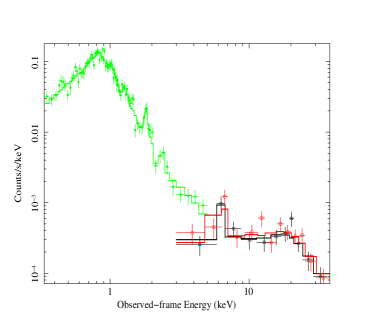
NGC7130 was observed by Chandra in Cycle 2 with the ACIS-S3 CCD at the aimpoint (on Oct. 23rd, 2001), for an exposure time of 38.6 ks. The source shows a point-like emission surrounded by diffuse emission, as estensively described by Levenson et al. (2005). We extracted the Chandra spectrum using a circular region of 15″ radius (to include the nuclear and the diffuse emission and have enough photon statistics for a proper spectral modelling), and the background from a circular region (radius of 22″) with no sign of diffuse emission. The spectrum, of about 3600 net counts, was rebinned to have at least 25 counts per bin to apply statistics within the xspec package (Arnaud, 1996).
NuSTAR observed NGC7130 on Aug. 17th, 2014, for an exposure time of 21.2 ks. Data were reprocessed and screened using standard settings and the nupipeline task, and source and background spectra (plus the corresponding response matrices) were extracted using nuproducts. Given the relatively low flux of the source, a circular extraction region of 30″ radius was selected, while background was extracted from two nearby circular regions of 40″ radius. The source net counts, 190 and 220 in the FPMA and FPMB cameras, respectively, were rebinned to 20 counts per bin. The source signal is detected up to 30 keV.
Chandra and NuSTAR data were fitted simultaneously with the same modelling, which accounts for the dominant thermal emission in the soft X-rays (Chandra band) and for the nuclear emission at hard X-ray energies (NuSTAR range). In particular, data below a few keV are modeled with two thermal components (mekal model within xspec), similarly to Levenson et al. (2005). The derived plasma temperatures are keV and keV. Four additional lines, likely related to iron and SiXIII transitions, seem to be required (at a statistical level of at least 90%). The Chandra data appear very noisy above 5 keV and were therefore removed; however, in this energy range NuSTAR data, albeit characterized by a lower spectral resolution (400 eV vs. 130 eV typically provided by Chandra at 6 keV), are fundamental to characterize the iron K emission line, define the intrinsic continuum of NGC7130 and place constraints on the level of obscuration. To achieve these goals, we used the MYTorus model (Murphy & Yaqoob, 2009), which is based on Monte Carlo simulations and, assuming a toroidal geometry for the reprocessor (uniform and cold), self-consistently includes reflection and scattering. While the photon index was fixed to 1.9, as typically observed in AGN and quasars, the column density of the torus and the inclination angle between the observer’s line-of-sight and the symmetry axis of the torus are left as free parameters of the fit. We obtain an equatorial column density of ( cm-2 and degrees. This overall modelling provides a /dof (degrees of freedom) of 99.1/85; most of the deviations from the best-fit model appear in the soft band and are of limited relevance for the purposes of the present X-ray analysis. The intrinsic 2–10 keV and 1–100 keV luminosities of the AGN are erg s-1 and erg s-1, respectively.
Our results are in good agreement with the analysis of the hard-X ray data (NuSTAR and Swift/BAT) from Koss et al. (2016), where NGC7130 was defined as a moderate CT-AGN, and with the recent work of Ricci et al. (2017), that, performing an analysis similar to ours, confirms the presence of CT obscuration.
2.2 CO data
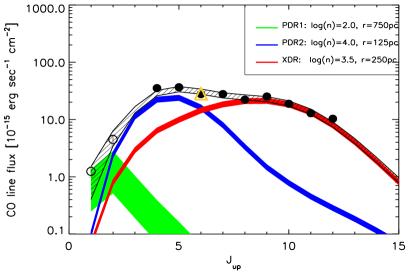
The observed CO SLED is shown in Fig. 2. The mid/high-J levels (>4) are from Herschel SPIRE/FTS observations (Pereira-Santaella et al. 2013), while the low-J transitions are from Albrecht et al. (2007) using the Swedish ESO Submillimeter Telescope (SEST). The Herschel observations are performed to cover a field of view (FOV) of . The observations performed with the single dish SEST Telescope are pointed observations with a FOV (FWHM) of . NGC7130 appears point-like (Pereira-Santaella et al. 2013) in the Herschel SPIRE photometric bands (from 250 to 500 m) characterized by a maximun FWHM of 40′′. Assuming that the dust (sampled by the SPIRE photometric observations) and the gas (sampled by SPIRE/FTS observations) are almost co-spatial, this means that all the CO fluxes correspond to the integrated emission of the galaxy.
The yellow triangle represent the new ALMA CO(6-5) data from Zhao et al. (2016). For details on the analysis of the ALMA data we refer to Zhao et al. (2016); here we only remind the points which are relevant for our analysis. The ALMA observations have been performed in Cycle 2 (project 2013.1.00524.S, PI: Nanyao Lu) with the Band 9 receiver searching for the CO(6-5) transition at 691.473 GHz. The configuration user (C34-5) allowed a synthesized beam FWHM of corresponding to physical scales of pc. The total line flux is 123074 Jy km s-1 and half of this flux in contained in a nuclear region of diameter pc, while the rest in structures at distances of pc from the center. The ALMA flux is completly consistent with the Herschel measurement (see also Lu et al. 2017, arXiv1703.00005). This suggests that the ALMA observation has collected all the CO(6-5) flux, despite the largest angular scales recovered by the ALMA configuration is only , corresponding to 1 kpc.
3 ISM modelling
We model the CO SLED using the version c13.03 of the photoionization/photodissociation code CLOUDY (Ferland et al. 2013) in order to infer the conditions of the molecular gas where the different CO transition lines are excited. In this work, we run two sets of CLOUDY models that assume the molecular clouds to be a 1-D gas slab with constant density located at a fixed distance from the source of the illuminating radiation (e.g. Vallini et al. 2017). We adopt different prescriptions for the spectral energy distribution (SED) of the impinging radiation field. The first set of runs (PDR models, hereafter) assumes a pure stellar SED illuminating the gas slab. The SED is obtained with the stellar population synthesis code Starburst99 (Leitherer et al. 1999), assuming a Salpeter (Salpeter 1955) Initial Mass Function (IMF) in the range 1-100 , and Lejeune-Schmutz stellar atmospheres (Schmutz et al. 1992; Lejeune et al. 1997). We adopt , and a continuous star formation normalized to reproduce the NGC7130 of SFR21 M⊙yr-1 (Gruppioni et al. 2016). The second set of runs (XDR models, hereafter) follows the same approach proposed by Abel & Satyapal (2008) for modeling the AGN radiation impinging a gas slab. More precisely, to account for the radiation field from the AGN, we adopt the table AGN command in CLOUDY (Korista et al. 1997). This command simulates an UV bump () plus an X-ray power-law (). For the value of , we use the value proposed by Korista et al. (1997) and adopted in Abel & Satyapal (2008). The ratio of the UV and X-ray continua () is fixed to , a typical value for an AGN (Zamorani et al. 1981). We normalize the spectrum to match the observed erg s-1 (see Sec.2.1).
For the PDR models, we run a total of 35 CLOUDY simulations leaving (i) the gas density , and (ii) the distance between the radiation source and the cloud free to vary in the range and pc, respectively. Note that a variation in translates into different values for the impinging far-ultraviolet flux (FUV , for the PDR models), and X-ray 1-100 keV flux (, for XDR models) at the cloud surface. The incident FUV flux (X-ray flux) is a key parameter influencing the heating and cooling processes in the photodissociation (X-ray dominated) regions (e.g. Hollenbach & Tielens 1999, Meijerink et al. 2007). The former is usually normalized to the solar neighborhood value (, Habing 1968) and is indicated with . The chosen density range allows to sample the typical densities observed in giant molecular clouds (GMCs, e.g. McKee & Ostriker (2007), and references therein). To constrain the parameter , we take advantage of the key information provided by the ALMA observations. As a matter of fact, can range from the minimum spatial scale recovered by ALMA (70 pc, see 2.2) to the maximum extension of the ALMA CO(6-5) detection (radius 250 pc; see Sec. 2.2). We simulate also two distances larger than the CO(6-5) emission (=[500,750] pc). Indeed, the constraint relative to the extension of the CO emission (concerning the CO(6-5), and likely also the higher and denser J-transitions) is not applicable to the lower and more diffuse transitions, given the spatial resolution of the Herschel and SEST observations (see Sec. 2.2). For the XDR models we keep the same range for adopted for the PDR models (up to = pc), while we consider a slightly higher density range, i.e. . With our choice of , we cover the range and in .
For both the PDR and XDR models, CLOUDY computes the emergent CO line emissivity (, with varying from 1 to 11) as a function of the depth the radiation penetrates into the cloud. In our models we set a maximum total gas column density =23.
In Fig. 3 we show the CO(5-4)/CO(4-3) (top panel) and the CO(10-9)/CO(5-4) (botton panel) ratios as a function of and , obtained with a set of PDR models fixed pc, from the stellar radiation source. This spatial scale is equal to the extension of the CO(6-5) emission observed with ALMA by Zhao et al. (2016). The simultaneous study of the two ratios is essential to understand whether the CO SLED can be reproduced by a unique set of PDR models with clouds at fixed distance from the galaxy center, or additional components are needed. In Fig. 3 (top panel), the white line highlights the parameter space in and , that can reproduce the observed CO(5-4)/CO(4-3)) ratio. These parameter ranges, typical of PDRs, do not reproduce the observed CO(10-9)/CO(5-4) ratio. Hence, for reproducing the mid to high-J CO transition there are two possibilities: (a) a PDR + a component that accounts for the contribution of the shock–heated gas and (b) a PDR + an XDR. We favor the scenario (a) (PDR+XDR), as the most likely one, on the basis of the following considerations.
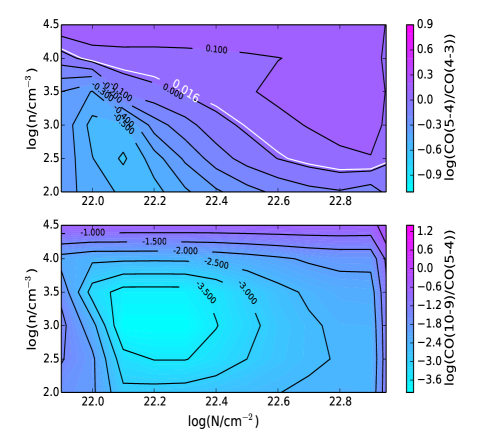
A chemistry driven by shocks (scenario (b), supported by Pereira-Santaella et al. 2014) is unlikely given the observed ratio. As reported in Gallerani et al. (2014), a key difference between shocks and radiative excitation by UV and/or X-rays is that shocks do not heat dust as effectively as they do for gas. NGC7130 has an observed ratio , a factor typical of XDR/PDR models (e.g. Meijerink & Spaans 2005), while a value of , as found by Meijerink et al. (2013) in NGC6240, seems to be more related to shocks, compressing the gas and heating it to higher temperatures, while not affecting the dust (see also Lee et al. 2016). Moreover, X-ray photons, as the primary heating mechanism of the high-J CO lines is supported by (i) the clear detection, thanks mostly to NuSTAR data, of a hard X-ray flux originating from a central accreting engine (see Sec. 2.1) and (ii) by the presence of mid-IR [NeV] that is a clear sign (Tommasin et al. 2010, Gruppioni et al. 2016) of the effect of AGN activity on the ISM of the host galaxy.
Given the considerations reported above, we consider three components: a PDR and one XDR for the mid to high-J CO transitions, embedded in a more rarefied and extended PDR envelope accounting for the low-J transition. A similar model was presented by van der Werf et al. (2010) for reproducing the CO SLED of Mrk231. In Fig. 2 our best-fit model is presented. We find the best fit by a minimitation routine with 9 free parameters: the density, the radiation field intensity and the normalization for each of the 3 components. We fix the column density cm-2 for the PDRs and cm-2 for XDR. As shown by Meijerink & Spaans (2005) (see also McKee & Ostriker 2007, Cormier et al. 2014), while in PDR the carbon monoxide over atomic carbon ratio (CO/C) ratio raises by 4 dex from the illuminated cloud surface to cm-2, in XDR CO/C is almost constant up to cm-2 and then increases slowly.
sThe level of confidence on the normalizations reported in Fig. 2 have been obtained by marginalizing over the other parameters and considering a =3.5 (see Lampton et al. 1976). According to our model, the PDR and XDR reproducing the mid-J and high-J transitions are characterized by gas density (3.5) and the gas is located at 125 pc (250 pc) from the source of radiation, respectively (corresponding to and =5.3 erg cm-2s-1). The typical thickness and gas temperature of the CO emitting regions for the PDR and XDR are: 0.3, 4 pc and T=40, T=100 K, respectively. As expected X-rays photons keep the gas temperature higher at larger depths. The diffuse PDR component, accounting for the low-J lines, is characterised by a low-density gas () exposed to a FUV flux . The emission originates from regions of thickness =20 pc, typical of GMC in the MW (see Murray 2011). The gas temperature is T=25 K.
The presence of, at least, two temperatures components to model the CO SLED of NGC7130 is consistent with the results found in star-forming galaxies (i.e. Daddi et al. 2015, Kamenetzky et al. 2016). The presence of an extra XDR component extends to lower X-ray luminosities (by a factor of 4) the result found by van der Werf et al. (2010) for modeling the high-J levels of the local CT-AGN Mrk231.
The total cold gas mass necessary to fit the CO observation is and completely dominating the total mass. Considering the observed CO(1-0) luminosity ( pc2 K km s-1), the estimated gas mass allow us to estimate directly the CO-to-H2 conversion factor, =1.1 M⊙ pc-2 K km s-1 (where , see Solomon & Vanden Bout 2005). The CO-to-H2 conversion factor shows a wide range of values reflecting the different ISM conditions (see Fig. 12 from the review of Bolatto et al. 2013). The normal galaxy disks return high values for (=4.6 M⊙ pc-2 K km s-1 for the MW, Solomon & Barrett 1991) while drops to very low values (up to =0.3 M⊙ pc-2 K km s-1) for active and ULIRGs galaxies (see also Downes & Solomon 1998, Papadopoulos et al. 2012). The value found is consistent with the overall properties of NGC7130 being a LIRG galaxy hosting a moderate, obscured AGN.
4 Summary
In this letter, we have presented a detailed modelling of the molecular gas in NGC7130 through the study of the CO Spectral Line Energy Distribution. Key informations are derived from the ALMA data of the CO(6-5) transition and from the X-ray Chandra+ NuSTAR data. The high-resolution ALMA data allow us to constrain the physical CO emission down to 70 pc scales, while the X-ray data confirm the presence of a central highly obscured AGN.
According to our modelling, three components are needed to reproduce the CO SLED: a PDR with parameters typical of the diffuse cold ISM (, T25 K); a PDR, at relatively higher density and temperatures (, T40 K) and an extra warm XDR component for (, T100 K). An XDR driven chemistry for the high-J CO lines is supported by our multicomponent –fitting the CO SLED. The presence of an XDR is discussed against heating due to shocks. Our modeling predicts a cold gas mass of , that implies a CO-to-H2 conversion factor =1.1 M⊙ pc-2 K km s-1.
These results show the strength of combining multi-band and multi-resolution data to assess the impact of the AGN and star-formation activity on the physics of molecular gas. The future exploitation of the data in the ALMA archive will allow us to enlarge the sample and place the results on NGC7130 on a more statistically significant context. Moreover, we intend to extend the analysis performed on the CO to other molecules, such as HCN, HCO+. These molecules, characterized by high critical densities (5), allow to trace different parameter space of the GMCs, and their flux ratios permit to highlight the presence and strength of an AGN (i.e. Imanishi et al. 2016).
5 Acknowledgements
We acknowledge support from Italian node of the Alma Regional Center. This paper makes use of the ALMA data ADS/JAO.ALMA#2013.1.00524.S. FP kindly thanks the referee Matthew Malkan and Andrea Cimatti.
References
- Abel & Satyapal (2008) Abel N. P., Satyapal S., 2008, ApJ, 678, 686
- Albrecht et al. (2007) Albrecht M., Krügel E., Chini R., 2007, A&A, 462, 575
- Arnaud (1996) Arnaud K. A., 1996, in Astronomical Society of the Pacific Conference Series, Vol. 101, Astronomical Data Analysis Software and Systems V, Jacoby G. H., Barnes J., eds., p. 17
- Bolatto et al. (2013) Bolatto A. D., Wolfire M., Leroy A. K., 2013, ARA&A, 51, 207
- Cormier et al. (2014) Cormier D. et al., 2014, A&A, 564, A121
- Daddi et al. (2015) Daddi E. et al., 2015, A&A, 577, A46
- Downes & Solomon (1998) Downes D., Solomon P. M., 1998, ApJ, 507, 615
- Ferland et al. (2013) Ferland G. J. et al., 2013, Rev. Mex. Astron. Astrofis., 49, 137
- Gallerani et al. (2014) Gallerani S., Ferrara A., Neri R., Maiolino R., 2014, MNRAS, 445, 2848
- Gruppioni et al. (2016) Gruppioni C. et al., 2016, MNRAS, 458, 4297
- Habing (1968) Habing H. J., 1968, Bull. Astron. Inst. Netherlands, 19, 421
- Hollenbach & Tielens (1999) Hollenbach D. J., Tielens A. G. G. M., 1999, Reviews of Modern Physics, 71, 173
- Imanishi et al. (2016) Imanishi M., Nakanishi K., Izumi T., 2016, AJ, 152, 218
- Kamenetzky et al. (2016) Kamenetzky J., Rangwala N., Glenn J., Maloney P. R., Conley A., 2016, ApJ, 829, 93
- Korista et al. (1997) Korista K., Ferland G., Baldwin J., 1997, ApJ, 487, 555
- Koss et al. (2016) Koss M. J. et al., 2016, ApJ, 825, 85
- Lampton et al. (1976) Lampton M., Margon B., Bowyer S., 1976, ApJ, 208, 177
- Lee et al. (2016) Lee M.-Y. et al., 2016, A&A, 596, A85
- Leitherer et al. (1999) Leitherer C. et al., 1999, ApJS, 123, 3
- Lejeune et al. (1997) Lejeune T., Cuisinier F., Buser R., 1997, A&AS, 125
- Levenson et al. (2005) Levenson N. A., Weaver K. A., Heckman T. M., Awaki H., Terashima Y., 2005, ApJ, 618, 167
- Lu et al. (2017, arXiv1703.00005) Lu N. et al., 2017, arXiv1703.00005
- Lu (1998) Lu N. Y., 1998, ApJ, 506, 673
- McKee & Ostriker (2007) McKee C. F., Ostriker E. C., 2007, ARA&A, 45, 565
- Meijerink et al. (2013) Meijerink R. et al., 2013, ApJ, 762, L16
- Meijerink & Spaans (2005) Meijerink R., Spaans M., 2005, A&A, 436, 397
- Meijerink et al. (2007) Meijerink R., Spaans M., Israel F. P., 2007, A&A, 461, 793
- Murphy & Yaqoob (2009) Murphy K. D., Yaqoob T., 2009, MNRAS, 397, 1549
- Murray (2011) Murray N., 2011, ApJ, 729, 133
- Obreschkow et al. (2009) Obreschkow D., Heywood I., Klöckner H.-R., Rawlings S., 2009, ApJ, 702, 1321
- Panuzzo et al. (2010) Panuzzo P. et al., 2010, A&A, 518, L37
- Papadopoulos et al. (2012) Papadopoulos P. P., van der Werf P. P., Xilouris E. M., Isaak K. G., Gao Y., Mühle S., 2012, MNRAS, 426, 2601
- Pereira-Santaella et al. (2013) Pereira-Santaella M. et al., 2013, ApJ, 768, 55
- Pereira-Santaella et al. (2014) Pereira-Santaella M., Spinoglio L., van der Werf P. P., Piqueras López J., 2014, A&A, 566, A49
- Ricci et al. (2017) Ricci C. et al., 2017, MNRAS
- Risaliti et al. (1999) Risaliti G., Maiolino R., Salvati M., 1999, ApJ, 522, 157
- Rosenberg et al. (2015) Rosenberg M. J. F. et al., 2015, ApJ, 801, 72
- Salpeter (1955) Salpeter E. E., 1955, Vistas in Astronomy, 1, 283
- Schmutz et al. (1992) Schmutz W., Leitherer C., Gruenwald R., 1992, PASP, 104, 1164
- Solomon & Barrett (1991) Solomon P. M., Barrett J. W., 1991, in IAU Symposium, Vol. 146, Dynamics of Galaxies and Their Molecular Cloud Distributions, Combes F., Casoli F., eds., p. 235
- Solomon & Vanden Bout (2005) Solomon P. M., Vanden Bout P. A., 2005, ARA&A, 43, 677
- Spinoglio et al. (2015) Spinoglio L., Pereira-Santaella M., Dasyra K. M., Calzoletti L., Malkan M. A., Tommasin S., Busquet G., 2015, ApJ, 799, 21
- Tommasin et al. (2010) Tommasin S., Spinoglio L., Malkan M. A., Fazio G., 2010, ApJ, 709, 1257
- Vallini et al. (2017) Vallini L., Ferrara A., Pallottini A., Gallerani S., 2017, MNRAS
- van der Werf et al. (2010) van der Werf P. P. et al., 2010, A&A, 518, L42
- Véron-Cetty & Véron (2006) Véron-Cetty M.-P., Véron P., 2006, A&A, 455, 773
- Zamorani et al. (1981) Zamorani G. et al., 1981, ApJ, 245, 357
- Zhao et al. (2016) Zhao Y. et al., 2016, ApJ, 820, 118