Observational hints of a real age spread in the young LMC star cluster NGC 1971
Abstract
We report the serendipitous young Large Magellanic Cloud cluster, NGC 1971, exhibits an extended main-sequence turnoff (eMSTO) possibly originated by mostly a real age spread. We used Washington photometry to produce a colour-magnitude diagram (CMD) with the fiducial cluster features. From its eMSTO, we estimated an age spread of 170 Myr (observed age range 100-280 Myr), once observational errors, stellar binarity, overall metalicity variations and stellar rotation effects were subtracted in quadrature from the observed age width.
keywords:
techniques: photometric – galaxies: individual: LMC – galaxies: star clusters: general – galaxies: star clusters: individual: NGC 19711 Introduction
A recent study on the population of extended main-sequence turn-off (eMSTO) clusters in the Large Magellanic Cloud (LMC) showed that the eMSTO phenomenon is not caused by actual age spread within the cluster (Piatti & Bastian, 2016b). Furthermore, the authors confirmed that clusters with log( yr-1) 9.29.3 have broader MSTOs than younger and older clusters on average, in very good agreement with Bastian et al. (2016, see their Fig. 4). For clusters younger than 1 Gyr they showed a strong correlation with age as found by Niederhofer et al. (2015) and discussed at length in Niederhofer et al. (2016). The latter invoked stellar evolutionary effects (e.g. due to stellar rotation) to explain the eMSTOs, which may mimic the effect of an age spread.
The way to test if age is the defining parameter of eMSTOs is to look for them in younger clusters (500 Myr). Indeed, NGC 1755 (Milone et al., 2016, Myr), NGC 1850 (Bastian et al., 2016, Myr), NGC 1856 (D’Antona et al., 2015; Li et al., 2017, Myr), show small eMSTOs, consistent with the trend showed by Niederhofer et al. (2015).
In this Letter, we report the first young LMC cluster, NGC 1971, with an observed real age spread as shown by the Washington photometry colour-magnitude diagram (CMD) analysis. The cluster, located in the South-Eastern half of the LMC bar, has only been photometrically studied in detail by Dieball & Grebel (2000), so that there was no clue about a possible unusual broadness at its MSTO as to pay attention to. This finding points to the need for further observations in order to investigate in detail the eMSTO phenomenon in NGC 1971, namely, the fraction of blue and red MS stars, their spatial radial distributions, as well as spectrocopic follow-ups to tag metal abundance inhomogeneities and kinematics. In Section 2 we describe the observational data set, while Section 3 deals with the construction of the cluster CMD. Section 4 presents the estimation of its astrophysical properties and the analysis about the possible origin of the observed eMSTO.
2 Observational data
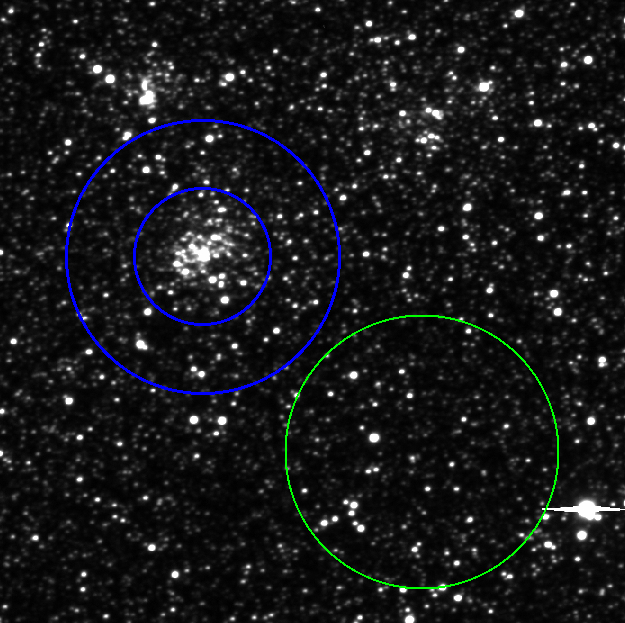
We made use of Washington images available at the National Optical Astronomy Observatory (NOAO) Science Data Management (SDM) Archives111http://www.noao.edu/sdm/archives.php.. They were obtained at the Cerro-Tololo Inter-American Observatory (CTIO) 4 m Blanco telescope with the Mosaic II camera attached (3636 field onto a 8K8K CCD detector array) as part of a survey of the most metal-poor stars outside the Milky Way (CTIO 2008B-0296 programme, PI: Cole). The images analyzed here consist of a 420 s and a 30 s exposures carried out under photometric conditions at an airmass of 1.3. Fig. 1 shows an enlargement of the image centred on the cluster region.
We processed the images, measured the instrumental magnitudes and stardardized the photometry in a comprehensive way, as previously performed for similar data sets (e.g. Piatti et al., 2012; Piatti, 2012, 2015, and references therein), together with the whole data set for the aforementioned CTIO programme, which comprises 17 different LMC fields, and 3 standard fields observed three times per night (Dec.27-30, 2008) to secure the quality of the transformation equations (Piatti et al., 2017). We summarize here some specific issues in order to provide the reader with an overview of the photometry quality. The data reduction followed the procedures documented by the NOAO Deep Wide Field Survey team (Jannuzi et al., 2003) and utilized the mscred package in IRAF222IRAF is distributed by the National Optical Astronomy Observatories, which is operated by the Association of Universities for Research in Astronomy, Inc., under contract with the National Science Foundation.. We performed overscan, trimming and cross-talk corrections, bias subtraction, flattened all data images, etc., once the calibration frames (zeros, sky- and dome- flats, etc) were properly combined. For each image we obtained an updated world coordinate system (WCS) database with a rms error in right ascension and declination smaller than 0.4 arcsec, by using 500 stars catalogued by the USNO333http://www.usno.navy.mil/USNO/astrometry/optical-IR-prod/icas/usno-icas.
The stellar photometry was performed using the star-finding and point-spread-function (PSF) fitting routines in the daophot/allstar suite of programs (Stetson et al., 1990). We measured magnitudes on the single image created by joining all 8 chips together using the updated WCS. This allowed us to use a unique reference coordinate system for each LMC field. For each Mosaic image, a quadratically varying PSF was derived by fitting 1000 stars (nearly 110-130 stars per chip), once the neighbours were eliminated using a preliminary PSF derived from the brightest, least contaminated 250 stars (nearly 30-40 stars per chip). Both groups of PSF stars were interactively selected. We then used the allstar program to apply the resulting PSF to the identified stellar objects and to create a subtracted image which was used to find and measure magnitudes of additional fainter stars. This procedure was repeated three times for each frame. We computed aperture corrections from the comparison of PSF and aperture magnitudes by using the neighbour-subtracted PSF star sample. Finally, we standardized the resulting instrumental magnitudes and combined all the independent measurements using the stand-alone daomatch and daomaster programs444Provided kindly by Peter Stetson.. Note that the filter has significantly higher throughput as compared with the standard Washington filter so that magnitude can be accurately transformed to yield magnitudes (Geisler, 1996).
We first examined the quality of our photometry in order to evaluate the influence of the photometric errors, crowding effects and the detection limit on the cluster CMD fiducial characteristics. To do this, we performed artificial star tests to derive the completeness level at different magnitudes. We used the stand-alone addstar program in the daophot package Stetson et al. (1990) to add synthetic stars, generated bearing in mind the colour and magnitude distributions of the stars in the CMDs (mainly along the cluster main-sequence), as well as its radial stellar density profile. We added a number of stars equivalent to 5 of the measured stars in order to avoid in the synthetic images significantly more crowding than in the original images. On the other hand, to avoid small number statistics in the artificial-star analysis, we created a thousand different images for each original one. We used the option of entering the number of photons per ADU in order to properly add the Poisson noise to the star images.
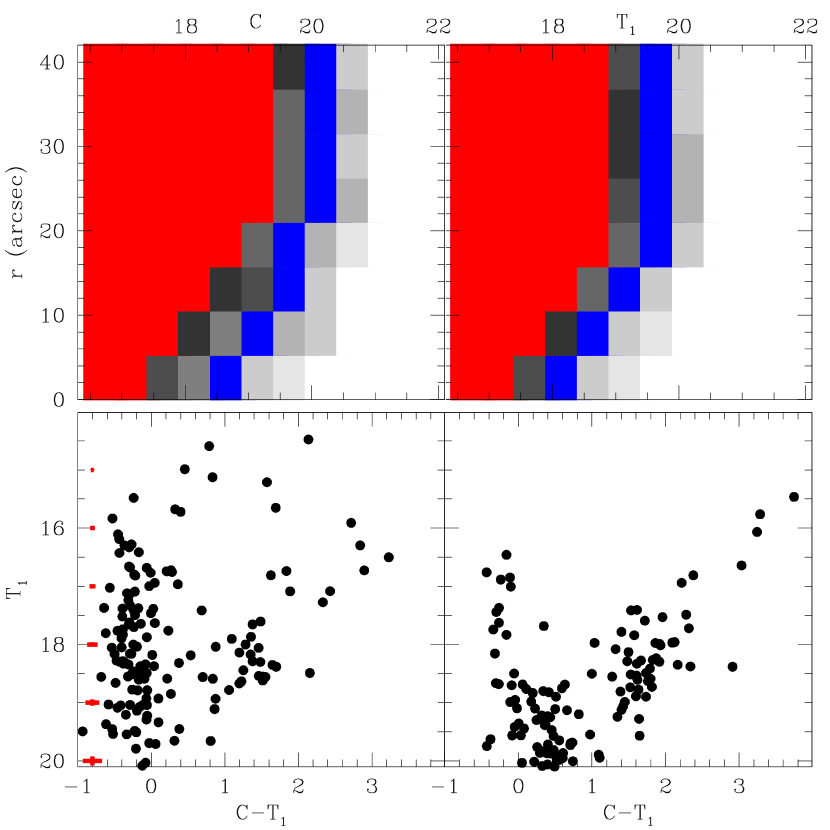
We then repeated the same steps to obtain the photometry of the synthetic images as described above, i.e., performing three passes with the daophot/allstar routines. The star-finding efficiency were estimated by comparing the output and the input data for these stars using the daomatch and daomaster tasks. We illustrate in Fig. 2 the resultant completeness fractions in the radius versus magnitude plane. As can be seen, the dependence of the completeness fraction with the distance from the cluster centre nearly starts at a radius 20 arcsec, which corresponds to the distance from the cluster centre where the combined cluster plus background stellar density profile is no longer readily distinguished from a constant background value within 1- of its fluctuation. We adopt this radius to build the cluster CMD. Note that we are not interested in properties such as the cluster’s structure or stellar density profile, but in the stars which allow us to meaningfully define the cluster’s fiducial sequences in its CMD.
3 NGC 1971’s CMD
The CMD for stars with measurements located within the adopted cluster radius is shown in Fig. 2. To filter the field stars from the CMD, we applied a statistical procedure developed by Piatti & Bica (2012) and successfully used elsewhere (e.g. Piatti, 2014; Piatti et al., 2015a; Piatti et al., 2015b; Piatti & Bastian, 2016a, and references therein), which consists, firstly, in adopting four CMDs from different regions located reasonably far from the cluster, but not too far so as to risk losing the local field-star signature in terms of stellar density, luminosity function and/or colour distribution. Each field, with area 2, was used as a reference to statistically filter the stars in an equal circular area centred on NGC 1971 (see, as an example, the green circle in Fig. 1).
Starting with reasonably large boxes – typically ((),()) = (1.00, 0.50) mag – centred on each star in the four field CMDs and by subsequently reducing their sizes until they reach the stars closest to the boxes’ centres in magnitude and colour, separately, we defined boxes which result in use of larger areas in field CMD regions containing a small number of stars, and vice versa. Note that the definition of the position and size of each box involves two field stars, one at the centre of the box and another -the closest one to box centre - placed on the boundary of that box. Piatti & Bica (2012) have shown that this is an effective way of accounting for the local field-star signature in terms of stellar density, luminosity function and/or colour distribution.
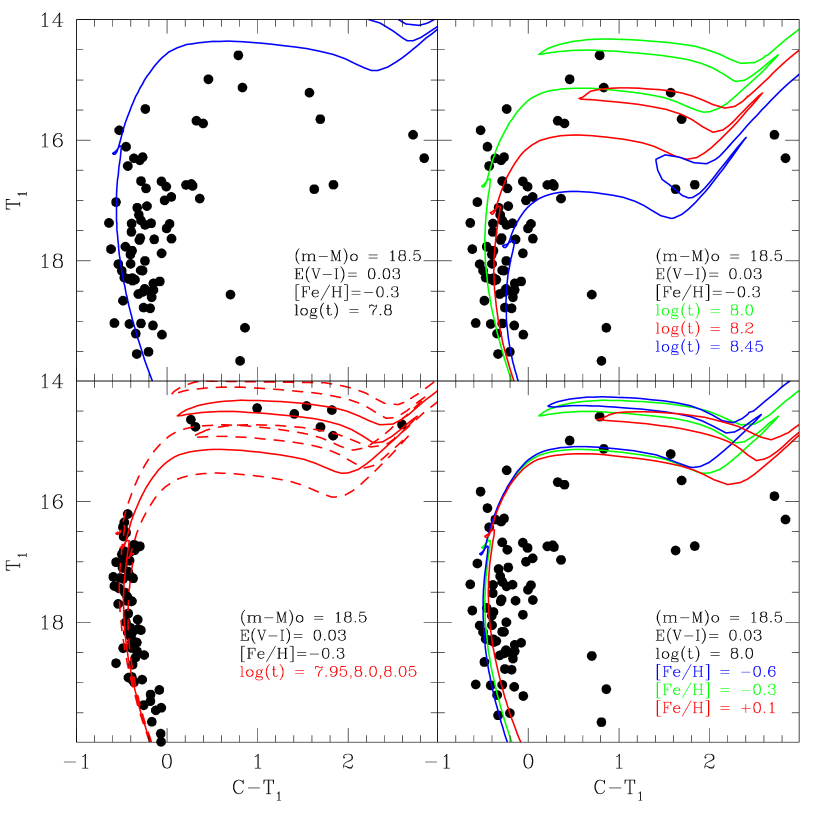
When comparing the four cleaned CMDs, we counted the number of times a star remained unsubtracted in all of them. Thus, we distinguished stars that appear once, twice, until four times, respectively. Stars appearing once can be associated to a probability of being a fiducial feature in the cleaned CMD, i.e., stars that could most frequently be found in a field-star CMD. Stars that appear twice () could equally likely be associated with either the field or the object of interest; and those with 75%, i.e., stars found in three or four cleaned CMDs, belong predominantly to the cleaned CMD rather than to the field-star CMDs. Statistically speaking, a certain amount of residuals is expected, which depends on the degree of variability of the stellar density, luminosity function and colour distribution of the star fields. Fig. 3 (upper-left panel) depicts the resulting CMD for stars that comply with 75%. Since the stars are concentrated in a very small area, we are confident of dealing with fiducial cluster features. In the figure, we superimposed the isochrone computed by Bressan et al. (2012) corresponding to the solution adopted by Dieball & Grebel (2000) for the cluster properties, i.e., = 0.03 mag, = 18.5 mag, Z=0.008 dex and log( yr-1) = 7.8.
4 Analysis and discussion
As can be seen (Fig. 3, upper-left panel), the results obtained by Dieball & Grebel (2000) are not a perfect match to the cluster CMD. A slighlty older isochrone (log( yr-1) = 8.0) apparently reproduces more robustly the cluster sequences, as is shown by the lime-coloured isochrone drawn in the upper-right panel. Nevertheless, there still exists a large amount of stars, redder than the isochrone colours, that make the overall fit visibly unsatisfactory. If we thought in a cluster formed from a single stellar populataion, we possibly should adopt an isochrone that runs like the one drawn in red (log( yr-1) = 8.2) with a mean dispersion of (log( yr-1)) = . This seems to be too large an age spread to eliminate by appealing to differential reddening, binarity, evolutionary effects (i.e. stellar rotation), and/or metallicity variations.
As far as we are aware, the reddening across the small cluster area ( 20 arcsec) is very low (( = 0.03 mag Dieball & Grebel, 2000), as can also be confirmed from the relatively narrow MS of the adjacent star field shown in Fig. 2. On the other hand, a differential reddening of 0.4 mag would be needed to explain the broadness of the upper MSTO, in constrast with very low reddening found in the LMC bar region (Haschke et al., 2011).
In order to estimate the impact of photometric errors and stellar binarity on the cluster upper MS, we generated a synthetic CMD by employig the ASteCA suit of functions (Perren et al., 2015). We used an isochrone of log( yr-1) = 8.0 and the above distance modulus, reddening and global metal content. The steps by which the synthetic cluster was generated is as follows: i) the theoretical isochrone was densely interpolated to contain a thousand points throughout its entire length, including the most evolved stellar phases. ii) The isochrone was shifted in colour and magnitude according to the and values to emulate the effects these extrinsic parameters have over the isochrone in the CMD. At this stage the synthetic cluster can be objectively identified as a unique point in the 4-dimensional space of parameters (, , age and metallicity). iii) The isochrone was trimmed down to a certain faintest magnitude according to the limiting magnitude thought to be reached. iv) An initial mass function (IMF, Chabrier, 2001) was sampled in the mass range up to a total mass value provided via an input data file that ensures the evolved CMD regions result properly populated. The distribution of masses was then used to obtain a properly populated synthetic cluster by keeping one star in the interpolated isochrone for each mass value in the distribution. v) A relatively high fraction of stars were assumed to be binaries, which was set to (Milone et al., 2016; Piatti & Bastian, 2016b), with secondary masses drawn from a uniform distribution between the mass of the primary star and a fraction of of it. vi) The appropriate magnitude completeness and photometric errors (see Section 2) were finally applied to the synthetic cluster. The resulting synthetic CMD is shown in the bottom-left panel of Fig. 3 to which we superimpossed the isochrones of log( yr-1) = 7.95, 8.0 and 8.05, respectively. As can be seen, the apparent spread produced by the photometric errors and stellar binarity, (log( yr-1)) = 0.05, does not explain the observed eMSTO.
Metallicity variations were tested by matching three isochrones for the same age and differente overall metalicities. The range of [Fe/H] values was adopted on the basis of the known metallicity spread of young LMC stellar populations (see, e.g. Dieball & Grebel, 2000; Piatti & Geisler, 2013, and reference therein), among others. Consequently, we chose as a lower and upper limits, [Fe/H] = -0.6 dex and +0.1 dex, respectively. We used the isochrones of Bressan et al. (2012), which assume Y= 0.2485 + 1.78Z. The results of the isochrone matching are shown in the bottom-right panel of Fig. 3, which confirms that overall metallicity inhomegeneities are neither responsable for the observed eMSTO. We did not explore He or light elements variations, because we do not have available theoretical tracks for the Washington system to carry out such an analysis (see., e.g., Padova555http://stev.oapd.inaf.it/cgi-bin/cmd, BasTI666http://www.oa-teramo.inaf.it/BASTI, Geneva777http://obswww.unige.ch/Recherche/evoldb/index/, Darthmouth888http://stellar.dartmouth.edu/ models/ repositories).
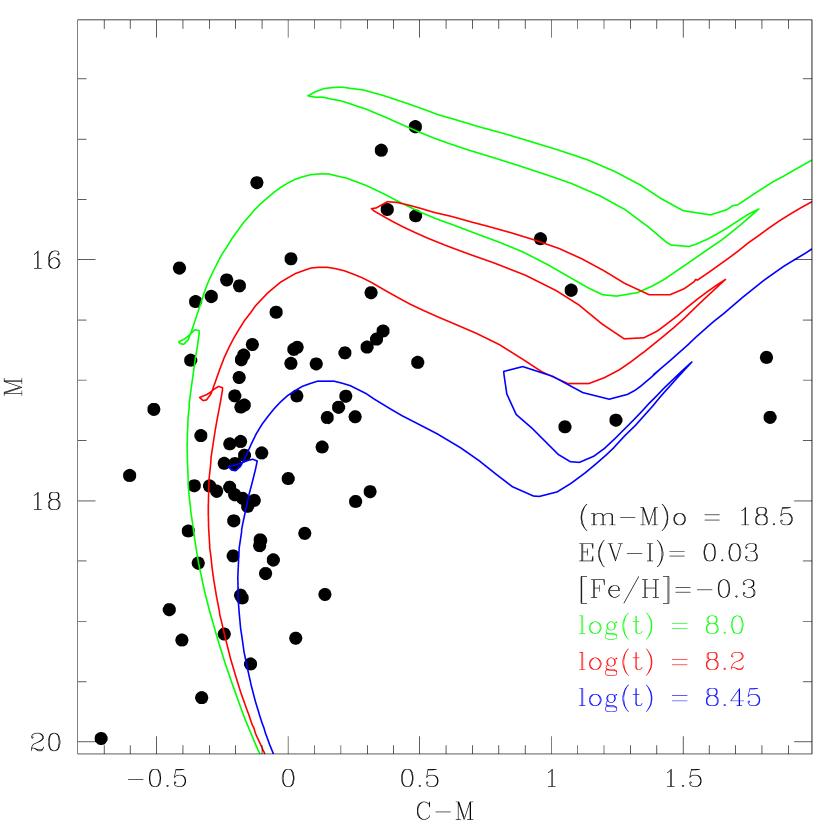
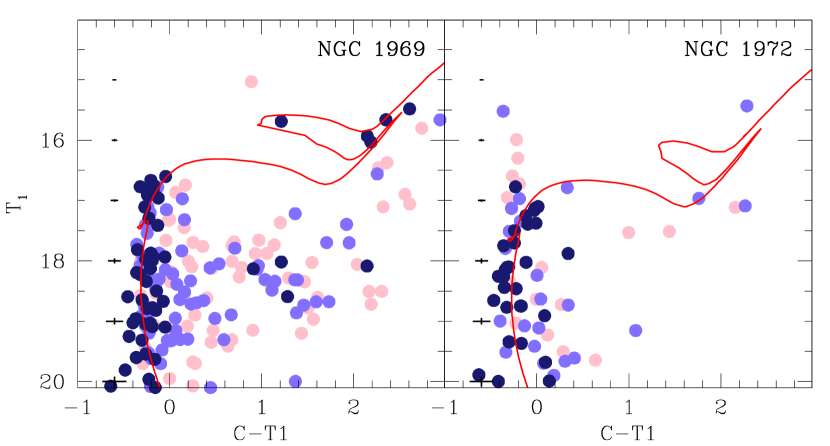
As for estimating the magnitude of stellar rotation effects, we made use of the relationship obtained by Niederhofer et al. (2015) between the age of a star cluster and the expected (apparent) age spread. Thus, by interpolating an age of 100 Myr (log( yr-1) = 8.0) in their Fig. 2, we obtained (age) 35 Myr. Bastian et al. (2017) found a high fraction of Be stars in NGC 1850 ( 80 Myr) and NGC 1856 ( 280 Myr) that implies a high fraction of radiply rotating stars. As H contributes to the mag, the observed broadness could be affected by Be stars. However, our additional Washington photometry (Piatti et al., 2017) confirms that the observed spread is not mainly caused by rapid rotators (see Fig. 4). Finally, we estimated the real age spread by approximating the observed and the different modelled (as simple stellar populations of the best fitting age) age distributions as Gaussians, and subtracted the age widths from stellar binarity and observational errors ((age) = 46 Myr), from metallicity variations ((age) = 20 Myr) and from stellar rotation from the observed width ((age) = 180 Myr) in quadrature to obtain a intrinsic real age width of (age) = 170 Myr. This result reveals, for the first time, the existence of a young LMC cluster with an eMSTO mostly originated by a real age spread. We also analyzed NGC 1969 and NGC 1972 (see Figs. 1 and 5) and derived ages of log( yr-1) = 8.3 and 8.4, respectively, and found no age spread at their MSTOs.
Acknowledgements
We thank the referee for his/her thorough reading of the manuscript and timely suggestions to improve it.
References
- Bastian et al. (2016) Bastian N., et al., 2016, MNRAS,
- Bastian et al. (2017) Bastian N., et al., 2017, MNRAS, 465, 4795
- Bica & Alloin (1986) Bica E., Alloin D., 1986, A&A, 162, 21
- Bressan et al. (2012) Bressan A., Marigo P., Girardi L., Salasnich B., Dal Cero C., Rubele S., Nanni A., 2012, MNRAS, 427, 127
- Chabrier (2001) Chabrier G., 2001, ApJ, 554, 1274
- D’Antona et al. (2015) D’Antona F., Di Criscienzo M., Decressin T., Milone A. P., Vesperini E., Ventura P., 2015, MNRAS, 453, 2637
- Dieball & Grebel (2000) Dieball A., Grebel E. K., 2000, A&A, 358, 897
- Geisler (1996) Geisler D., 1996, AJ, 111, 480
- Haschke et al. (2011) Haschke R., Grebel E. K., Duffau S., 2011, AJ, 141, 158
- Jannuzi et al. (2003) Jannuzi B. T., Claver J., Valdes F., 2003, The NOAO Deep Wide Field Survey MOSAIC Data Reductions, http://www.noao.edu/noao/noaodeep/ReductionOpt/frames.html
- Li et al. (2017) Li C., de Grijs R., Deng L., Milone A. P., 2017, ApJ, 834, 156
- Milone et al. (2016) Milone A. P., Marino A. F., D’Antona F., Bedin L. R., Da Costa G. S., Jerjen H., Mackey A. D., 2016, MNRAS, 458, 4368
- Niederhofer et al. (2015) Niederhofer F., Georgy C., Bastian N., Ekström S., 2015, MNRAS, 453, 2070
- Niederhofer et al. (2016) Niederhofer F., Bastian N., Kozhurina-Platais V., Hilker M., de Mink S. E., Cabrera-Ziri I., Li C., Ercolano B., 2016, A&A, 586, A148
- Perren et al. (2015) Perren G. I., Vázquez R. A., Piatti A. E., 2015, A&A, 576, A6
- Piatti (2012) Piatti A. E., 2012, MNRAS, 422, 1109
- Piatti (2014) Piatti A. E., 2014, MNRAS, 440, 3091
- Piatti (2015) Piatti A. E., 2015, MNRAS, 451, 3219
- Piatti & Bastian (2016a) Piatti A. E., Bastian N., 2016a, preprint, (arXiv:1603.06891)
- Piatti & Bastian (2016b) Piatti A. E., Bastian N., 2016b, MNRAS, 463, 1632
- Piatti & Bica (2012) Piatti A. E., Bica E., 2012, MNRAS, 425, 3085
- Piatti & Geisler (2013) Piatti A. E., Geisler D., 2013, AJ, 145, 17
- Piatti et al. (2012) Piatti A. E., Geisler D., Mateluna R., 2012, AJ, 144, 100
- Piatti et al. (2015a) Piatti A. E., de Grijs R., Rubele S., Cioni M.-R. L., Ripepi V., Kerber L., 2015a, MNRAS, 450, 552
- Piatti et al. (2015b) Piatti A. E., et al., 2015b, MNRAS, 454, 839
- Piatti et al. (2017) Piatti A. E., Cole A., Emptage B., 2017, in preparation.
- Stetson et al. (1990) Stetson P. B., Davis L. E., Crabtree D. R., 1990, in Jacoby G. H., ed., Astronomical Society of the Pacific Conference Series Vol. 8, CCDs in astronomy. pp 289–304