Multi-mission observations of the old nova GK Per during the 2015 outburst
Abstract
GK Per, a classical nova of 1901, is thought to undergo variable mass accretion on to a magnetized white dwarf (WD) in an intermediate polar system (IP). We organized a multi-mission observational campaign in the X-ray and ultraviolet (UV) energy ranges during its dwarf nova (DN) outburst in 2015 March-April. Comparing data from quiescence and near outburst, we have found that the maximum plasma temperature decreased from about 26 to 16.2 keV. This is consistent with the previously proposed scenario of increase in mass accretion rate while the inner radius of the magnetically disrupted accretion disc shrinks, thereby lowering the shock temperature. A NuSTAR observation also revealed a high-amplitude WD spin modulation of the very hard X-rays with a single-peaked profile, suggesting an obscuration of the lower accretion pole and an extended shock region on the WD surface. The X-ray spectrum of GK Per measured with the Swift X-Ray Telescope varied on time-scales of days and also showed a gradual increase of the soft X-ray flux below 2 keV, accompanied by a decrease of the hard flux above 2 keV. In the Chandra observation with the High Energy Transmission Gratings, we detected prominent emission lines, especially of Ne, Mg and Si, where the ratios of H-like to He-like transition for each element indicate a much lower temperature than the underlying continuum. We suggest that the X-ray emission in the 0.8–2 keV range originates from the magnetospheric boundary.
keywords:
(stars:) novae, cataclysmic variables — stars: individual: GK Per1 Introduction
GK Per underwent a nova explosion on 1901 February 21 (Williams, 1901) and after a long period of irregular fluctuations, in 1948, it started to behave like a dwarf nova (DN), with small amplitude (1 – 3 mag.) outbursts lasting for up to two months and recurring at intervals that can be roughly expressed as n days (Sabbadin & Bianchini, 1983). The widely accepted explanation of these outbursts is a recurring thermal instability in the inner part of the accretion disc (inside-out outbursts; see Bianchini et al. 1986, Kim et al. 1992 for the application of the disc instability model to GK Per).
GK Per, at a distance of 470 pc (McLaughlin, 1960), is the second closest nova to us and the best monitored at quiescence. It is surrounded by an expanding nova shell, which emits in the X-rays (Balman, 2005; Takei et al., 2015), weakly in UV (Evans et al., 1992), optical (e.g. Shara et al., 2012), infrared (e.g. Eyres et al., 1999) and radio (Anupama & Kantharia, 2005) bands and has a complex structure with numerous knots (Liimets et al., 2012) and a jet-like feature.
The orbital period is 1.9968 d (Crampton et al., 1986; Morales-Rueda et al., 2002). The secondary is a K2-type subgiant mass of 0.25–0.48 M☉ (Warner, 1976; Watson et al., 1985; Morales-Rueda et al., 2002) and the mass of the primary is 0.860.02 M☉ (Suleimanov et al., 2016). GK Per has an extended accretion disc (1011 cm) and interpreting the typical duration of DN outbursts in GK Per as the viscous decay time-scale Evans et al. (2009b) find that only about 10 % of the disc is involved in the outbursts.
King et al. (1979) and Bianchini & Sabadin (1983) proposed that GK Per hosts a magnetic white dwarf (WD). Watson et al. (1985) discovered a modulation with a 351 s period in the X-ray light curve and proposed that this is the WD spin period. Watson et al. (1985) also noticed that the pulse fraction is 50 % above 3 keV and up to 80 % below 3 keV, but does not depend on the mean X-ray flux. The pulse profile is single-peaked in outburst and double-peaked, with smaller amplitude in quiescence (Norton et al., 1988; Hellier et al., 2004).
Apart from the spin-related modulation, during outbursts GK Per shows quasi periodic oscillations (QPOs) in X-rays and in the optical band with the characteristic time-scale of several kiloseconds (e.g Watson et al., 1985; Morales-Rueda et al., 1999; Nogami et al., 2002; Hellier et al., 2004). This time-scale is exceptionally long compared to what is typically observed in CVs (Warner, 2004). QPOs with periods of 360–390 s were also detected in optical observations of GK Per by several authors. Watson et al. (1985) noticed that the beat period between the spin period and the shorter-period QPOs is in the kiloseconds range, close to the period of the longer QPOs. Morales-Rueda et al. (1999) explored this idea, assuming that the QPOs are due to absorption of the emission from the innermost regions of the accretion disc by blobs of material in the magnetosphere. The 360–380 s period in this model is due to the the Keplerian velocity in the inner disc radius. Hellier et al. (2004) argued that this scenario explains the optical data of Morales-Rueda et al. (1999), but does not fit the X-ray observations. These authors suggested instead that bulges of material in the inner edge of the accretion disk, high above the disc plane, obscure the WD and the 5000s period is due to the slow-moving prograde waves in the innermost region of the disc (Warner & Woudt, 2002).
Several pieces of evidence indicate that during DN outbursts the accretion disk in GK Per pushes the magnetosphere towards the surface of the WD (Hellier et al., 2004; Vrielmann et al., 2005; Suleimanov et al., 2016) as expected by theory (see, e.g., Ghosh & Lamb, 1979). This scenario, first proposed by Hellier et al. (2004) in analogy with XY Ari (Hellier et al., 1997), explains the single-peaked pulse profile as a consequence of cutting off the line of sight to the lower accreting pole. The maximum plasma temperature in GK Per in quiescence is higher than in outburst (Brunschweiger et al., 2009), which can also be understood in the context of the shrinking of the accretion disc (Suleimanov et al., 2005). However, while the hard X-ray emission can be explained as due to the accretion columns emitting bremsstrahlung radiation that is highly absorbed, the broad-band X-ray spectrum of GK Per and its evolution during outbursts are much more complex. Šimon (2015) noticed that the halt of the rise of the hard X-ray luminosity is not modelled only by just assuming increased absorption, and probably involves large structural changes of the accreting regions. Mukai et al. (2003) have shown that the outburst X-ray spectrum of GK Per below 2 keV is not consistent with a “typical” cooling-flow spectrum of an accreting WD and proposed a considerable contribution of photoionization. Vrielmann et al. (2005) and Evans & Hellier (2007) noticed that the soft X-ray emission of GK Per detected during the 2002 outburst may originate in the heated surface of the WD, like in the case of “soft intermediate polars”.
On 2015 March 6.84 Dubovsky (VSNET-ALERT 18388) and Schmeer (VSNET-ALERT 18389) discovered that GK Per has started a new DN outburst and was at a magnitude 12.8. We proposed a multimission observation campaign in order to follow the evolution of the object during the outburst and to obtain X-ray spectra in a broad energy range, revealing the physical processes that take place in this binary system.
2 X-ray observations and data analysis
We started the observations of the 2015 DN outburst of GK Per as soon as it became observable with Swift on March 12 2015, and we could follow the outburst almost until the optical maximum. We wanted a higher cadence than in the previous 2006 outburst Swift monitoring, and obtained two exposures per day for two weeks and one exposure per day in the following two weeks. During the first two weeks of the monitoring the Swift X-Ray Telescope (XRT) (Burrows et al., 2005) was in the automatic state (Hill et al., 2005), choosing the photon counting (PC) or window timing (WT) operating mode depending on the source count rate. During the second two weeks the monitoring was performed only in the WT mode. The Swift Ultraviolet Optical Telescope (UVOT) was in the image mode, providing the mean magnitude per exposure in one of the four UVOT filters (U, UVW1, UVM2, UVW2). Coordinated NuSTAR and Chandra Advanced Imaging Spectrometer High-Energy Transmission Grating (ACIS-S/HETG) observations were performed on April 4 2015, close to the optical maximum. The Chandra ACIS-S/HETG consists of two sets of gratings (Canizares et al., 2005), operating in the 31–2.5 Å (Medium Energy Grating) and 15–1.2 Å (High Energy Grating) energy ranges with the resolution better than 0.023 Å. NuSTAR has two detectors: FPMA and FPMB, covering the same energy range, from 3 to 79 keV. The time resolution of all the instruments used for the observations is better than 2.5 s, which is much shorter than the periodicities we expected to find. The Swift XRT spectra and the mean X-ray count rate per snapshot in the 0.3–10 keV energy range were obtained using the Swift XRT data products generator (Evans et al., 2009a, 2007), subsequently performing the barycentric correction with an applet111 http://astroutils.astronomy.ohio-state.edu/, created by Eastman et al. (2010). The Swift XRT light curves in the WT mode and in the PC mode (the latter excluding the central region and subsequently running xrtlccorr, because of the pile-up) and the UVOT data were processed with the ftools package. The Swift XRT light curves were barycentric corrected using barycorr tool.
We also used the processed Swift Burst Allert Telescope (BAT) data from the Swift BAT transient monitor page (Krimm et al., 2013). The Chandra data were reduced with CIAO v.4.7 and the NuSTAR data with the standard nuproducts pipeline. The NuSTAR and Chandra light curves were barycentric corrected. The X-ray spectra were analysed and fitted with XSPEC v. 12.8.2. The list of the observations with the exposure times and count rates is presented in table 1.
| Instrument | Date∗ | Exp.(s) | Count rate |
| Swift XRT(PC) | 57093.15 | 606.7 | 1.72 |
| 57093.58 | 1268.7 | 2.10 | |
| 57094.08 | 1033.0 | 1.70 | |
| 57094.68 | 373.6 | 1.15 | |
| 57095.04 | 952.8 | 2.12 | |
| 57095.93 | 960.3 | 1.41 | |
| 57096.30 | 744.7 | 1.49 | |
| 57096.90 | 441.3 | 1.79 | |
| 57097.04 | 970.3 | 1.33 | |
| 57097.57 | 937.7 | 0.94 | |
| 57098.03 | 997.9 | 1.62 | |
| 57098.97 | 882.6 | 1.35 | |
| 57099.17 | 875.0 | 1.28 | |
| 57099.57 | 514.0 | 1.78 | |
| 57100.11 | 922.7 | 1.58 | |
| 57100.97 | 1033.0 | 1.08 | |
| 57101.10 | 1133.3 | 1.11 | |
| 57101.57 | 925.2 | 1.64 | |
| 57102.23 | 1058.0 | 1.18 | |
| 57102.86 | 910.1 | 1.61 | |
| 57103.10 | 917.7 | 0.85 | |
| 57103.63 | 418.7 | 0.86 | |
| 57104.22 | 140.4 | 1.07 | |
| 57104.70 | 975.3 | 1.70 | |
| 57105.95 | 905.1 | 0.67 | |
| 57106.15 | 1075.6 | 1.72 | |
| 57106.76 | 965.3 | 1.15 | |
| 57107.29 | 1110.7 | 1.71 | |
| 57107.82 | 1196.0 | 0.70 | |
| Swift XRT(WT) | 57094.65 | 497.7 | 3.01 |
| 57106.15 | 28.7 | 3.6 | |
| 57108.75 | 985.2 | 1.24 | |
| 57109.62 | 986.3 | 1.43 | |
| 57110.51 | 1145.6 | 1.31 | |
| 57111.28 | 1086.9 | 1.93 | |
| 57112.85 | 1877.8 | 1.69 | |
| 57113.34 | 1228.2 | 1.84 | |
| 57114.13 | 1040.9 | 1.18 | |
| 57115.90 | 2401.5 | 1.35 | |
| 57116.11 | 10801.0 | 1.46 | |
| 57117.66 | 974.1 | 1.52 | |
| 57118.20 | 903.6 | 2.18 | |
| 57119.29 | 1261.4 | 1.45 | |
| 57120.36 | 1578.7 | 1.26 | |
| 57121.06 | 1049.5 | 1.17 | |
| Chandra MEG | 57116.83 | 69008 | 0.07510.0010 |
| Chandra HEG | 57116.83 | 69008 | 0.12140.0013 |
| NuSTAR FPMA | 57116.12 | 42340 | 3.6650.009 |
| NuSTAR FPMB | 57116.12 | 42340 | 3.6260.009 |
| Notes.∗ Modified Julian Date. The count rates were measured in the following energy ranges: Swift XRT — 0.3–10.0 keV, Chandra MEG — 0.4–5.0 keV, Chandra HEG — 0.8–10.0 keV, NuSTAR FPM — 3–79 keV. | |||
3 Development of the outburst
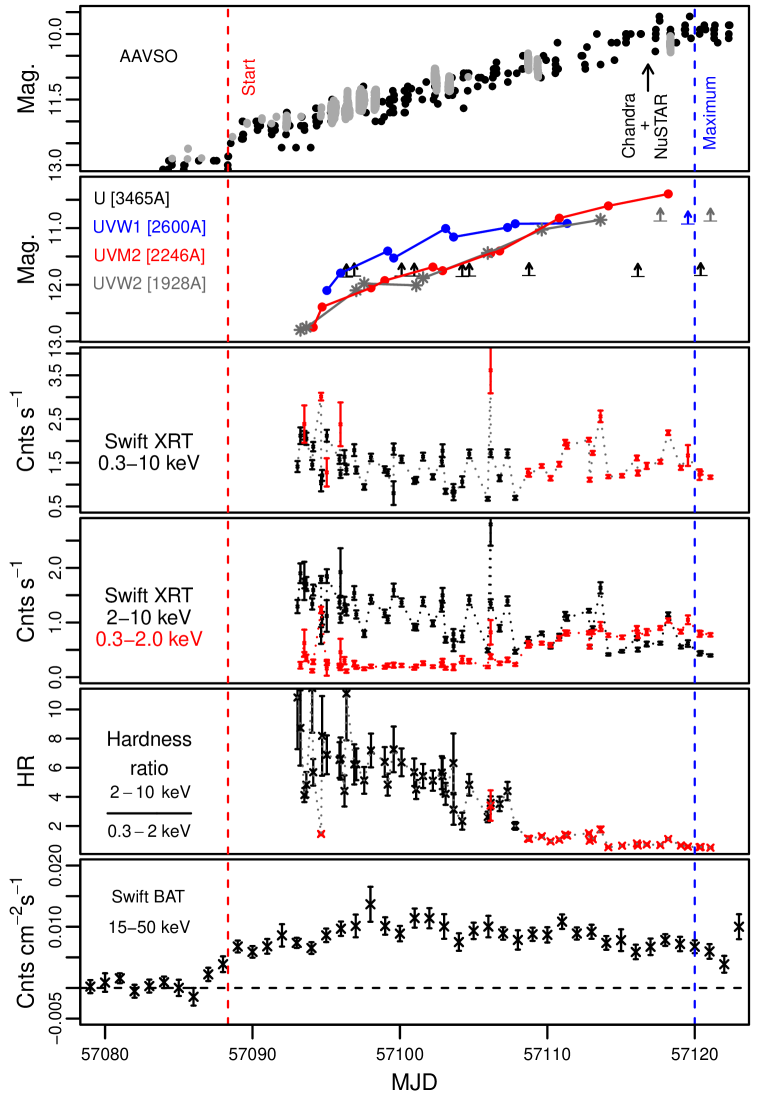
Figure 1 shows a comparison between the development of the outburst in the optical, UV and X-rays. The top panel is the optical light curve, which was obtained from The American Association of Variable Star Observers (AAVSO)222https://www.aavso.org/. The beginning of the outburst in the optical band was taken as a reference and is marked with the red dashed vertical line in all the panels. The maximum of the outburst in the optical band is also marked with the blue line. The second panel shows the Swift UVOT data in different filters. All the UVOT light curves showed a gradual rise. The images in the lower energy filter — U — and the last observations in the UVW1 and UVW2 filters were saturated and provide only lower limits for the magnitudes. We analysed also quiescence Swift UVOT observations of GK Per obtained in 2012 to find the amplitude of the outburst in the UV range. Table 2 shows the quiescent UVOT magnitudes.
| MJD | Filter | Exp. (s) | Mag. |
|---|---|---|---|
| 56115.284 | UVW1 | 361 | 15.690.02 |
| 56115.279 | UVM2 | 413 | 16.750.03 |
| 56115.274 | UVW2 | 413 | 16.670.02 |
| 56117.086 | UVW1 | 319 | 15.850.02 |
| 56117.082 | UVM2 | 316 | 16.950.04 |
| 56117.078 | UVW2 | 316 | 16.920.03 |
| 56118.014 | UVW1 | 143 | 15.670.03 |
| 56118.013 | UVM2 | 112 | 16.740.05 |
| 56118.012 | UVW2 | 112 | 16.680.04 |
The third panel is the Swift XRT light curve averaged within a snapshot in the whole energy range: from 0.3 to 10 keV. The count rate varied from 0.7 to about 3 cnts s-1 but did not show any significant increasing or decreasing trend.
We missed the initial steep rise, observed only with the Swift BAT, because GK Per was too close to the Sun, and observed only a plateau in the Swift XRT light curve. In fig. 1, the bottom panels show the soft (0.3–2.0 keV) and hard (2.0–10 keV) XRT light curves. The hard count rate is more scattered in comparison with the soft one and decreased as the outburst developed. The soft count rate, in turn, showed a prominent rise, which resulted in a gradual decrease of the hardness ratio (panel 5) with minimum around MJD 57113, 25 days after the beginning of the outburst. The light curve measured with the Swift BAT is more stable and only showed a moderate decrease after maximum around day 10 after the outburst. The flux increase started 2 days earlier in the Swift BAT energy range than in optical.

4 Timing analysis
4.1 Broad band power spectra.
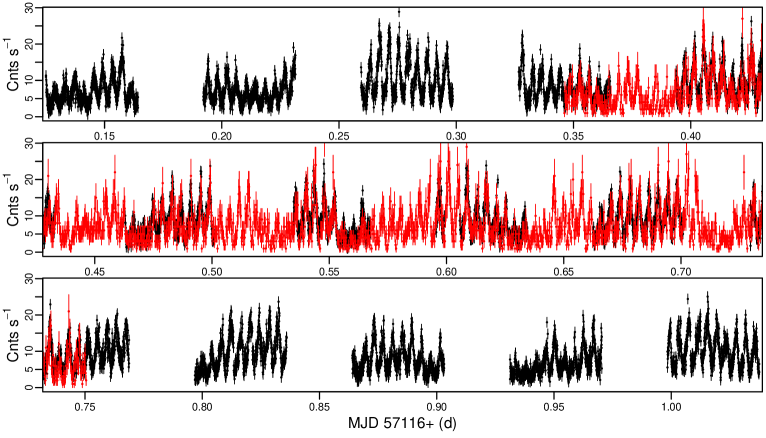
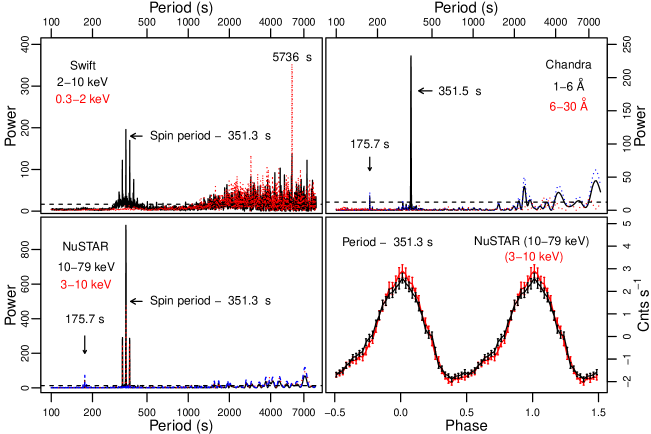
For our timing analysis we extracted the Swift XRT, NuSTAR (the FPMA and FPMB detectors were combined) and Chandra light curves and binned them every 10 s. In order to investigate a possible energy dependence of the X-ray variability we split the Swift XRT light curve in two ranges: 0.3–2.0 and 2.0–10 keV, the Chandra HETG light curve was extracted below 6 Å and above 6 Å and the NuSTAR one above and below 10 keV. Chandra hard and NuSTAR data show a strong periodic modulation, which can be seen in fig. 2. For visibility in fig. 2 the Chandra count rate was multiplied by a factor of 20. To study this modulation quantitatively, we constructed Lomb-Scargle periodograms (Scargle, 1982) of various data in soft and hard energy bands. The Lomb-Scargle periodograms (LSPs) in a broad range of periods for all the light curves are presented in fig. 3. The top-left-hand panel shows the LSPs of hard (black) and soft (red) Swift XRT light curves. The highest peak of the hard LSP corresponds to the WD spin period — 351.33 s. The spin modulation is not present in the LSP of the soft Swift XRT light curve: it shows peaks only at longer time scales with the strongest one at 5736 s. Although QPOs in GK Per on a time-scale of 5000 were reported by many authors, this period is too close to the Swift orbital period of 5754 s to be distinguished from the windowing in the observations. The top-right- and bottom-left-hand panels of fig. 3 show the LSPs of the Chandra HETG and the NuSTAR light curves, respectively. There is no peak in the Chandra soft LSP at 5736 s period, which confirms that this peak in the soft Swift periodogram does not correspond to a real modulation. On the other hand, the NuSTAR and the hard Chandra LSPs show peaks at 7000 s. These light curves are indeed variable on the time-scales of kiloseconds, as shown by fig. 2.
The blue dashed lines in the top-right- and bottom-left-hand panels show the LSPs after the subtraction of the peak corresponding to the spin period. We fitted and subtracted a sine function with a fixed period of 351.33 s from the original data, and plotted the LSPs again. The peak close to half of the spin period remained in the hard NuSTAR and Chandra LSPs.
4.2 Energy dependence of the WD spin modulation.
All the LSPs of the light curves extracted above 2 keV show a prominent peak corresponding to the WD spin period, while neither Chandra nor Swift soft LSPs show any. The absence of the spin modulation in the region of 0.3 – 2 keV may indicate that this emission component has a different origin and is visible during the whole spin cycle. We also extracted the light curves from the Chandra HETG data in the regions of the strongest emission lines of Mg, Si and Fe K 6.4 keV and checked whether the flux in these lines is modulated with the orbital or with the spin period. Only the Fe K line emission showed spin modulation, while the flux in the other emission lines had aperiodic fluctuations.
The peak corresponding to the spin period is present even in the LSP of the NuSTAR light curve above 10 keV. Typically the spin modulation of IPs is not detected, or only marginally measurable, in the hard X-rays (Norton & Watson, 1989; Mukai et al., 2015), since the cross-section of the photoelectric absorption that usually causes the modulation decreases with energy. The effect of photoelectric absorption is not significant above 10 keV, so the observed high energy modulation might originate in a different mechanism than absorption of the accretion column emission. The comparison of the phase folded NuSTAR light curves in two energy ranges (fig. 3) confirms that the spin modulation is not energy dependent: the spin profiles are almost identical.
4.3 Evolution of the spin pulse profile with the Swift XRT.
The next step was to explore the spin modulation of the light curves. We first investigated how the spin pulse profile changed as the outburst developed. Since the modulation is mostly seen in hard X-rays, we combined the Swift XRT light curves above 2 keV in groups of three exposures and folded them with the 351.3 s period using a constant number of bins. The result is shown in fig. 4: the pulse profile becomes smoother with time and stabilized by day 20 after the beginning of the outburst in optical. The pulse amplitude also depends on the mean value of the count rate. This will be further explored using the NuSTAR data.
4.4 WD spin-up rate.
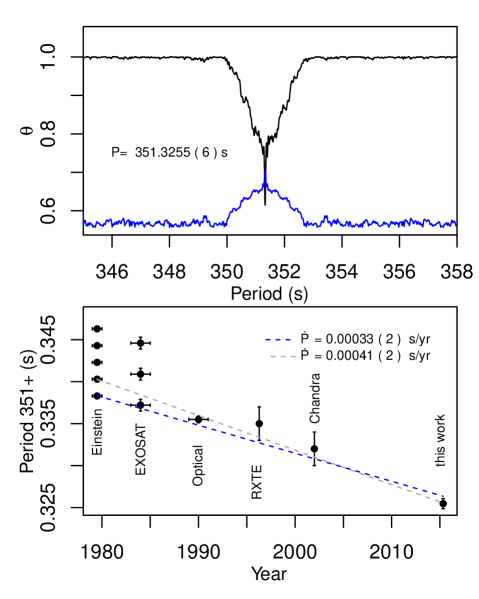
We measured the spin period more precisely combining the NuSTAR, Swift XRT light curve extracted above 2 keV and the Chandra HETG light curve in the 1–6 Å wavelength range. Since the spin amplitude in each instrument is a similar fraction of the mean count rate, and the mean count rate is much lower for Swift XRT and the Chandra HETG, we first normalized the light curve from each instrument to its mean count rate. In order to account for possible long-term variability we removed linear trends from each segment the NuSTAR light curve, from the Chandra light curve and from each Swift observation before applying the phase dispersion minimization (PDM) method (Stellingwerf, 1978). Fig. 5 shows that the PDM analysis resulted in a value of the spin period Pspin= 351.3255(6) s. Combining the WD spin measurements performed by Eracleous et al. (1991); Watson et al. (1985); Norton et al. (1988); Patterson (1991); Hellier et al. (2004); Mauche (2004) and following a discussion by Patterson (1991) and Mauche (2004), we fitted the trend of Pspin as a function of time with a linear function. The uncertainty in the spin-up rate is due to the uncertainty in the period derived from the Einstein data: two different values, 351.3383 and 351.3403 s, resulted in an acceptable fit, and adopting each of them yields a spin-up rate of 0.00033(2) s yr-1 and 0.00041(2) s yr-1, respectively.
Using the new value of the spin period (Pspin= 351.3255(6) s), we also calculated the ephemeris of the pulse maxima. The Modified Barycentric Julian Date (MBJD) of the maxima can be found as:
| (1) |
4.5 Orbital variability of the spin period.
Watson et al. (1985) pointed out that the spin period should be modulated with the orbital one (i.e. X-ray radial velocity curve), but taking into account the estimates of the binary parameters of GK Per, the authors concluded that these variations would be below the detection limit. With the most recent measurements of the mass ratio , WD mass , binary inclination angle and orbital period , we derived the expected amplitude of variation of the pulse period with orbital phase. The semi-major axis of the WD’s orbit is:
| (2) |
where is the radial velocity semi-amplitude. Assuming a circular orbit (Crampton et al., 1986) we can write:
| (3) |
Using and equation 3 we obtain the semi-major axis in light-second:
| (4) |
where is the speed of light. Thus, we finally obtain as:
| (5) |
Using the measurements of Morales-Rueda et al. (2002) and Suleimanov et al. (2016) (, M☉, d) we find that lt-sec and s. Since the binary inclination lies within the range 50–73∘ (Morales-Rueda et al., 2002), the result is s. Thus, the orbital modulation of the spin period significantly affects the measurements of the latter if the observations last for a shorter time than the orbital period. In fact, in fig. 3 we show that the spin period derived from the Chandra observation, which is the shortest one, is measured to be longer.
In order to explore a possible spin period variation with the orbital period in our data we combined the NuSTAR and the Chandra HETG 1–6 Å light curves, both covering half of the orbital period. Since the light curves show also variability on a kilosecond time-scale (see fig. 2) we fitted and subtracted 5-order polynomial functions from light curve segments lasting 14 rotation periods each. The resultant, “flat” light curve, was then divided in four parts of equal length and the spin period was measured in each part with the PDM method.
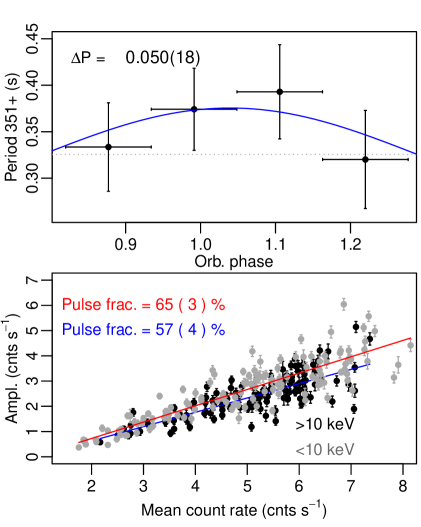
Unfortunately, we only have the ephemerides of Morales-Rueda et al. (2002), obtained almost 20 years ago, so the error on the phase determination may make it non significant. However, the orbital period itself is precisely measured, and in fig. 6 we show that is indeed variable. Fitting its orbital period dependence with a sine function, we find s. This is close to the lower limit of the expected range of . We note, however, that flickering cannot be removed, so the uncertainty in this measurement is large.
We applied the template fitting method described in Kato et al. (2009) to the NuSTAR light curves extracted above and below 10 keV in order to measure the pulse fraction. We folded the light curves with the 351.3255 s period, fitted the mean pulse profile with a spline function and then used this spline template to fit individual pulses and to measure the amplitude and the mean count rate per pulse. The pulse amplitude was calculated as (fitted pulse maximum - fitted pulse minimum)/2. The bottom panel of fig. 6 shows the result. The correlation between the mean count rate and the amplitude of pulse is very prominent and can be fitted with a linear function, providing values of the pulse fraction of 65 and 57% for the soft and hard light curves, respectively. Variation of the mean count rate reflects the long term variability on the time-scale of kiloseconds (QPOs). The spin modulation is due to the geometric effects and the linear dependence between the mean count rate and the pulse amplitude suggests that QPOs in the NuSTAR energy range are due to the intrinsic variability of the emitting source.
5 Spectral analysis
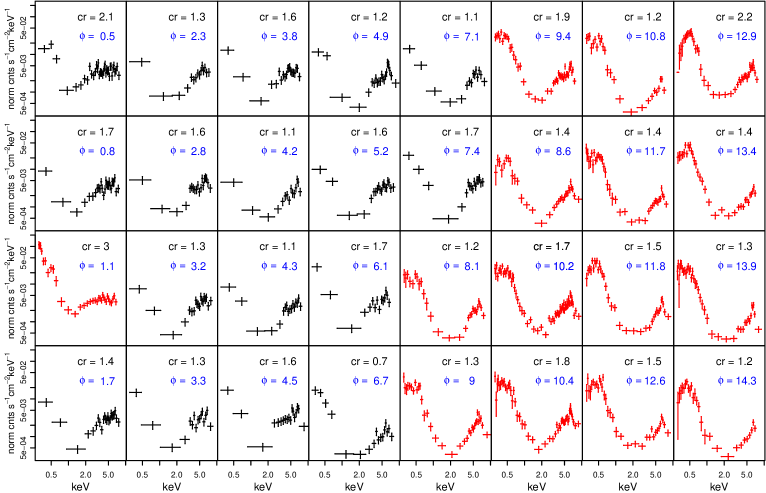
The X-ray spectrum of GK Per is very complex. The long-term observations with Swift showed that it is also quite variable, as demonstrated by the hard and soft X-ray light curves in fig. 1. Fig. 7 shows the comparison of the Swift XRT spectra obtained on different days, including only spectra with at least 14 data points after we binned the PC mode spectra with a minimum of 20 counts per bin, and the WT mode ones with at least 40 counts per bin. We divided the measurements by the response effective area, so the WT and PC mode spectra could be directly compared. Since all the exposures were longer than the spin period, rotation dependent variability is smeared out. In order to look for possible orbital phase dependence of the spectrum we marked the corresponding orbital phase (from the ephemerides in Morales-Rueda et al., 2002) in each panel. We also labelled each panel with the mean count rate. We did not find significant spectral variability dependent on the orbital phase, although all the spectra were different from day to day, sometimes with a narrow minimum around 2 keV, other times with a flatter shape around this value. Because of these variations there was no possibility to perform a simultaneous fit of the Swift XRT data and the data from the Chandra and NuSTAR observations and we will discuss these observations separately.
From the timing analysis we found that there are at least two different sources of X-ray emission in GK Per: one dominates above 2 keV and originates somewhere close to the WD, since the flux in this range is modulated with the WD spin period, and the second source, dominating below 2 keV, is visible during the whole spin cycle. We first analysed the hard portion of the X-ray spectrum using the NuSTAR and Chandra HETG observations. The Chandra HETG spectra, having higher energy resolution provide better constrain on the metallicity and the structure of the Fe K complex, while the NuSTAR data allow us to measure the shock temperature.
5.1 The hard X-ray spectral component.
Hard X-ray emission of accreting magnetic CVs originates in their accretion columns, where the post-shock plasma is cooling mostly via bremsstrahlung radiation and K and L shell line emission as it settles on to the surface of a WD. Therefore, for the hard continuum we used the cooling flow model mkcflow, which calculates a plasma in collisional ionization equilibrium (CIE) with a range of temperatures. vmcflow model is a modification of the mkcflow with variable abundances of individual elements. This model was originally created for clusters of galaxies (Mushotzky & Szymkowiak, 1988) but can also be applied to CVs (Mukai et al., 2003). The highest plasma temperature (the shock temperature) is an important parameter for magnetic CVs, allowing to estimate the WD mass (Aizu, 1973). The emissivity function in the mkcflow model is the inverse of the bolometric luminosity and the model’s normalization constant is the mass accretion rate. In order to investigate the hard X-ray emission, we attempted a simultaneous fit of the NuSTAR spectra and the Chandra HEG+MEG spectra above 2.5 keV. The NuSTAR FPMA and FPMB spectra were fitted together, but the FPMB model was multiplied by a constant to account for a slightly different response of the two detectors. We used the vmcflow model to test the abundances. The value of the interstellar absorption was obtained from the reddening (Wu et al., 1989) and the nH– relation from Bohlin et al. (1978). The shape of continuum above 2 keV indicates that the emission is highly absorbed, but even with partially covering absorber we could not fit the data. A better result was obtained with the pwab model (Done & Magdziarz, 1998), in which the fraction of X-rays affected by a given column density N(H) is a power-law function of N(H) with index . We fix the lower temperature of the vmcflow model to the lowest possible value — 0.0808 keV because a heavily absorbed spectrum like that of GK Per does not allow us to determine it accurately, and physically we expect it to be equal to the white dwarf photospheric temperature.
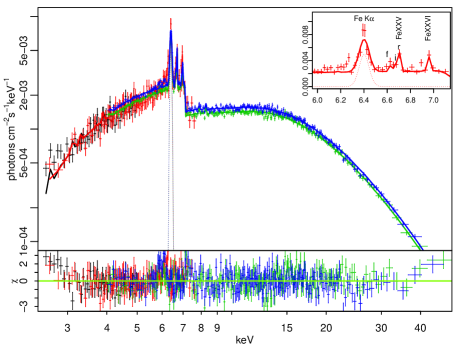
We also added a Gaussian component to fit the Fe K fluorescent line at 6.4 keV. The model’s parameters of the best fit are in table 3. The NuSTAR and the hard part of the Chandra spectrum together with the described model are presented in fig. 8. The inset shows the Fe complex measured in the Chandra HEG spectrum. The model slightly underestimates the flux in the forbidden line of the Fe xxv triplet, which may indicate contribution of the photoionization processes. There are also residuals around 6.2–6.3 keV, suggesting Compton-down-scattering of photons. A similar “shoulder” of the Fe K line was detected in previous Chandra HETG observations of GK Per (Hellier & Mukai, 2004).
We used the same procedure of the template fitting, described in the previous section, to find the pulse maxima and to extract the on-pulse and off-pulse NuSTAR spectra. Assuming that the pulse maximum is at =0.5, we chose time intervals corresponding to the 0.3 – 0.7 and 0.8 – 1.2 spin phases and used them to extract the on-pulse and off-pulse NuSTAR FPMA spectra. These spectra are shown in fig. 9 in comparison with the mean one. All three spectra are remarkably similar. We fitted the on-pulse and off-pulse spectra applying the best-fitting model described above, freezing the maximum plasma temperature, metallicity and the Fe K line width. The best-fitting parameters in table 3 show that the variation between the on-pulse and off-pulse spectra is due to the normalization of the cooling flow component.
| Component | Parameter | Value | ||
|---|---|---|---|---|
| Mean | On-pulse | Off-pulse | ||
| TBabs | nH (1022 cm-2) | 0.17 | 0.17 | 0.17 |
| nHmin (1022 cm-2) | 7.2 | 7.4 | 7.8 | |
| pwab | nHmax (1022 cm-2) | 520 | 550 | 530 |
| -0.199 | -0.26 | -0.16 | ||
| Tlow (keV) | 0.0808 | 0.0808 | 0.0808 | |
| Thigh (keV) | 16.2 | 16.2 | 16.2 | |
| vmcflow | Fe | 0.105 | 0.105 | 0.105 |
| Ni | 0.1 | 0.1 | 0.1 | |
| a | 2.6 | 3.69 | 1.88 | |
| E (keV) | 6.40 | 6.40 | 6.40 | |
| Gaussian | (keV) | 0.046 | 0.046 | 0.046 |
| norm (10-4) | 40 | 50 | 33 | |
| EW (eV) | 210 | 191 | 250 | |
| Flux | absorbedb | 7.24 | 10.15 | 5.1 |
| Flux | unabsorbedb | 24.2 | 34.1 | 17.5 |
| L (erg s-1) | 63 | 90 | 46.1 | |
| 1.3 | 1.0 | |||
| Notes: amass accretion rate 10-8M⊙ yr-1. bAbsorbed and unabsorbed fluxes ergs cm-2 s-1 in the 2.5–79 keV energy range. The unabsorbed flux was calculated with the cflux command in xspec. | ||||
| We assumed a 470 pc distance. | ||||
5.2 The Chandra observation.
We analysed the spectrum below 2 keV focusing on the Chandra HETG data to investigate the emission lines ratio and to derive conclusions about the plasma temperature and density and about the mechanism of ionisation. Useful indexes of the plasma properties are the R= and G= ratios, where , and are the fluxes in the resonance, intercombination and forbidden lines of the He-like triplets, respectively, and the ratios of H-like to He-like resonance lines of the same species (Gabriel & Jordan, 1969).
We fitted all the emission lines in the Chandra MEG spectrum with Gaussians, assuming that the Ne, Mg and Si lines are absorbed only by the interstellar absorption, and we used a power law to represent the level of continuum. We also assumed that the widths of the lines within a triplet were constant and fixed the distances between these lines to the table values. For the Gaussian fit of the Fe K complex in the Chandra MEG we also introduced the pwab model with the parameters of the fit of the mean NuSTAR spectrum and a bremsstrahlung component at kT=14 keV for the underlying continuum. We did not find any significant line shifts departing from the laboratory wavelengths. The resulting broadening and flux are presented in table 4 and in fig. 10. We also measured the R and G ratios for the Si, Mg and Ne triplets, and give them in table 5.
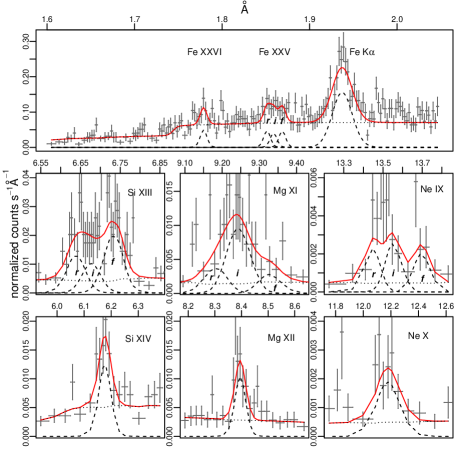
The G ratio is around 2, which means that there is no strong photoionizing component (in the case of pure photoionized plasma G is 4). We either have a collisional-ionization mechanism or a ‘hybrid plasma’, a mixture of collisional and photoionization (Porquet & Dubau, 2000). The He-like triplets of different elements show very different line ratios. The Si xiii triplet has a very strong forbidden line, which cannot be explained solely with collisional ionization, while Mg xi and Ne ix have quite weak forbidden lines, but very strong intercombination lines, which indicates a high density (Porquet & Dubau, 2000).
| Line | Erest | Emax | Fabs | Funabs | Funabs | ||
| keV | keV | km s-1 | km s-1 | ergs cm-2 s-1 | ph cm-2 s-1 | ergs cm-2 s-1 | |
| Ne X | 1.02195 | 1.017 | -1400 | 2100 | 0.6 | 5 | 0.9 |
| Ne IXr | 0.92200 | 0.5 | 6 | 0.8 | |||
| Ne IXi | 0.91488 | 800 | 0.6 | 7 | 1.0 | ||
| Ne IXf | 0.90510 | 0.5 | 6 | 0.9 | |||
| Mg XII | 1.47264 | 1.477 | 900 | 700 | 0.2 | 1.3 | 0.3 |
| Mg XIr | 1.35225 | 0.3 | 0.8 | 0.4 | |||
| Mg XIi | 1.34332 | 1100 | 0.7 | 4.9 | 0.9 | ||
| Mg XIf | 1.33121 | 0.16 | 1.1 | 0.20 | |||
| Si XIV | 2.00608 | 2.008 | 300 | 800 | 0.51 | 1.7 | 0.56 |
| Si XIIIr | 1.86500 | 1.8674 | 400 | 0.62 | 1.9 | 0.7 | |
| Si XIIIi | 1.85423 | 1.8566 | 400 | 1000 | 0.34 | 1.5 | 0.4 |
| Si XIIIf | 1.83967 | 1.8421 | 400 | 0.77 | 2.9 | 0.8 | |
| Fe XXVI | 6.97316 | 8 | 50 | 50 | |||
| Fe XXVr | 6.70040 | 6 | 40 | 40 | |||
| Fe XXVi | 6.67000 | 5 | 40 | 40 | |||
| Fe XXVf | 6.63659 | 6 | 40 | 40 | |||
| Fe Kα | 6.40384 | 6.400 | -200 | 1600 | 48 | 350 | 360 |
| Notes: We assumed that the value of is the same within a triplet for the Ne, Mg and Si lines. The distances between the lines in a triplet were fixed to the table values. The values of of the Fe xxvi and Fe Fexxvr,f,i lines were frozen to the instrumental spectral resolution. The absorbed and the unabsorbed fluxes in ergs cm-2 s-1 were calculated using the cflux command. The unabsorbed flux in ph cm-2 s-1 was calculated from the normalization constant of the Gaussian model. | |||||||
| Element | R | G | H-like/He-liker |
|---|---|---|---|
| Ne | 0.90.7 | 2.41.7 | 1.10.8 |
| Mg | 0.20.2 | 2.81.6 | 0.80.5 |
| Si | 2.01.1 | 1.70.6 | 0.80.3 |
| Fe | 1.00.7 | 2.01.2 | 1.30.8 |
| Notes: the values of R and G were calculated from the values of the unabsorbed flux from table 4. | |||
Mukai et al. (2003) showed that the Chandra HETG spectrum of GK Per obtained during the outburst in 2002 is consistent with the predictions of a photoionization model with a power law as the photoionizing continuum. Although the power law emission gave a good approximation, and could indeed photoionize the plasma in which the soft X-rays emission lines are produced, such a non thermal component in a CV does not seem to have a physical reason. Given also the G ratio and the absence of a clearly non-thermal component in the NuSTAR range, we do not favour this explanation for the present set of observations.
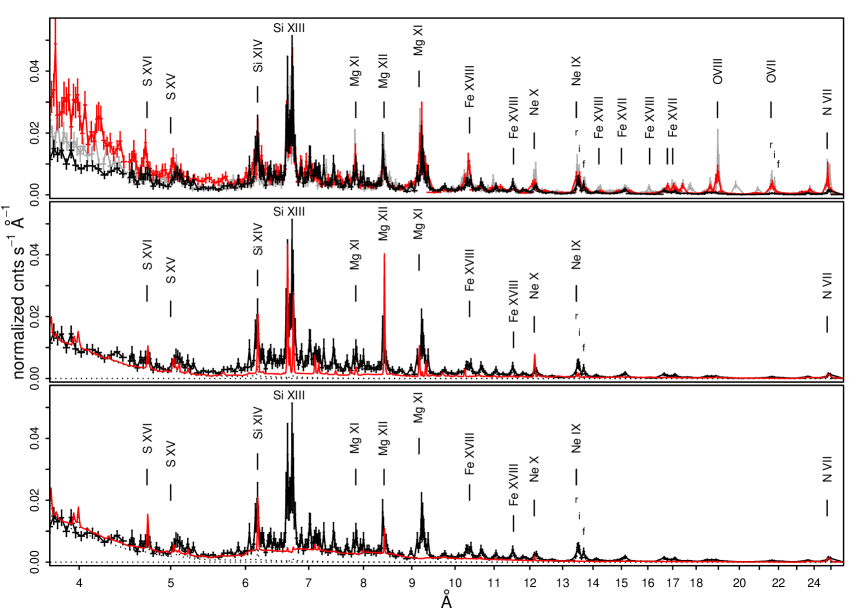
The top panel of figure 11 shows the comparison of the Chandra MEG spectrum obtained in 2015 with Chandra MEG data discussed in Mukai et al. (2003). The most recent spectrum of GK Per has much weaker lines in the region above 20 Å, which is due to contaminant build-up of the Chandra HETG+ACIS detector. The low energy effective area is reduced in 2015 compared to 2002. The intensities of the lines that are in the 6–11 Å region are almost the same. The Chandra spectra in fig. 11 give an additional proof that there are several distinct sources of emission: there is no correlation between the 6–11Å emission lines strengths and the hard continua below 5 Å.
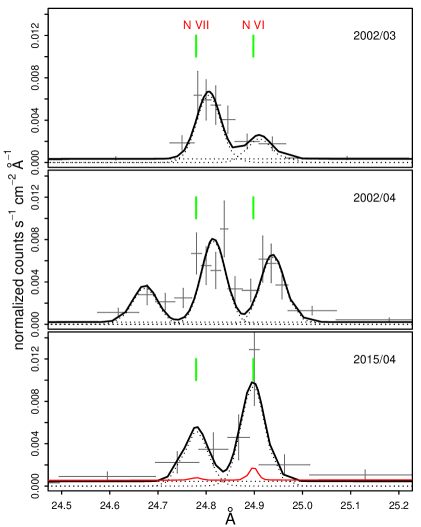
The N vii line detected in the Chandra MEG 2002 and 2015 spectra showed remarkably different profiles in comparison to the other lines. The N vii line’s regions are shown in fig. 12. In March 2002 and April 2015 two different emission lines were resolved around the rest-frame position of N vii, while in April 2002 another blue-shifted component could be distinguished. Table 6 shows the central positions and the unabsorbed fluxes of all the lines that were resolved in three Chandra MEG spectra. Vrielmann et al. (2005) in their Reflection Grating Spectrograph (RGS) spectrum of GK Per also noticed that the N vii line had a different structure that could be approximated by three Lorentzian profiles. Two scenarios could explain these emission lines. It can be one central N vii line and one/two N vii lines shifted from the main line. Another possibility is that the line around 24.8 Å is indeed the N vii emission, but the line around 24.9 Å is the N vi He line, both with zero velocity. From the Chandra MEG spectra we find that if the lines around 24.8 Å are different components of the central N vii line, this would indicate velocity shifts of 1200 – 1600 km s-1. Similar red and blue-shifted emission line’s components, although with smaller velocity shifts, were measured in the optical spectra of GK Per during outbursts (Bianchini et al., 2003) and were attributed to the emission from the matter in the magnetosphere, falling on to the WD. A question to answer is why N vii is the only line that shows such a complex profile. Two Chandra MEG spectra obtained near optical maximum of the same outburst (see tab. 6) also clearly show that the flux of the different N vii line’s components varies with time, while the flux of central line is stable within the errors. If we observe, instead, the N vii and N vi He emission lines the relative intensities of the two lines can be used as temperature indicator (under the assumption of collisional ionization equilibrium). The different relative intensities in March and April of 2002 would imply that the temperature changes. The very strong N vi He line in comparison to N vii in the 2015 spectrum indicates also a very low plasma temperature: 0.08 keV.
We checked whether the expanding nova shell can contribute to line emission in soft X-rays. Balman (2005) showed that the shell has enhancement in the elemental abundances of Ne and N and Vrielmann et al. (2005) fitted the quiescence Chandra ACIS-S spectrum of the shell with pure emission lines of N, O and Ne, although the lines could not be resolved. In order to estimate a possible contamination of the N vii line from the central source by the shell emission, we compared the predictions of the shell emission model from Takei et al. (2015) with the 2015 Chandra MEG spectrum. The model from Takei et al. (2015) with the only modification in the N abundance (we assumed N/N☉=5) and a power law to represent the continuum level is shown with the red line in the bottom panel of fig. 12. We see that the N viiN vi line’s flux from the entire shell is much smaller than that measured in the 2015 Chandra MEG spectrum. We conclude that the N lines around 24.8 Å originate not from the extended shell, but the nature of the different components is unknown.
| central | red-shifted | blue-shifted | |||||||
| Observation | E max (keV) | Flux∗ | Ph. flux∗∗ | E max | Flux | Ph. flux | E max | Flux | Ph. flux |
| 2002 March 27 | 0.4998 | 124 | 1.60.4 | 0.4977 | 52 | 0.60.3 | |||
| 2002 April 9 | 0.5000 | 113 | 1.40.4 | 0.4973 | 113 | 1.30.4 | 0.5026 | 52 | 0.60.3 |
| 2015 April 4 | 0.50036 | 96 | 1.10.7 | 0.4980 | 178 | 1.21.0 | |||
| Notes: ∗Unabsorbed fluxergs cm-2 s-1. ∗∗Unabsorbed photon flux photons cm-2 s-1. The fluxes were measured from the Gaussian fits, shown in fig. 12 using cflux and cpflux commands. All the line widths were fixed to the value of the instrumental resolution. In these fits we assumed the same value of the interstellar absorption as in the rest of the paper: 0.171022cm-2. | |||||||||
The complexity of the spectrum is demonstrated by the ratios of H to He-like lines, which in the case of pure collisional ionization is a signature of the plasma temperature. The He-like lines are stronger than the H-like for all the species. The Si xiii to Si xiv lines ratio indicates a temperature 0.9 keV, so the origin of these lines is not in the hotter plasma that explains the NuSTAR spectrum. The He to H-like lines ratios of Mg and Ne correspond to even lower plasma temperatures. These lines also cannot be explained by another mkcflow component at lower temperature since the cooling flow model always produces H-like lines stronger than the He-like lines (Luna et al., 2015). The middle and bottom panels of fig. 11 show the comparison of the Chandra MEG spectrum with the predictions of the single temperature thermal plasma emission model. We added to the best-fitting model of the NuSTAR data a vapec component (a single-temperature plasma in CIE with variable abundances of individual elements) and a Gaussian at 0.5 keV to represent the N vii line. Following Vrielmann et al. (2005) and Evans et al. (2009b) we also introduced a blackbody component to represent the thermalized X-ray emission from the WD surface at kT = 66 eV. The choice of the blackbody temperature will be explained in the next section. In the middle panel of fig. 11 the temperature of the vapec component was fixed to 0.9 keV, in order to fit the Si xiii to Si xiv lines ratio. In this case the model underestimates the level of continuum and overestimates the He to H-like lines ratios of Mg and Ne. In the bottom panel the temperature of the vapec component corresponds to the best-fitting value — 4.9 keV, which correctly estimates the level of continuum, but cannot reproduce the line ratios. A lower temperature vapec component with higher normalization constant affected by a complex absorber could explain the Si lines and the continuum level, but not the He to H-like lines ratio of Mg and Ne. The emission lines ratios clearly indicate a multi-temperature plasma emission. However, we added another apec component to fit the lines at longer wavelengths, but it did not improve the fit significantly. Fig. 11 also shows that the vapec model underestimates the intercombination and forbidden lines in all the triplets. Thus, the overall spectrum below 2 keV cannot be represented with a model of plasma in CIE, not with a cooling flow, neither with single or two-temperature vapec model.
Fig. 8 in Porquet & Dubau (2000) shows that the temperature of 0.9 keV and the value of the R ratio of the Si triplet (see table 5), which is a density indicator, corresponds to the electron density n31013 cm-3. Using these estimates and the value of normalization of the vapec component (which gives the emission measure) we find that the radius of the emitting source is RWD, assuming a spherical distribution of the emitting plasma, MWD=0.86 M☉ and a WD mass-radius relation from Nauenberg (1972). It should be mentioned, however, that the G and R ratios are measured with large uncertainty (see table 5) and we cannot evaluate the contribution of photoionization processes, so this is a qualitative estimate.
| Component | Parameter | Value | |
|---|---|---|---|
| vapec | T (keV) | 0.9 | 4.9 |
| norm (10-3) | 1.1 | 2.6 | |
| bb | T (eV) | 66 | 66 |
| norm (10-4) | 13 | 12 | |
| E (keV) | 0.4988 | 0.4988 | |
| Gaussian | (keV) | 0.0019 | 0.0019 |
| norm (10-4) | 28 | 29 | |
5.3 Swift XRT observations
| Component | Parameter | Value | |
|---|---|---|---|
| first | second | ||
| two weeks | two weeks | ||
| TBabs | nHa,b | 0.17 | 0.17 |
| nHminb | 2.7 | 5.0 | |
| pwab | nHmaxb | 75 | 90 |
| a | 0 | 0 | |
| vmcflow | Thigh (keV) | 17 | 17 |
| c | 0.7 | 0.6 | |
| E (keV) | 6.4 | 6.4 | |
| Gaussian | (keV) | 0.04 | 0.04 |
| norm (10-4) | 6 | 15 | |
| vapec | T (keV) | 1.9 | 0.80 |
| norm (10-3) | 2.5 | 3.7 | |
| bb | T (eV) | 75 | 63 |
| norm (10-4) | 6.2 | 36 | |
| Flux0.3-2keVd | abs. | 4.6 | 11.9 |
| unabs. | 420 | 430 | |
| Flux2-10keVd | abs. | 165 | 117 |
| unabs. | 507 | 451 | |
| Lbb (erg s-1) | 1.33 | 8.6 | |
| Rbbg (cm) | 1.70 | 5.3 | |
| L2-10keV (erg s-1) | 13.4 | 11.9 | |
| 1.7 | |||
| Notes: aFrozen parameter. b1022 cm-2. | |||
| cMass accretion rate 10-8M⊙ yr-1. derg cm-2 s-1. | |||
| g Radius of the emitting region. We assumed a 470 pc distance. | |||
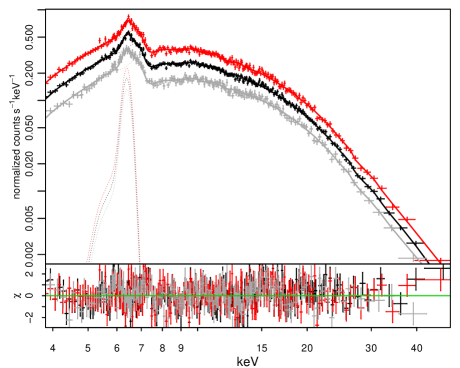
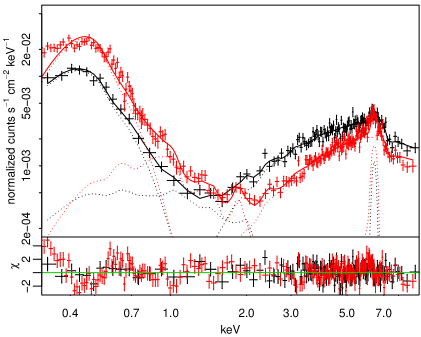
Fig. 13 shows the comparison of the average Swift XRT spectra in the first two weeks and in the following two weeks. The soft flux increased with time, while the hard flux decreased. We fitted the average spectra with the model described in section 5.2 in order to estimate the changes of the flux in different spectral regions. There was no possibility to measure the Fe K line width in the Swift spectra, so we fixed its central position and the to the values from tab. 3. We assumed that the metallicity did not change with time and the corresponding parameters in the vapec component were constrained to be the same in the two data sets. The best-fitting parameters are listed in the table 8. Here and in the following sections we refer to the spectral regions as soft (blackbody-like, below 0.8 keV), intermediate (between 0.8 and 2 keV) and hard (cooling flow component, above 2 keV). There are significant residuals in the part of the spectra below 2 keV and in particular below 0.4 keV in the spectrum obtained in the later period. There is also an excess around 0.9 keV, where the Ne ix line is.
Although the model is quite approximate, we concluded that the hard X-ray flux decreased mostly because of the increased absorption. The soft X-ray flux increased, first of all because of the increased normalization of the blackbody component and the vapec components. The blackbody emitting area increased by a factor of 3, but it remained of of the order of the area of the WD surface, which is the typical size of a heated polar region in soft IPs (see e.g. Bernardini et al., 2012).
6 Discussion
6.1 The WD spin and the long-term variations.
The NuSTAR observations of GK Per provided the first detection of a high amplitude modulation due to the WD spin period in X-rays above 10 keV in an IP (only XY Ari in outbursts is known to show a comparable amplitude of modulation). The fact that the spin modulation is so strong in hard X-rays and that the pulse amplitude is not energy dependent indicates that the modulation is a geometric effect rather than due to absorption as in the majority of IPs. This modulation can be partially explained by an obscuration of the lower accretion pole by the inner disc (Hellier et al., 1997, 2004). However, the obscuration of the lower pole alone, does not explain the pulse profile. A small shock region with a low shock height will either be completely visible or completely behind the white dwarf with very little transition in between, resulting in a square wave spin modulation. In the case of GK Per the modulation is not a square wave but quasi-sinusoidal and about 40 of the total flux is always visible, suggesting a large shock height or an extended shock region. In the first case the soft X-rays, originating closer to the WD surface, will show more prominent modulation, while the hardest X-rays — just moderate eclipses. In GK Per the pulse profiles are not energy dependent, and the pulse fraction is almost the same above and below 10 keV, so we can reject this possibility. In GK Per we most probably deal with an accretion curtain whose footprint is much extended and forms an arc that covers 180 deg. The fraction of the arc that is visible can vary smoothly, resulting in only moderate energy dependence of pulses. It is consistent with the idea proposed by Hellier et al. (2004) and Vrielmann et al. (2005) that in outburst accretion flows to the poles from all azimuths.
Variability on the time-scale of 7000 s was also detected even above 10 keV and this cannot be explained by the model of Hellier et al. (2004), in which the QPOs are due to absorption by bulges of material in the accretion disk. These variations are most probably intrinsic variability of the accretion column emission due to inhomogeneous accretion. This is supported by the linear dependence between the mean X-ray count rate and the pulse amplitude.
We have also shown that, although the hard X-ray emission shows a very prominent and high-amplitude spin modulation, precise measurements of the spin period are not so straightforward due to the presence of flickering and the orbital-related variability. The NuSTAR and Chandra data alone did not allow us to measure the spin period precisely, and only the long monitoring with Swift helped to estimate the spin-up rate.
6.2 Hard X-ray component.
The spectrum above 2 keV can be well fitted with the cooling flow model with maximum temperature of 16.2 keV, representing the emission from the WD accretion column. The continuum indicates that the source is highly absorbed, and this is also supported by the fact that the contribution of the cooling flow component to the observed line emission below 2 keV should be negligible. The source of this absorption most probably is the pre-shock material. Since, depending on the spin phase there will be different amount of absorption in our line of sight, the overall picture is very complex, and is best approximated by the pwab model.
The shock temperature derived from the fit is lower than that observed in quiescence and at the beginning of the outburst, which is about 26–27 keV (Ishida et al., 1992; Brunschweiger et al., 2009; Yuasa et al., 2016). When the inner radius of the accretion disc shrinks, the shock temperature is reduced by a factor of:
| (6) |
(Suleimanov et al., 2005), because the approximation of the free fall velocity cannot be used anymore (here and are the outburst and quiescent radii of the magnetosphere in the units of the WD radius). The magnetospheric radius is defined by a balance between the ram pressure in the disk, which depends on mass transfer, and the magnetic pressure. As long as the optical flux is increasing, we expect the mass transfer to be constantly increasing as well, since the optical probes the portion of the disc involved in the outburst. This should result in gradual shrinking of the inner disc radius and lowering of the shock temperature. The observations in the very first days of the outburst (Yuasa et al., 2016) demonstrate that the decrease of the temperature indeed does not happen immediately. However, the spectral resolution of the short Swift exposures and the uncertainty in the intrinsic absorption did not allow us to trace this process. Even in the fit to the averaged Swift XRT spectra the errors of the plasma temperature are too high to measure the difference.
6.3 Intermediate energy X-ray spectrum
These are the key points of the analysis of the intermediate X-ray spectral component (0.8–2.0 keV):
-
•
There are very prominent emission lines of Si, Mg, Ne and Fe xvii–Fe xviii.
-
•
The emission lines did not show any systematic velocity shift or broadening.
-
•
The emission line ratios do not allow to clearly distinguish between collisional and photoionization mechanisms.
-
•
Assuming collisional ioinzation equilibrium, the continuum below 2 keV is produced in a medium with a higher temperature than the emission line ratios indicate.
-
•
The spectrum in the 0.8–2 keV range cannot be represented with a model of plasma in CIE, not with a cooling flow, neither with single or two-temperature vapec model.
-
•
Neither the continuum nor the emission lines show any spin modulation in this energy range.
Vrielmann et al. (2005) claimed that the emission lines in the X-ray spectrum of GK Per originate in the magnetosphere of the WD, because they show no rotation-related modulations. We found that not only the lines, but also the underlying continuum is not modulated, indicating that the source of emission is not confined to the WD polar regions. This conclusion is also supported by the estimates of the size of the emitting region, which is of the same order of magnitude as the estimated magnetospheric radius of GK Per by Suleimanov et al. (2016) (1.4 RWD and 2.8 RWD). We propose that the magnetospheric boundary is the emission site of the intermediate spectral component and the intermediate energy X-ray flux is related to the decrease of the shock temperature. If the shock temperature during outbursts is 2/3 of that in quiescence (Brunschweiger et al., 2009; Suleimanov et al., 2016), half of the remaining energy is radiated away in the Keplerian disk. Where is the remaining 1/6th irradiated and how do we explain the energy budget? The site of emission may thus be the magnetospheric boundary, producing this intermediate X-ray spectral component, in the 0.8–2 keV range, even if the exact mechanism of emission is not clear yet. This idea partially explains the anticorrelation of the soft and hard X-rays during the outburst: the lower the shock temperature, the more energy is released in the magnetospheric boundary as moderately soft X-ray emission. Additionally, Suleimanov et al. (2016) measured the magnetospheric radius using the observed break frequency in the power spectrum and found , corresponding to the Keplerian velocity of km s-1, much faster than at the co-rotation radius, suggesting that the material in the disc must lose energy in order to decelerate and follow the field lines.
6.4 The soft component.
The spectral fits and the comparison of the Chandra data obtained at different epochs (see fig. 11) indicate at least two distinct sources of emission below 2 keV. However, since there is no proper model for the intermediate energy X-ray spectrum of GK Per, it is quite difficult to disentangle the spectral components. The softest part of the spectrum can indeed be blackbody-like and originate on the surface of the WD, heated by the accretion column. Such blackbody-like component in an X-ray spectrum is a distinct property of “soft intermediate polars” (see e.g Evans & Hellier, 2007; Anzolin et al., 2008). The size of the blackbody emitting region was 0.0026 and 0.0083 RWD (using the mass-radius relation from Nauenberg 1972 and M=0.86 M⊙), in the first and the second halves of the monitoring and the temperature was 60 – 70 eV, which is within the range of typical values for soft IPs. The increase of the luminosity of the blackbody-like component indicates that more material is penetrating deeper in the WD photosphere, producing thermalized X-rays emission, which may be an effect of the increased mass accretion rate. The latter reaches maximum around the maximum of the optical light. This is supported by the findings of Šimon (2015), who analysed a sequence of outbursts in GK Per and noticed a discrepancy between the mass transfer through the disc and X-ray emission from the accretion column, which is largest around the optical maximum; this can be explained by a buried shock.
On the other hand, there are significant residuals from the blackbody fit of the Swift XRT spectra (fig. 13). Following the discussion from Evans et al. (2009b) we attempted to estimate the upper limit to the temperature of the accretion disc in order to check whether it can contribute to the soft X-ray range. The upper limit to the temperature can be found as:
| (7) |
(Frank et al., 2002). Using the WD mass-radius relation from Nauenberg (1972), the values of from table 3, M=0.86 M⊙ and inner disc radius RRWD (Suleimanov et al., 2016) we find that the disc temperature can be as high as 90 000 K. This peak temperature corresponds to a blackbody peak wavelength of 320 Å. The inner disc region significantly contributes to the FUV and UV ranges, however, this temperature is still low to be detected with the Swift XRT (should be at least 150 000 K) and the disc emission cannot explain the very soft-X-ray excess, seen in fig. 13.
Strong emission lines were measured in the Chandra HETG spectra obtained in 2002 in a range as soft as 0.5 keV, where the blackbody component dominates, indicating a significant contribution from the low-temperature thin plasma emission. The N vii line at 0.5 keV additionally shows a completely different profile with two to three components, separated by 1200–1600 km s-1.
7 Conclusions
We have presented the long-term monitoring of GK Per in a broad energy range, from UV to hard X-rays, during the dwarf nova outburst in March-April 2015. The NuSTAR observations allowed to detect a large-amplitude WD spin modulation in the very hard X-rays, which is unusual for an IP.
The spectral and timing analysis of our data has revealed three distinct spectral components, evolving during the outburst. The spectrum above 2 keV can be well explained by a cooling post-shock plasma in the accretion column, highly absorbed by a pre-shock material. The spectrum below 0.8 keV probably represents the thermalized X-ray emission from the heated WD surface. The emission line spectrum between 0.8 and 2 keV is the most mysterious, since it cannot be represented by any existing model of plasma in collisional ionization equilibrium. We propose that it originates in the magnetospheric boundary around the WD.
Therefore, as the outburst develops and the mass transfer through the disc grows, there are three simultaneous processes affecting the X-ray spectrum:
-
•
The ram pressure increases at the magnetospheric boundary, pushing the accretion disc towards the WD surface and causing the decrease of the shock temperature.
-
•
The lower the shock temperature with respect to the quiescence level, the more energy is released in the magnetospheric boundary in the 0.8 – 2.0 keV range.
-
•
Increased specific mass accretion rate in the accretion column results in a higher amount of material that penetrates deeper in the WD photosphere, causing the increase of the blackbody-like radiation.
The complexity of the X-ray spectrum, the behaviour in different energy ranges and the discrepancy between the spectra we obtained and some predictions of the existing models make GK Per a challenging target for future studies. We propose that the observational strategy should be to monitor GK Per at different stages of its outburst evolution, in order to disentangle the spectral components and to reveal the contribution from different sources.
Acknowledgements
We acknowledge with thanks the variable star observations from the AAVSO International Data base. This work made use of data supplied by the UK Swift Science Data Centre at the University of Leicester. Polina Zemko acknowledges a pre-doctoral grant of the CARIPARO foundation at the University of Padova. G. J. M. Luna is a member of the “Carrera del Investigador Científico (CIC)” of CONICET and acknowledges support from Argentina grant ANPCYT-PICT 0478/14. Marina Orio acknowledges an award of the Chandra X-ray Center-Smithsonian Observatory. Polina Zemko and Marina Orio also acknowledge support of an INAF-ASI NuSTAR travel grant awarded in 2015.
References
- Aizu (1973) Aizu K., 1973, Progress of Theoretical Physics, 50, 344
- Anupama & Kantharia (2005) Anupama G. C., Kantharia N. G., 2005, A&A, 435, 167
- Anzolin et al. (2008) Anzolin G., de Martino D., Bonnet-Bidaud J.-M., Mouchet M., Gänsicke B. T., Matt G., Mukai K., 2008, A&A, 489, 1243
- Balman (2005) Balman Ş., 2005, ApJ, 627, 933
- Bernardini et al. (2012) Bernardini F., de Martino D., Falanga M., Mukai K., Matt G., Bonnet-Bidaud J.-M., Masetti N., Mouchet M., 2012, A&A, 542, A22
- Bianchini & Sabadin (1983) Bianchini A., Sabadin F., 1983, A&A, 125, 112
- Bianchini et al. (1986) Bianchini A., Sabbadin F., Favero G. C., Dalmeri I., 1986, A&A, 160, 367
- Bianchini et al. (2003) Bianchini A., Canterna R., Desidera S., Garcia C., 2003, PASP, 115, 474
- Bohlin et al. (1978) Bohlin R. C., Savage B. D., Drake J. F., 1978, ApJ, 224, 132
- Brunschweiger et al. (2009) Brunschweiger J., Greiner J., Ajello M., Osborne J., 2009, A&A, 496, 121
- Burrows et al. (2005) Burrows D. N., et al., 2005, Space Sci. Rev., 120, 165
- Canizares et al. (2005) Canizares C. R., et al., 2005, PASP, 117, 1144
- Crampton et al. (1986) Crampton D., Fisher W. A., Cowley A. P., 1986, ApJ, 300, 788
- Done & Magdziarz (1998) Done C., Magdziarz P., 1998, MNRAS, 298, 737
- Eastman et al. (2010) Eastman J., Siverd R., Gaudi B. S., 2010, PASP, 122, 935
- Eracleous et al. (1991) Eracleous M., Patterson J., Halpern J., 1991, ApJ, 370, 330
- Evans & Hellier (2007) Evans P. A., Hellier C., 2007, ApJ, 663, 1277
- Evans et al. (1992) Evans A., Bode M. F., Duerbeck H. W., Seitter W. C., 1992, MNRAS, 258, 7P
- Evans et al. (2007) Evans P. A., et al., 2007, A&A, 469, 379
- Evans et al. (2009a) Evans P. A., et al., 2009a, MNRAS, 397, 1177
- Evans et al. (2009b) Evans P. A., Beardmore A. P., Osborne J. P., Wynn G. A., 2009b, MNRAS, 399, 1167
- Eyres et al. (1999) Eyres S. P. S., Salama A., Evans A., Bode M., Dougherty S., Waters B. F. M., Rawlings J. C., 1999, in Cox P., Kessler M., eds, ESA Special Publication Vol. 427, The Universe as Seen by ISO. p. 309
- Frank et al. (2002) Frank J., King A., Raine D. J., 2002, Accretion Power in Astrophysics: Third Edition
- Gabriel & Jordan (1969) Gabriel A. H., Jordan C., 1969, MNRAS, 145, 241
- Ghosh & Lamb (1979) Ghosh P., Lamb F. K., 1979, ApJ, 232, 259
- Hellier & Mukai (2004) Hellier C., Mukai K., 2004, MNRAS, 352, 1037
- Hellier et al. (1997) Hellier C., Mukai K., Beardmore A. P., 1997, MNRAS, 292, 397
- Hellier et al. (2004) Hellier C., Harmer S., Beardmore A. P., 2004, MNRAS, 349, 710
- Hill et al. (2005) Hill J. E., et al., 2005, in Siegmund O. H. W., ed., Proc. SPIEVol. 5898, UV, X-Ray, and Gamma-Ray Space Instrumentation for Astronomy XIV. pp 313–328, doi:10.1117/12.618026
- Ishida et al. (1992) Ishida M., Sakao T., Makishima K., Ohashi T., Watson M. G., Norton A. J., Kawada M., Koyama K., 1992, MNRAS, 254, 647
- Kato et al. (2009) Kato T., et al., 2009, PASJ, 61, S395
- Kim et al. (1992) Kim S.-W., Wheeler J. C., Mineshige S., 1992, ApJ, 384, 269
- King et al. (1979) King A. R., Ricketts M. J., Warwick R. S., 1979, MNRAS, 187, 77P
- Krimm et al. (2013) Krimm H. A., et al., 2013, ApJS, 209, 14
- Liimets et al. (2012) Liimets T., Corradi R. L. M., Santander-García M., Villaver E., Rodríguez-Gil P., Verro K., Kolka I., 2012, ApJ, 761, 34
- Luna et al. (2015) Luna G. J. M., Raymond J. C., Brickhouse N. S., Mauche C. W., Suleimanov V., 2015, A&A, 578, A15
- Mauche (2004) Mauche C. W., 2004, in Vrielmann S., Cropper M., eds, Astronomical Society of the Pacific Conference Series Vol. 315, IAU Colloq. 190: Magnetic Cataclysmic Variables. p. 120
- McLaughlin (1960) McLaughlin D. B., 1960, in Greenstein J. L., ed., Stellar Atmospheres. p. 585
- Morales-Rueda et al. (1999) Morales-Rueda L., Still M. D., Roche P., 1999, MNRAS, 306, 753
- Morales-Rueda et al. (2002) Morales-Rueda L., Still M. D., Roche P., Wood J. H., Lockley J. J., 2002, MNRAS, 329, 597
- Mukai et al. (2003) Mukai K., Kinkhabwala A., Peterson J. R., Kahn S. M., Paerels F., 2003, ApJ, 586, L77
- Mukai et al. (2015) Mukai K., Rana V., Bernardini F., de Martino D., 2015, ApJ, 807, L30
- Mushotzky & Szymkowiak (1988) Mushotzky R. F., Szymkowiak A. E., 1988, in Fabian A. C., ed., NATO Advanced Science Institutes (ASI) Series C Vol. 229, NATO Advanced Science Institutes (ASI) Series C. pp 53–62
- Nauenberg (1972) Nauenberg M., 1972, ApJ, 175, 417
- Nogami et al. (2002) Nogami D., Kato T., Baba H., 2002, PASJ, 54, 987
- Norton & Watson (1989) Norton A. J., Watson M. G., 1989, MNRAS, 237, 853
- Norton et al. (1988) Norton A. J., Watson M. G., King A. R., 1988, MNRAS, 231, 783
- Patterson (1991) Patterson J., 1991, PASP, 103, 1149
- Porquet & Dubau (2000) Porquet D., Dubau J., 2000, A&AS, 143, 495
- Sabbadin & Bianchini (1983) Sabbadin F., Bianchini A., 1983, A&AS, 54, 393
- Scargle (1982) Scargle J. D., 1982, ApJ, 263, 835
- Shara et al. (2012) Shara M. M., Zurek D., De Marco O., Mizusawa T., Williams R., Livio M., 2012, AJ, 143, 143
- Stellingwerf (1978) Stellingwerf R. F., 1978, ApJ, 224, 953
- Suleimanov et al. (2005) Suleimanov V., Revnivtsev M., Ritter H., 2005, A&A, 435, 191
- Suleimanov et al. (2016) Suleimanov V., Doroshenko V., Ducci L., Zhukov G. V., Werner K., 2016, A&A, 591, A35
- Takei et al. (2015) Takei D., Drake J. J., Yamaguchi H., Slane P., Uchiyama Y., Katsuda S., 2015, ApJ, 801, 92
- Vrielmann et al. (2005) Vrielmann S., Ness J.-U., Schmitt J. H. M. M., 2005, A&A, 439, 287
- Warner (1976) Warner B., 1976, in Eggleton P., Mitton S., Whelan J., eds, IAU Symposium Vol. 73, Structure and Evolution of Close Binary Systems. p. 85
- Warner (2004) Warner B., 2004, PASP, 116, 115
- Warner & Woudt (2002) Warner B., Woudt P. A., 2002, MNRAS, 335, 84
- Watson et al. (1985) Watson M. G., King A. R., Osborne J., 1985, MNRAS, 212, 917
- Williams (1901) Williams A. S., 1901, Astronomische Nachrichten, 155, 29
- Wu et al. (1989) Wu C.-C., Holm A. V., Panek R. J., Raymond J. C., Hartmann L. W., Swank J. H., 1989, ApJ, 339, 443
- Yuasa et al. (2016) Yuasa T., Hayashi T., Ishida M., 2016, MNRAS, 459, 779
- Šimon (2015) Šimon V., 2015, A&A, 575, A65