FRB 121102 is coincident with a star forming region in its host galaxy
Abstract
We present optical, near- and mid-infrared imaging of the host galaxy of FRB 121102 with the Gemini North telescope, the Hubble Space Telescope and the Spitzer Space Telescope. The FRB 121102 host galaxy is resolved, revealing a bright star forming region located in the outskirts of the irregular, low-metallicity dwarf galaxy. The star forming region has a half-light radius of 0.68 kpc (), encompassing the projected location of the compact ( pc), persistent radio source that is associated with FRB 121102. The half-light diameter of the dwarf galaxy is 5 to 7 kpc, and broadband spectral energy distribution fitting indicates that it has a total stellar mass of M⊙. The metallicity of the host galaxy is low, . The properties of the host galaxy of FRB 121102 are comparable to those of extreme emission line galaxies, also known to host hydrogen-poor superluminous supernovae and long-duration -ray bursts. The projected location of FRB 121102 within the star forming region supports the proposed connection of FRBs with newly born neutron stars or magnetars.
Subject headings:
galaxies: dwarf – galaxies: star formation – supernovae: general – gamma-ray burst: general1. Introduction
Over a decade ago, Lorimer et al. (2007) presented the discovery of a millisecond-duration radio transient whose large dispersion measure suggested an extragalactic origin. Since then, the discovery of a population of fast radio burst (FRB) sources (e.g. Thornton et al. 2013; Spitler et al. 2014; Masui et al. 2015) has fueled questions pertaining to both their physical origin and whether they can be used as probes of the intervening (inter-)galactic material. Many theoretical models have been proposed, including those that invoke a cataclysmic event, and those in which repeated bursts from the same source are possible. Regardless, the FRB phenomenon has generated great interest because the short durations and cosmological distances necessarily imply sites of extreme energy density.
The detection of polarization, Faraday rotation, and scintillation in some FRBs has given clues about their origin – in some cases suggesting that they originate from dense and highly magnetized environments like those of a supernova remnant (Masui et al., 2015). The discovery of repeated radio bursts from FRB 121102 immediately ruled out cataclysmic progenitor models – at least for this particular source (Spitler et al., 2016; Scholz et al., 2016). However, deep campaigns to search for repeat bursts from other known FRB positions have thus far detected no other repeaters (Petroff et al., 2015), suggesting perhaps that there is more than one class of FRB progenitor within the sample of 22 known sources (Petroff et al., 2016).
In a practical sense, the repetition of FRB 121102 greatly facilitates follow-up and precision localization. Monitoring of the FRB 121102 field using the Very Large Array in a fast-dump recording mode (Law et al., 2015) led to a sub-arcsecond localization of the radio bursts and the discovery of the optical host galaxy and a persistent radio counterpart (Chatterjee et al., 2017). Very-long-baseline interferometry (VLBI) using Arecibo and the European VLBI Network (EVN) constrained the source of the FRB 121102 bursts and the position of the persistent radio source to be within 12 mas from each other (Marcote et al., 2017). This led to the conclusion that the source of the FRB 121102 bursts has a direct physical link to the source of the persistent radio emission; e.g., the burst source could be embedded in a radio-bright nebula. Spectroscopy of the optical host galaxy identified it as a low mass, low-metallicity dwarf galaxy at redshift (Tendulkar et al., 2017), constituting the first unambiguous identification of an FRB host and its precise distance.
A tantalizing clue resulting from the identification of the host galaxy of FRB 121102 is that similar dwarf galaxies are known to host long duration -ray bursts (LGRBs; Modjaz et al. 2008) and hydrogen-poor superluminous supernovae (SLSN-I; Lunnan et al. 2014). This could suggest an evolutionary link, in which the sources of FRB events are born at the times of LGRBs and SLSN-I, with FRBs originating from young neutron stars or magnetars resulting from these explosions (Piro, 2016; Metzger et al., 2017; Beloborodov, 2017; Kashiyama & Murase, 2017).
In this paper we present multi-band optical and infrared (IR) imaging of the host galaxy of FRB 121102 with the Gemini North telescope, the Hubble Space Telescope (HST) and the Spitzer Space Telescope. In § 2 we report on the observations and analysis. The morphology, environment and properties of the host galaxy are presented in § 3. We discuss our results in § 4.
2. Observations and analysis
2.1. Hubble Space Telescope
We acquired HST imaging observations of the FRB 121102 field on 2017 February 23 using the WFC3/UVIS and WFC3/IR cameras (datasets IDE601010, IDE601020, IDE601030 and IDE601040). We chose the F763M and F845M filters to cover the redshifted H emission line and the continuum redward of H. In the near-IR we used the F110W and F160W filters, which are comparable to the (1.1 m) and (1.6 m) bands. The exposure times were 1940 s (F763M), 2560 s (F845M), 1797 s (F110W) and 1197 s (F160W). We used 4-point dither patterns appropriate for the UVIS and IR cameras to improve the sampling of the point-spread-function (PSF) and to mitigate cosmic rays and hot pixel issues.
The data were processed through STScI’s drizzlepac package (Gonzaga et al., 2012; Avila et al., 2015) to drizzle and mosaic the images. The final resolution was chosen to include 2.5 drizzled pixels in the full-width at half maximum (FWHM) of the PSF appropriate for each wavelength. The images were combined with optimal weighting proportional to inverse of the pixel variance (i.e. IVM weighting). The drizzlepac pipeline also produced pixel weight images for each filter. Each drizzled and mosaiced image was astrometrically matched to the Gaia DR1 catalog (Gaia Collaboration et al., 2016). The root-mean-square (rms) residuals of the astrometric calibration were 8–9 mas for each image, using of order 50 (80) Gaia standards for the IR (UVIS) images. We performed photometry on the reduced images using the Source Extractor package (Bertin & Arnouts, 1996), generating isophotal aperture magnitudes, corrected for blending. We used AB magnitude zero-points for each filter as defined by STScI111http://www.stsci.edu/hst/wfc3/analysis/uvis_zpts for UVIS and http://www.stsci.edu/hst/wfc3/ir_phot_zpt for IR. The Source Extractor catalogs were then merged with photometry in other filters.
2.2. Spitzer Space Telescope
We acquired Spitzer IRAC (Fazio et al., 2004) observations of FRB 121102 on 2017 January 4 with the 3.6 m and 4.5 m bands (Obs ID 62322432). The observation was split into 100 dithered exposures of 100 s for each band. The data were processed through the MOPEX software using the mosaicing and the multi-frame point source extraction pipeline. We used the detected source catalog from the HST F160W image as input to the pixel response function fitting photometry and source extraction routine. The positions of the sources were held fixed while the fluxes were fit.
2.3. Gemini
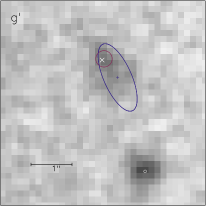
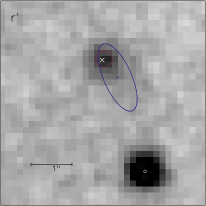
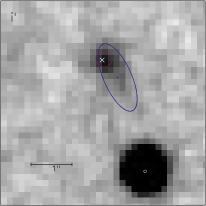
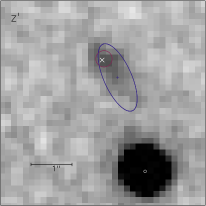
Imaging observations of the host galaxy of FRB 121102 were obtained with the Gemini Multi-Object Spectrograph (GMOS) on the 8-m Gemini North telescope atop Mauna Kea, Hawai’i (program GN-2016B-DD-2). On 2016 December 29 we obtained deep exposures in ( s) and in ( s). The conditions during these observations were photometric, with the seeing varying between and . The GMOS images were read out with binning, yielding a pixel scale of . These observations are in addition to the deep , and imaging presented in Tendulkar et al. (2017), and were bias-corrected, flatfielded, registered and co-added in an identical manner.
All co-added GMOS images were astrometrically calibrated against Gaia standards, using 40 to 50 unblended stars and yielding rms residuals of 9–10 mas. Instrumental magnitudes of objects on the co-added GMOS images were determined through isophotal aperture photometry with Source Extractor (Bertin & Arnouts, 1996). The instrumental magnitudes were calibrated directly to the AB system with photometry from Pan-STARRS 1 DR1 (Chambers et al., 2016; Magnier et al., 2016). Due to the similarity between the GMOS and Pan-STARRS filters no color terms were required, and we fitted only zero-point offsets.
3. Results
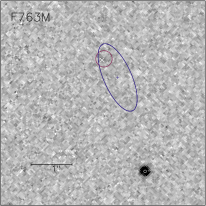
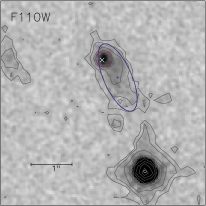
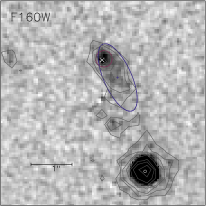
The drizzled WFC3 images obtained in the F110W and F160W bands show that the object identified by Chatterjee et al. (2017) and Tendulkar et al. (2017) as the host galaxy of FRB 121102 consists of a compact and bright knot, offset from diffuse emission (Fig. 1). We obtain isophotal aperture magnitudes of the host galaxy (both the knot and diffuse emission) of and in the AB system. In the lower resolution GMOS images these two components are blended, yielding isophotal aperture magnitudes (AB system) of , , and . In the Spitzer images, the host galaxy flux was measured to be Jy and Jy () in the 3.6 m and 4.5 m bands, respectively.
Our and -band magnitudes for the host galaxy of FRB 121102 are fainter by 0.4 and 0.9 mag compared to what we obtained in Tendulkar et al. (2017). We attribute this difference to an error in the aperture photometry reported in Tendulkar et al. (2017). As a result of the overestimated brightness of the host, the WFC3 UVIS exposure times were underestimated, unfortunately leading to low signal-to-noise ratios in the F763M and F845M images. Only the knot is detected at in the F763M image. We note though that the flux scale of the GMOS spectrum of the FRB 121102 host galaxy of Tendulkar et al. (2017) is is correct, as this was scaled to the -band magnitude of the reference star, which was not affected by the error in the aperture photometry.
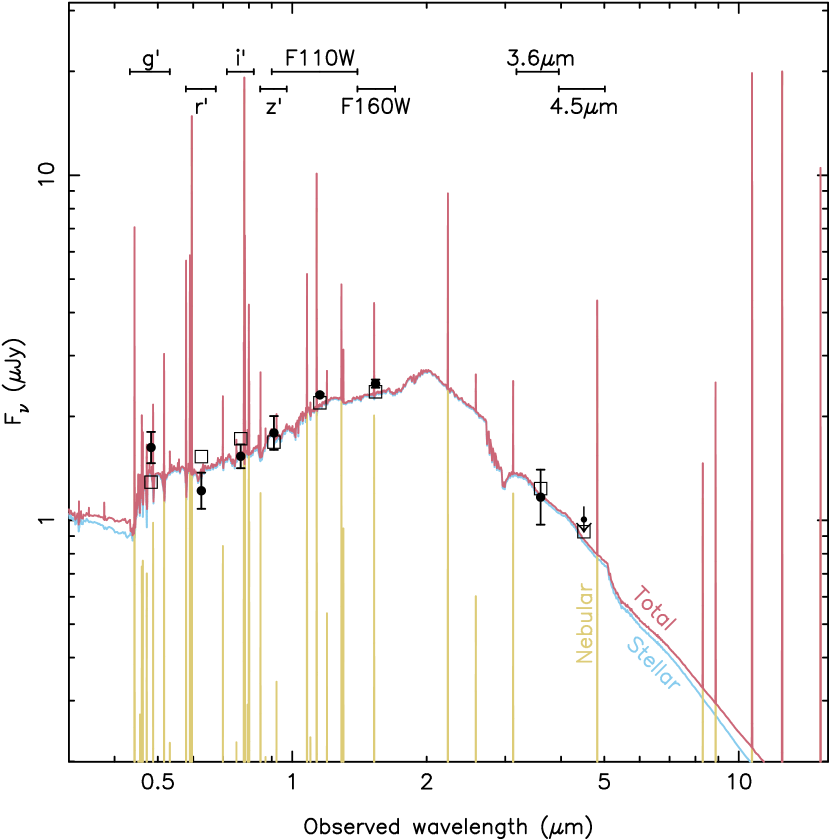
The high spatial resolution of the F110W and F160W images allows us to confirm our hypothesis we suggested in Tendulkar et al. (2017); we identify the knot as a star forming region responsible for the observed emission line spectrum, while the diffuse emission corresponds to the underlying stellar population of the FRB 121102 host galaxy. The flux from the star forming knot in the and bands is dominated by the bright emission lines of H, H, [O III] and [O III] . As a result, the position and extent of the host galaxy, as we determined in Tendulkar et al. (2017), reflects the differing contributions of the star forming knot compared to the rest of the host galaxy. The emission from the knot in the F110W and F160W bands is expected to contain emission lines of [S III] 0.907m, [S III] 0.953m, He I 1.083m, Pa, Pa and Pa (Martins et al. 2013, see also Fig. 2), explaining its brightness compared to the diffuse emission.
3.1. Morphology
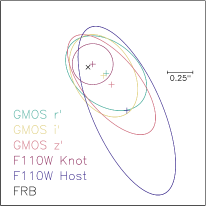
We determine the position and extent of the star forming complex (the knot) and the underlying stellar population in the drizzled F110W image by modelling and jointly fitting them as two-dimensional Gaussian or Moffat (Moffat, 1969) profiles. We find that the ellipticity of the knot is close to unity, so we fit it with a circular Moffat function instead. The knot has a radius of , significantly larger than the radius of the stellar PSF, for which a Moffat fit yields radii of . The diffuse emission appears irregular in the near-IR images (Fig. 1). For simplicity, we fit the stellar population with a Gaussian profile, which yields a semi-major axis of with , and a position angle of 66°. Transferring the position of the knot and the diffuse emission to the F160W image and keeping the positions fixed, we find comparable results for the position and size of the star forming region. The diffuse emission prefers a larger semi-major axis of and a smaller ellipticity .
We estimate the intrinsic radius of the knot as the quadratic difference of the observed radius and that of the stellar PSF. The resulting half-light radius corresponds to a half-width at half maximum (Gaussian HWHM, ) of . At a redshift of , an angle of corresponds to a projected distance of 3.31 kpc, hence the half-light radius is kpc. Under the assumption that the diffuse emission due to the underlying stellar population can be represented by a Gaussian (which, given the irregular nature of dwarf galaxies may not be valid), the knot is located (1.9 kpc) from the nominal centroid of the diffuse emission, which itself has a half-light diameter (Gaussian FWHM) between to (5 to 7 kpc). The higher spatial resolution and greater depth of the HST observations improve upon the kpc diameter we estimated in Tendulkar et al. (2017). The centroid of the knot, as measured in the drizzled F110W image, is located at , . This position is consistent with that determined from the detection of the knot in the F763M image, as well as the F160W image. The milliarcsecond-precision location of the persistent radio source at 5 GHz with the EVN (Marcote et al., 2017) is offset from the center of the star forming region by or kpc, but located within the nominal half-light radius of the star forming region. The nearby reference star is located at , .
3.2. Spectral energy distribution fitting
We use our multi-wavelength photometry to model the spectral energy distribution (SED) of the host galaxy of FRB 121102 with the CIGALE222Available at http://cigale.lam.fr/. software (Noll et al., 2009; Serra et al., 2011). We fit an underlying older stellar population with a recent burst of star formation. Figure 2 shows the resulting SED. One of the largest sources of uncertainties is the foreground Galactic extinction. We used both the Schlegel et al. (1998) and Schlafly & Finkbeiner (2011) foreground extinction values and found no appreciable differences in our best-fitting SED and derived parameters, and we report results using the Schlegel et al. (1998) Galactic extinction correction. We find that the host has negligible internal dust extinction, as expected for a metal-poor dwarf galaxy. Our best value for the recent star formation (averaged over the last 10 Myrs) is M⊙ yr-1. This value does not fully capture the current star formation as measured directly from the H luminosity (0.23 M⊙ yr-1 with no internal extinction correction), but is roughly consistent. We find a stellar mass of M⊙, which corresponds to a mass-to-light ratio of in the -band. The stellar mass is dominated by the older stellar population and so is insensitive to the exact details of the recent star formation. However, we note that the inherent uncertainties in determining the stellar mass from SED fitting are at least a factor of two (Pforr et al., 2012). The stellar mass is somewhat larger, but consistent with, the M⊙ we estimated in Tendulkar et al. (2017) from the H derived star formation rate.
3.3. Metallicity
In Tendulkar et al. (2017) we placed rough constraints on the metallicity of the host galaxy using the measured emission lines. These constraints suffered from the fact that [O II] and [O III] were outside our wavelength coverage. Here we use the HII-CHI-mistry333Available at http://www.iaa.es/~epm/HII-CHI-mistry.html software (Pérez-Montero, 2014) to obtain a more robust constraint on the metallicity of the host galaxy. This software uses grids of photoionization models to derive abundances consistent with the direct method, or method, wherein the electron temperature of the gas is constrained by measuring the ratio between the [O III] and [O III] lines. By assuming empirical laws between , , and the ionization parameter , it provides reasonable metallicities even when the temperature sensitive [O III] line is not present, as is the case for our spectrum. Using either the upper limit for [N II] or a tentative detection, we find . While there are inherent uncertainties in the metallicity of the host galaxy without the measurement of more lines, we can confirm it is a low-metallicity galaxy.
3.4. Star formation rate
From the Galactic extinction-corrected H emission line, we estimate the star formation rate (SFR) to be M⊙ yr-1, with the lower value uncorrected for internal extinction and the upper value with a correction applied (Tendulkar et al., 2017). Due to the negligible dust content of low-metallicity dwarf galaxies, we expect the internal extinction to be low, and thus we adopt the uncorrected H SFR of 0.23 M⊙ yr-1 as the best estimate. This value is also more in line with the lower SFR derived from the SED fitting of 0.12 M⊙ yr-1.
This star formation will also be observable in the radio continuum, which has the advantage of being unaffected by dust obscuration from the Galactic plane. Using the relation between SFR and 1.4 GHz radio luminosity from Murphy et al. (2011), the H-derived SFR corresponds to Jy. From Chatterjee et al. (2017), the VLA 1.4 GHz flux is Jy; however, this includes flux not only from star formation, but also from the persistent radio source which is embedded within the star forming region. The HST imaging shows the star forming region confined to a region of in radius, scales that are resolved out in the EVN observations presented in Marcote et al. (2017). These EVN observations show that the persistent radio source flux at 1.7 GHz varies between 168 and 220 Jy, with flux calibration uncertainties of the order of 20 per cent. The difference between the VLA and EVN fluxes, (i.e. the flux association with star formation), is consistent with the estimated excess of a few Jy.
The star forming knot is barely resolved in the HST images, so we have no detailed information about its internal structure. We expect the star forming complex to be composed of a number of individual, unresolved, star-forming regions. Giant molecular clouds found in the LMC (Hughes et al., 2010) and interacting Antennae galaxies (Zaragoza-Cardiel et al., 2014) reach 100 pc or more in size. A few of such GMCs in close proximity to each other would be sufficient to produce such a star-forming region.
3.5. Environment of the FRB 121102 host galaxy
We have made a crude estimate of the environment of the FRB host galaxy, using the HST F110W (-band) image. First we count the number of objects within a fixed-radius aperture of , corresponding to a radius of 50 kpc at the redshift of the host galaxy, centered on the location of the FRB. This is large enough to encompass the immediate and extended environment of the FRB host galaxy.
As galaxy clustering strength is a function of galaxy mass, with more massive galaxies being more strongly clustered than low-mass galaxies (Zehavi et al., 2002), we select other objects in the image within mag of the FRB host magnitude, but outside the FRB host aperture. At these faint magnitudes, the objects will either be dwarf galaxies like the FRB host (albeit at unknown redshifts), or very high redshift, more massive galaxies. We place the same aperture around each of these magnitude-matched galaxies and count the number of objects, to use as control regions. No attempt to remove foreground stars has been made, as it is assumed to be qualitatively the same for every aperture and will thus cancel out.
For the HST -band image, there are 30 objects within the aperture to for both the FRB and 31 control regions, but their distribution in radius is different. The FRB region is more centrally concentrated, with 18 objects within compared to a median value of in the control regions. Thus, on small ( kpc) scales, there is a marginal hint of an over-density centered on the FRB host galaxy. On larger scales, the environment is typical of other objects with the same apparent magnitude. The irregular morphology of the host galaxy is consistent with past or ongoing interactions.
4. Discussion and conclusions
We present optical, near-, and mid-IR imaging which improves on the ground based imaging presented in Tendulkar et al. (2017) and resolves the host galaxy of FRB 121102, revealing a bright knot of star formation located in the outskirts of an irregular (5 to 7 kpc half-light diameter), low-mass ( M⊙), low-metallicity () dwarf galaxy. The persistent radio source that is coincident with the FRB (Chatterjee et al., 2017; Marcote et al., 2017), is located within the 0.68 kpc half-light radius of the star forming region. Recent high spatial resolution H observations confirm the coincidence of FRB 121102 with the star forming region in its host galaxy, and yield similar estimates of the size of the star forming region and the offset of the FRB with its centroid (Kokubo et al., 2017).
The separation of the underlying stellar population of the FRB 121102 host galaxy from the star forming region allows us to update our estimate of the dispersion measure (DM) that can be attributed to the H emitting gas. Following our derivation in § 4.3 of Tendulkar et al. (2017), the smaller size of the star forming region increases the H surface density by a factor 3.3. As a result, the maximum host DM depth increases by a factor 1.8 to pc cm (with ), consistent with the estimate derived by Kokubo et al. (2017).
As we already noted in Tendulkar et al. (2017), with its low mass, low metallicity, strong emission lines and morphology of an underlying disturbed stellar population dominated by a compact star-forming region, the host galaxy of FRB 121102 shows many similarities with a class of star-forming galaxies known as extreme emission line galaxies (EELGs; Atek et al. 2011; van der Wel et al. 2011). The one possible contrasting metric is that we find the FRB host to be in a region of average or slightly high density, whereas EELGs are generally found in underdensities (Amorín et al., 2015).
The EELG galaxy classification encompasses several sub-classes of galaxies found in the literature. At the low-mass end of the EELG population are compact and ultracompact blue dwarf galaxies (CBD, UCBD; Thuan & Martin 1981; Corbin et al. 2006). HST imaging of a sample of very low redshift UCBDs reveals remarkable similarities to the FRB host galaxy, showing objects with diffuse, irregular structure, punctuated by compact regions of intense star formation spanning tens to hundreds of parsecs, offset from the galaxy center (Corbin et al. 2006). We note that the specific SFR (sSFR; SFR divided by stellar mass) and metallicity of the FRB host are comparable to those of high redshift () Lyman break galaxies (LBGs; Greis et al. 2016). This indicates that galaxies similar to the repeating FRB host were common in the early universe, so we might expect similar FRBs at higher redshifts.
Of particular interest are the hydrogen-poor superluminous supernovae (SLSN-I), which preferably occur in EELGs (Leloudas et al., 2015; Perley et al., 2016). There is some disagreement as to whether the SLSN-I hosts are also drawn from the same galaxy pool as the hosts of long-duration -ray bursts (LGRBs), with some authors finding the hosts similar (Lunnan et al., 2014) and others finding differences (Angus et al., 2016). The locations of SLSN-I are found to trace the UV light of their host galaxies (Lunnan et al., 2015), though less so than LGRBs, which strongly prefer the bright, inner regions of their hosts (Blanchard et al., 2016). The coincidence of FRB 121102 with the star formation complex, which is the brightest part of its host galaxy, further strengthens the resemblance between FRBs and SLSN-I/LGRBs. This observed coincidence is supported by models of magnetar birth (Kasen & Bildsten, 2010; Woosley, 2010), which are believed to be born in the collapse of massive stars. This could suggest an evolutionary link, in which neutron stars or magnetars are born as LGRB or SLSN-I and evolve into FRB-emitting sources (Piro, 2016; Metzger et al., 2017; Beloborodov, 2017; Kashiyama & Murase, 2017; Omand et al., 2017). Volumetric rate estimates of star-forming dwarf galaxies, along with SLSN-I, LGRB and FRB rates by Nicholl et al. (2017) and Law et al. (2017, submitted), indicate broad consistency. The coincidence of FRB 121102 with a star forming region — in a host galaxy that is similar in type to those preferentially hosting SLSN-I and LGRBs — suggests that targeted searches for radio bursts or compact persistent radio counterparts, similar to that of FRB 121102, can be a valuable new approach to complement ongoing, wide-field searches for FRBs. The discovery of even a single FRB source in such a targeted search would greatly strengthen the evolutionary connection already suggested by FRB 121102.
References
- Amorín et al. (2015) Amorín, R., Pérez-Montero, E., Contini, T., et al. 2015, A&A, 578, A105
- Angus et al. (2016) Angus, C. R., Levan, A. J., Perley, D. A., et al. 2016, MNRAS, 458, 84
- Atek et al. (2011) Atek, H., Siana, B., Scarlata, C., et al. 2011, ApJ, 743, 121
- Avila et al. (2015) Avila, R. J., Hack, W., Cara, M., et al. 2015, in Astronomical Society of the Pacific Conference Series, Vol. 495, Astronomical Data Analysis Software an Systems XXIV (ADASS XXIV), ed. A. R. Taylor & E. Rosolowsky, 281
- Beloborodov (2017) Beloborodov, A. M. 2017, ArXiv e-prints, arXiv:1702.08644
- Bertin & Arnouts (1996) Bertin, E., & Arnouts, S. 1996, A&AS, 117, 393
- Blanchard et al. (2016) Blanchard, P. K., Berger, E., & Fong, W.-f. 2016, ApJ, 817, 144
- Chambers et al. (2016) Chambers, K. C., Magnier, E. A., Metcalfe, N., et al. 2016, ArXiv e-prints, arXiv:1612.05560
- Chatterjee et al. (2017) Chatterjee, S., Law, C. J., Wharton, R. S., et al. 2017, Nature, 541, 58
- Corbin et al. (2006) Corbin, M. R., Vacca, W. D., Cid Fernandes, R., et al. 2006, ApJ, 651, 861
- Fazio et al. (2004) Fazio, G. G., Hora, J. L., Allen, L. E., et al. 2004, ApJS, 154, 10
- Gaia Collaboration et al. (2016) Gaia Collaboration, Brown, A. G. A., Vallenari, A., et al. 2016, A&A, 595, A2
- Gonzaga et al. (2012) Gonzaga, S., Hack, W., Fruchter, A., & Mack, J. 2012, The DrizzlePac Handbook
- Greis et al. (2016) Greis, S. M. L., Stanway, E. R., Davies, L. J. M., & Levan, A. J. 2016, MNRAS, 459, 2591
- Hughes et al. (2010) Hughes, A., Wong, T., Ott, J., et al. 2010, MNRAS, 406, 2065
- Kasen & Bildsten (2010) Kasen, D., & Bildsten, L. 2010, ApJ, 717, 245
- Kashiyama & Murase (2017) Kashiyama, K., & Murase, K. 2017, ApJ, 839, L3
- Kokubo et al. (2017) Kokubo, M., Mitsuda, K., Sugai, H., et al. 2017, ArXiv e-prints, arXiv:1705.04693
- Law et al. (2015) Law, C. J., Bower, G. C., Burke-Spolaor, S., et al. 2015, ApJ, 807, 16
- Leloudas et al. (2015) Leloudas, G., Schulze, S., Krühler, T., et al. 2015, MNRAS, 449, 917
- Lorimer et al. (2007) Lorimer, D. R., Bailes, M., McLaughlin, M. A., Narkevic, D. J., & Crawford, F. 2007, Science, 318, 777
- Lunnan et al. (2014) Lunnan, R., Chornock, R., Berger, E., et al. 2014, ApJ, 787, 138
- Lunnan et al. (2015) —. 2015, ApJ, 804, 90
- Magnier et al. (2016) Magnier, E. A., Schlafly, E. F., Finkbeiner, D. P., et al. 2016, ArXiv e-prints, arXiv:1612.05242
- Marcote et al. (2017) Marcote, B., Paragi, Z., Hessels, J. W. T., et al. 2017, ApJ, 834, L8
- Martins et al. (2013) Martins, L. P., Rodríguez-Ardila, A., Diniz, S., Gruenwald, R., & de Souza, R. 2013, MNRAS, 431, 1823
- Masui et al. (2015) Masui, K., Lin, H.-H., Sievers, J., et al. 2015, Nature, 528, 523
- Metzger et al. (2017) Metzger, B. D., Berger, E., & Margalit, B. 2017, ArXiv e-prints, arXiv:1701.02370
- Modjaz et al. (2008) Modjaz, M., Kewley, L., Kirshner, R. P., et al. 2008, AJ, 135, 1136
- Moffat (1969) Moffat, A. F. J. 1969, A&A, 3, 455
- Murphy et al. (2011) Murphy, E. J., Condon, J. J., Schinnerer, E., et al. 2011, ApJ, 737, 67
- Nicholl et al. (2017) Nicholl, M., Williams, P. K. G., Berger, E., et al. 2017, ArXiv e-prints, arXiv:1704.00022
- Noll et al. (2009) Noll, S., Burgarella, D., Giovannoli, E., et al. 2009, A&A, 507, 1793
- Omand et al. (2017) Omand, C. M. B., Kashiyama, K., & Murase, K. 2017, ArXiv e-prints, arXiv:1704.00456
- Pérez-Montero (2014) Pérez-Montero, E. 2014, MNRAS, 441, 2663
- Perley et al. (2016) Perley, D. A., Quimby, R. M., Yan, L., et al. 2016, ApJ, 830, 13
- Petroff et al. (2015) Petroff, E., Johnston, S., Keane, E. F., et al. 2015, MNRAS, 454, 457
- Petroff et al. (2016) Petroff, E., Barr, E. D., Jameson, A., et al. 2016, PASA, 33, e045
- Pforr et al. (2012) Pforr, J., Maraston, C., & Tonini, C. 2012, MNRAS, 422, 3285
- Piro (2016) Piro, A. L. 2016, ApJ, 824, L32
- Schlafly & Finkbeiner (2011) Schlafly, E. F., & Finkbeiner, D. P. 2011, ApJ, 737, 103
- Schlegel et al. (1998) Schlegel, D. J., Finkbeiner, D. P., & Davis, M. 1998, ApJ, 500, 525
- Scholz et al. (2016) Scholz, P., Spitler, L. G., Hessels, J. W. T., et al. 2016, ApJ, 833, 177
- Serra et al. (2011) Serra, P., Amblard, A., Temi, P., et al. 2011, ApJ, 740, 22
- Spitler et al. (2014) Spitler, L. G., Cordes, J. M., Hessels, J. W. T., et al. 2014, ApJ, 790, 101
- Spitler et al. (2016) Spitler, L. G., Scholz, P., Hessels, J. W. T., et al. 2016, Nature, 531, 202
- Tendulkar et al. (2017) Tendulkar, S. P., Bassa, C. G., Cordes, J. M., et al. 2017, ApJ, 834, L7
- Thornton et al. (2013) Thornton, D., Stappers, B., Bailes, M., et al. 2013, Science, 341, 53
- Thuan & Martin (1981) Thuan, T. X., & Martin, G. E. 1981, ApJ, 247, 823
- van der Wel et al. (2011) van der Wel, A., Straughn, A. N., Rix, H.-W., et al. 2011, ApJ, 742, 111
- Woosley (2010) Woosley, S. E. 2010, ApJ, 719, L204
- Zaragoza-Cardiel et al. (2014) Zaragoza-Cardiel, J., Font, J., Beckman, J. E., et al. 2014, MNRAS, 445, 1412
- Zehavi et al. (2002) Zehavi, I., Blanton, M. R., Frieman, J. A., et al. 2002, ApJ, 571, 172