Understanding the nature of the intriguing source X Persei: A deep look with a Suzaku observation
Abstract
We present detailed broadband timing and spectral analysis of the persistent, low luminosity and slowly spinning pulsar X Persei using a deep Suzaku observation of the source. The spectrum is unusually hard with a cyclotron resonance scattering feature (CRSF), the presence of which has been debated. By comparing the spectral models relevant for accretion powered pulsars, we have obtained the best constraint on the broadband spectral model of X Persei obtained so far. The CRSF is not confirmed in the average spectrum. We have also identified, the presence of different intensity levels in the source with distinct changes in the pulse profile and energy spectrum indicating changes in the accretion geometry. We further find evidence of a CRSF in the highest intensity levels at 40 keV, indicating a magnetic field strength of 3.4 G.
keywords:
X-rays: binaries; X-rays: individual: X Persei;stars: neutron Stars1 Introduction
X Persei (4U 0352 + 309) is a binary stellar system at a distance of kpc (Telting et al. 1998) and consists of a slowly spinning neutron star (White et al. 1977, 837 s) which is accreting matter from its Be-star companion (Lyubimkov et al. 1997). The source is peculiar in that it is a persistent source and does not show Type-I outbursts as are commonly observed in other Be-/X-ray binaries. But X-ray flares and variability in the X-ray light curve of the source have been observed (Lutovinov et al. 2012; La Palombara & Mereghetti 2007a). The orbital period of the binary system is long, , but the orbital eccentricity is only (Delgado-Martí et al. 2001). The long orbital period and the low X-ray luminosity of the source supports the assumption that the neutron star in this binary is accreting quasi-spherically by capturing matter from the stellar wind of the Be-star (Shakura et al. 2012). The X-ray spectrum of X Persei is also unlike most accreting X-ray pulsars, the latter can usually be modeled with a power-law and a cutoff in the range 10-30 keV (White et al. 1983a). Instead, X Persei has a peculiarly hard X-ray spectrum, making the source detectable at energies higher than 100 keV (Lutovinov et al. 2012). Thus, a single component spectral model is insufficient to model the source continuum spectrum, making it necessary to include a second high energy component to explain the emission at harder X-rays. Several authors have used several different models to explain the observed spectrum, of which we note the following works. The RXTE observations were modelled using a blackbody component at lower energies and a powerlaw component with an exponential cutoff at higher energies (Coburn et al. 2001). A cyclotron resonance scattering feature (CRSF) was also required to account for an absorption-like feature seen around 30 keV. The spectrum obtained from BeppoSAX observation was modelled with two powerlaw components with exponential cutoffs at low and high energies and did not require any CRSF (Di Salvo et al. 1998). The INTEGRAL observations used thermal Comptonisation and bulk motion Comptonization to account for the observed spectrum at the low and high energies respectively (Doroshenko et al. 2012). The INTEGRAL observations also did not require any CRSF to improve the spectral model. Thus the presence of CRSF noted in the RXTE observations was not detected in either the BeppoSAX or the INTEGRAL observation and hence needs to be verified. There is also no clear agreement on the unusual nature of the X-ray spectrum with respect to the continuum model.


2 Observation & Data Reduction
X Persei was observed using Suzaku in 2012 for a long duration of 153 ks. We present here the analysis of this observation. Suzaku is a broadband X-ray observatory covering an energy range of 0.2-600 keV (Mitsuda et al. 2007). The two main instruments on board are (i) the X-ray Imaging Spectrometer (XIS: covering 0.2-12 keV) (ii) the Hard X-ray Detector (HXD: PIN diodes covering the range of 10-70 keV and GSO crystal scintillators detectors covering 70-600 keV). Therefore the observation covers a wide energy band simultaneously and with high sensitivity making it possible to do detailed spectroscopic studies of the source.
The data was reduced and processed with the standard procedures and using the latest CALDB version ’20140825’. The XIS was operated in the standard data mode with the window mode that provided a timing resolution of 2 s. The nominal pointing was set to XIS. XIS data was examined for the presence of pile-up. A central region corresponding to a pile-up fraction 4 % was discarded from all further analysis.
3 Timing Analysis: Pulsation search and light curves
We applied barycentric corrections to the event files for the timing analyis, using the FTOOLS task ’aebarycen’. Orbital correction was not required as the observation duration is much less than the decoherence timescale due to the orbital motion of the system (Chakrabarty et al. 1997, decoherence timescale is 54 days, Eqn A9). Light curves were extracted with a time resolution of 2 s and 1 s respectively from the XISs (0.2–12 keV) and HXD/PIN (10– 70 keV). To search for pulsations in the data, pulse folding and maximization technique was applied. Pulsations were found in the light curve at 835.29 0.29 s, which was subsequently used to bin the light curves and also to create corresponding pulse profiles.
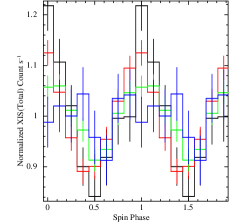
Figure 1, shows the light curves in the low (XIS: 0.2-12 keV) and high (PIN: 10-70 keV) energy bands along with the hardness ratio (HR) curve, all binned at the spin period of the source. The ’HR’ is defined as the ratio of the count rate in the XIS band (with the three XISs added together) to the PIN band. It is clear from the figure that the count rates in both the energy bands vary by a factor up to 5 during the observation. Moreover the HR shows a variation by a similar factor with the PIN count rate (see right of Figure 1) which indicates spectral variability in the source. In order to investigate the true energy dependence of the pulse profiles in this source and to construct an average model of the representative X-ray spectrum of the source, it is important to choose a time interval free from intensity or spectral variations. Therefore in order to construct the pulse profiles and the energy spectrum of X Persei, we choose a stretch of the observation where and , as not much spectral variation is expected in this narrow stretch.
3.1 Energy dependence of the pulse profiles
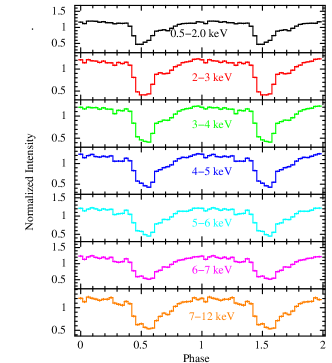
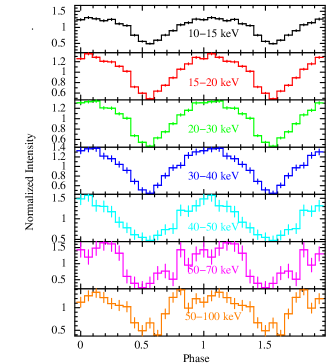
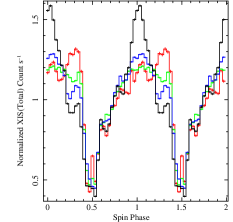
To investigate any possible energy dependence of the pulse profiles, we created the energy resolved pulse profiles by folding the data in different energy bands at the obtained pulse period. We have only used XIS and PIN light curves for the purpose between the energy ranges 0.5–12 and 10–70 keV respectively. Pulsations are detected up to 100 keV asserting the hard nature of the source as seen from the pulse profile created using the GSO light curve. Energy dependent pulse profiles are shown in figure 2. The pulse profiles are more or less sinusoidal in shape from 0.5–100 keV, with little evolution with energy. This is consistent with previous results from RXTE and BeppoSAX observations (Di Salvo et al. 1998; Coburn et al. 2001). An additional spike like feature is evident at phase 0.4 in the low energy pulse profiles ( keV) which do not show any evolution of its strength with energy in these energy bands. The high energy pulse profiles are featureless.
4 Spectral Analysis
Spectral analysis was performed using XSPEC v12.8.1 111https://heasarc.gsfc.nasa.gov/xanadu/xspec/. The XIS spectra were fitted from 0.8-10 keV and the PIN spectrum from 10-70 keV and GSO between 50-110 keV. The energy range of 1.75-2.23 keV was neglected due to artificial structures in the XIS spectra around the Si edge and Au edge. For XIS spectrum, we grouped the energy ranges between 0.8-6 keV and 6–7 keV by 8, 4 and the rest by a factor of 8 respectively. This ensured that we had enough counts in each channel to apply statistics for fitting the spectra. The energy around Fe line (6–7 keV) was binned by a smaller factor to avoid loosing information on a narrow line feature, if any. The whole energy range of PIN spectrum was binned by a factor of 4, for the reason mentioned above. For binning the GSO spectrum, we used the suggested grouping method for GSO spectrum with ‘gsobgd64bins.dat’ available in the Suzaku analysis homepage222http://heasarc.gsfc.nasa.gov/docs/suzaku/analysis/abc/.
4.1 Broad band spectroscopy and the average energy spectrum
The spectra of accretion powered pulsars are usually modelled phenomenologically using a powerlaw with quasi exponential high energy cutoff of various functional forms. The most widely used models are a power-law with a high energy exponential cutoff, a broken power-law (White et al. 1983b; Mihara 1995; Coburn 2001), or a Fermi-Dirac cutoff (Tanaka 1986, XSPEC model ’fdcut’). More recently, a smoothed high energy cutoff model (XSPEC model ’newhcut’) is also used extensively as it avoids artificial residuals in the spectra due to the abrupt nature of the exponential cutoff model. Other models are a combination of two powerlaws with different photon indices but common cutoff energy value called the Negative and Positive powerlaws with Exponential model (Mihara 1995; Makishima et al. 1999, XSPEC model ’NPEX’), and a thermal Comptonization model (XSPEC model ’CompTT model). Recently, a new model for X-ray continuum formation has been developed for accretion powered pulsars with high magnetic fields ( G) assuming a cylindrical geometry and a constant B permeating it. In this model, the source of seed photons are assumed to be from the blackbody photons arising from the base of the accretion column. This model was also successfully applied to the spectra of Supergiant Fast X-ray Transients which are relatively low luminosity sources ( ), and is available as a standard XSPEC model ’COMPMAG’ (Farinelli et al. 2012). The model allows fitting parameters related to the physics of accretion on to a high magnetic field neutron star, for example (index of the velocity profile), (terminal velocity of the accreting matter at the neutron star surface), (radiation of the accretion column in terms of Schwarzchild radius) in addition to the electron temperature and optical depth of the accreting column and temperature of the seed blackbody photon. An updated version of this model (XSPEC model ’COMPMAG2’) has also been developed by the authors which also considers the contribution of Bremmstrahlung and cyclotron emission as the source of seed photons for Comptonization (Farinelli et al. 2016). This effect is more relevant for high luminosity X-ray pulsars where the contribution of Comptonized blackbody has been found to be negligible with respect to the Comptonized Bremmstrahlung and cylotron emission. The model also has many additional parameters compared to ’COMPMAG’, for example the height of the accretion column in addition to it’s radius, and the magnetic field strength B of the neutron star surface. Additionally it provides options to choose the source of seed blackbody photons, as well as the beam pattern between pencil and fan.
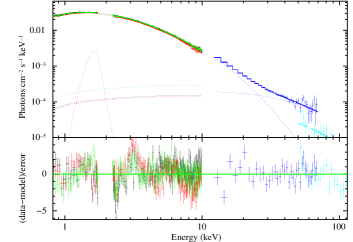
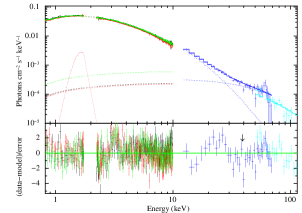
We tried to fit the broadband energy spectrum of X Persei with all the different continuum models mentioned above. The spectrum extends up to 100 keV and as in the previous works using the BeppoSAX (Di Salvo et al. 1998), RXTE (Coburn et al. 2001), and INTEGRAL (Doroshenko et al. 2012) observations, a two component model is required to fit separately the low and the high energy part of the broadband Suzaku spectrum (using XIS+PIN+GSO). Spectra obtained from XIS, PIN and GSO instruments were fitted simultaneously allowing for cross-calibration constants for the PIN and GSO instruments with respect to the XIS instrument. In all the cases we applied a Galactic line of sight absorption (XSPEC model ’tbabs’) component to the continuum models. No Fe line was detected in the spectrum. A broad emission feature at 1.65 keV was however detected only in the XIS1 (BI CCD) spectrum. As this was detected only in one of the three XISs this may be an instrumental feature and was hence not included in the analysis.
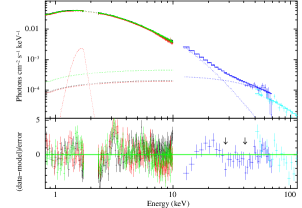
For all the phenomenological continuum models, a broad absorption feature ( 30 keV) was evident in the residuals, reminiscent of the CRSF reported from RXTE observations. Adding CRSF absorption profile (‘cyclabs’ in XSPEC) to the spectrum improved the fit. Another point we noted is that since the spectrum of X Persei is unusually hard and extended 100 keV, the GSO spectrum was crucial to constrain the cutoff in the high energy range, as it mostly appeared to be a hard tail like feature in the PIN band (10-70 keV). Overall, we found a two component power law model with smooth exponential rollover (model ’newhcut’) as the best representative phenomenological continnum model of the X-ray spectrum of X Persei, since it provided the best-fit quality with respect to the reduced (1.70 for 567 dof). The corresponding decrease in after the inclusion of the CRSF was 11. However, the observed feature was shallow and broad, with a width of 12 keV. This is broader than most of the CRSFs observed, and a broad absorption feauture as this could artificially modify the continnum spectrum considerabl. Therefore, it could arise from an artifact due to inadequate modelling of the continuum emission, and should be treated with caution. The best-fit continuum parameters obtained using the ’newhcut’ model are consistent with the results obtained using BeppoSAX observation. However, Suzaku being more sensitive than the former at the high energy range, the high energy parameters are better constrained.
Thereafter, we proceeded to fit the broadband spectrum with the analytical model ’COMPMAG’ and its updated version. The ’COMPMAG’ model has many spectral parameters which were impossible to constrain simultaneously. Especially, if left free preferred a value 0.9 in the fit, which is greater than the maximum possible terminal velocity at the neutron star surface. Therefore we tested the two component ’COMPMAG’ model, assuming reasonable parameter values applicable to low luminosity accretion powered pulsars, i.e. free-fall velocity profile (=0.5), and =0.5 which corresponds to the maximum terminal velocity at the neutron star surface, and a pencil beam emission pattern. The radius of the accretion column () was set to 0.25 corresponding to a radius of 1 km for a neutron star of mass 1.4 M⊙. The Albedo at the neutron star surface (A) was set to 1. This provided an acceptable fit to the data with acceptable and physically viable parameter values. Addition of a CRSF feature was not required for this model. The high preferred by the fit indicated that Bulk Motion Comptonization (BMC) dominates the Comptonization process in X Persei. The fit also provided a low value of electron temperature () consistent with the high value of obtained (Farinelli et al. 2012). The dominance of BMC in low luminosity pulsars, especially X -Persei has been predicted before and is consistent with our results (Becker & Wolff 2005, 2007). In Becker & Wolff (2007), the authors qualitatively described the observed spectrum of X -Persei with a pure BMC model. The obtained reduced value with ’COMPMAG’ was higher than that obtained with the ’newhcut’ model (1.84 for 569 dof), although there were no systematic pattern in the residuals, and the higher was mainly contributed by a higher variance in a few energy bins of the XIS spectra. Fit with the updated ’COMPMAG2’ model was difficult with the given statistical quality of the data, as it required fitting many more additional parameters. Moreover as discussed in Farinelli et al. (2016), the ’COMPMAG’ model provides an adequate description of the spectrum for low luminosity pulsars, where the blackbody emission provides the major source of photons for Comptonization, appropriate for the case of X Persei. Considering the above, and as ’COMPMAG’ is a more physical model to understand the continuum spectra of the source, we used this as our best-fit model for the rest of the paper. As a CRSF feature is not required for this model, we cannot claim the presence of a CRSF in the average spectrum of X Persei. Table 1 summarizes the best-fit broadband spectral parameters obtained using the ‘newhcut’ (without addition of the CRSF) and ’COMPMAG’ model. Fig 3 shows the best-fit unfolded spectrum for the best fit model, showing the model components.
| parameters | NEWHCUT | COMPMAG |
| ( atoms ) | 0.39 0.003 | 0.005 |
| (low energy) | 0.28 0.01 | – |
| E1-folding energy (keV) | – | |
| E1-cut energy (keV) | – | |
| (high energy) | – | |
| E2-cut energy (keV) | – | |
| (keV) | – | |
| 1 (keV) | – | |
| 1 | – | |
| 2 (keV) | – | |
| 2 | – | |
| Flux (XIS) a (0.3-10 keV) | ||
| Flux (PIN) a (10-70 keV) | ||
| (0.3-70 keV) | ||
| reduced /d.o.f | 1.73/569 | 1.83/569 |
a - Observed flux in units of in the mentioned energy band.
b - Bolometric unabsorbed luminosity in units of in the mentioned energy band, assuming a distance of 1 kpc.
5 Intensity levels
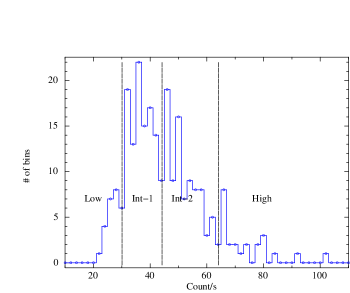
The light curves of X Persei in both the low and high energy bands show variations in the count rate up to a factor of 5. As mentioned earlier, large variation in the ’HR’ is also observed (see Figure 1). This motivated us to search for different intensity levels in the observation. This was done using the combined XIS light curve. For this, the light curve was first binned using the determined spin period of the source. Then we plotted the number of bins as a function of the count rate to get a histogram which is shown in Figure 4. From the histogram, we identified the ’High’ and ’Low’ levels from the two ends of the distribution, or the tail regions. The intermediate level was identified from the peak of the distribution. Figure 4 also hinted a double peaked feature of the distribution. Hence we subdivided the intermediate level into ’Intermediate1’ (Int-1 from now) and ’Intermediate2’ (Int-2 from now) levels.
The intensity levels chosen for this work are also shown in the figure, and the details are tabulated in Table 2.
To investigate whether these are distinct intensity levels associated with changes in the accretion geometry
we investigated the pulse profiles and the broadband spectrum of the source at the different intensities.
The results are presented in the subsequent subsections. Changes in the pulse profiles and the energy
spectrum with intensity is associated with corresponding changes in the conditions of the accretion column (Becker et al. 2012).
| Intensity Level | Count rate (c/s) | Exposure (ks) |
|---|---|---|
| Low | 11.4 | |
| Int-1 | 54.2 | |
| Int-2 | 65 | |
| High | 10.5 |
| parameters | High | Int-2 | Int-1 | Low |
| ( atoms ) | 0.20 0.008 | 0.20 0.002 | 0.17 0.005 | 0.14 0.009 |
| (keV) | ||||
| 1 (keV) | ||||
| 1 | ||||
| 2 (keV) | ||||
| 2 | ||||
| CRSF | – | – | ||
| CRSF (keV) | – | – | ||
| CRSF (keV) | – | – | ||
| CRSF (keV) | – | 0.15 0.08 | – | – |
| CRSF (keV) | – | 28.6 1.5 | – | – |
| CRSF (keV) | – | 3 (fixed) | – | – |
| Fe K (keV) | – | – | – | |
| eqw (eV) | – | – | – | |
| Flux (XIS) a (0.3-10 keV) | ||||
| Flux (PIN) a (10-70 keV) | ||||
| (0.3-70 keV) | ||||
| reduced /d.o.f (no CRSF) | – | – | 1.87/557 | 1.21/555 |
| reduced /d.o.f (1 CRSF) | 1.35/573 | – | – | – |
| reduced /d.o.f (2 CRSFs) | – | 1.95/554 | – | – |
a - Observed flux in units of
b - Bolometric unabsorbed luminosity in units of in the mentioned energy band, assuming a distance of 1 kpc.


5.1 Intensity dependence of pulse profiles
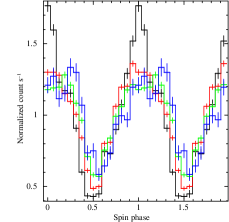
Figure 5 shows the normalised background subtracted pulse profiles of X Persei at different intensity levels extracted from XIS (0.5-10 keV), PIN (10-70 keV) and GSO (50-100 keV) light curves respectively. The pulse profiles exhibit noticeable evolution with intensity at all energy ranges. For the entire energy band, the profiles become narrower as the intensity increases. The shoulder like feature between phase range 0.1-0.3 seen at the ’low’ and ’int-1’ state gradually morphs to a sharp narrow profile. Another important feature is that the corresponding pulse fraction increases. In the XIS energy band the pulse fraction increases from 44 % to 68 % between the ’Low’ and ’High’ intensity levels, while the corresponding numbers in the PIN energy band are 47 % and 67 %. It may be mentioned that La Palombara & Mereghetti (2007a) reported an increase in pulse fraction with intensity from the RXTE-PCA data. Changes in the pulse profiles with intensity have been reported before in several accretion powered pulsars like Her X-1 (Klochkov et al. 2008), 4U 0115+63 (Tsygankov et al. 2007) and GX 304-1 (Malacaria et al. 2015). The changes can be qualitatively understood due to changes in the height and geometry of the accretion column with intensity. The results point towards a change in the accretion geometry and a gradual evolution in the beaming pattern with increasing intensity with the highest intensity showing the highest beamed pulse profile. Detailed modelling of the shape of the pulse profiles with intensity requires an accurate description of the magnetic field geometry, scattering cross sections as well as the energy and intensity dependence of the emission beam itself, and is beyond the scope of this work. .
5.2 Intensity dependence of energy spectrum
We extracted spectrum corresponding to the intensity levels mentioned in section 5. We started the fits with the best-fit model (obtained with ’COMPMAG’) of the average spectrum to fit the spectra at different intensity levels. Like the pulse profiles, the energy spectrum also exhibits dependence with intensity. We noticed the presence of a very weak Fe K emission line (equivalent width eV), in the ’Int-1’ intensity state. This might be because, at this intensity level, the continnum emission is supressed, and yet the statistical quality of the spectrum is enough to detect the line. The electron temperature (2) of the ’High’ intensity level is higher than in the other spectra, indicating a harder spectrum consistent with the highest pulse fraction of the corresponding hard X-ray pulse profile (see Fig. 5). A correlation between the hardness ratio and intensity, with indication of increasing hardness with intensity has been reported previously in the XMM-Newton band 15 keV (La Palombara & Mereghetti 2007b). The harder spectrum at ’High’ intensity may indicate an increase in Comptonization in the accretion column. The parameter 2 however only traces the thermal Comptonization component. The change in the BMC component, thought to be dominant in X Persei cannot be probed. This is because cannot be left free in the fits, due to statistical limitations. The errors bar of the parameter 2 is however high due to the low exposure time of the spectrum, and therefore the increase in 2 in not statistically significant. The other continnum parameters do not show noticeable evolution with intensity.
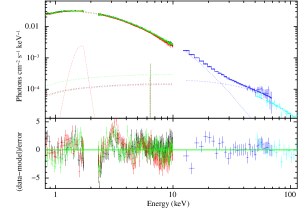
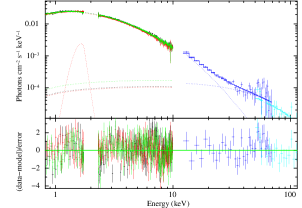
The most significant changes are dip like features present in the spectrum of the ’High’ and ’Int-2’ intensities at 40 keV, reminiscent of a CRSF. Both the residuals and the corresponding improved after addition of a CRSF feature (’cyclabs’ model in XSPEC). For the ’Int-2’ spectrum, additional residuals, reminiscent of another feature was noticed at 29 keV. Adding another CRSF improved the further. The width of this feature could not be constrained and was hence frozen at 3 keV. The total improvement in for the ’High’ and ’Int-2’ intensity levels was 20 and 18 after adding the CRSF (1 for ’High’ and 2 for ’Int-2’ ) for 2 d.of and 4 d.o.f respectively. In order to verfiy whether this was a model independent feature, we checked the spectral fits for the intensity states, using the ’newhcut’ spectral model. Residuals are seen at the same energies for the ’High’ and ’Int-2’ spectra. However, the dips are much wider and deeper. As discussed in section 4.1, this difference might arise due to insufficient continnum modeling of the continnum spectrum with the ’newchut’ spectral model. To further verify the presence of the CRSF in a model independent manner we extracted the ratio of the spectrum of the ’High’ and ’Int-2’ levels, respectively divided by the average spectrum. Figure 7 shows the ratio plots, with the dip at 40 keV clearly visible. A detailed discussion on statistical significance of the CRSF is included in the next section. Figure 6 shows the unfolded spectrum of X Persei (showing the model components) at different intensity levels with and without inclusion of the CRSF feature for the ’High’ and ’int-2’ intensities. The best-fit parameters are tabulated in table 3, including the CRSFs for intensity level ’High’ and ’Int-2’.
5.3 CRSF and its detection significance
Computing statistical significance of CRSFs needs to be handled with care, as this is a multiplicative component modifying the underlying continnum iself. In order to access whether the improvement in is significant, the standard F-test cannot be used which is suitable only for additive components (Protassov et al. 2002). Therefore we used two independent tests, to access the significance of CRSFs in the ’High’ and ’Int-2’ intensity spectra.
At first we performed a numerical evaluation of the significance of the CRSF by performing Monte-Carlo simulations. This was done with the XSPEC script lrt by simulating large number of datasets (3001) with the two component ’COMPMAG’ model without the CRSF, modified with statistical (Poisson) noise. At each iteration the simulated datasets were fitted with the continuum model with and without the CRSF and the statistics were compared. For the ’High’ spectrum, we found that in 824 out of 3001 cases, the simulated was as high as the observed one. This gave a PCI of 27%. In case of the ’Int-2’ spectrum with a similar analysis, the obtained result was 34%. Considering the high PCI values in both cases, the CRSF at 40 keV cannot be considered statistically significant. Performing the simulation with 2 CRSFs instead of one, for the ’Int-2’ spectrum gave only slightly better results and cannot be considered statistically significant.
The evaluation of the statistical significance of a CRSF, which is often a weak absorption feature against the continuum is recommended to be supported by other tests, especially one which is sensitive to the structure of the residuals, in order to distinguish a random fluctulation from a systematic structure (Orlandini et al. 2012; Sguera et al. 2011). In the spectral fits of the ’High’ and ’Int-2’ spectra, the errors dominate as is evident from the best-fit parameters in table 3. Therefore, we performed a run-test (Barlow 1989) on the residuals between 30–50 keV (range in which CRSF is detected) for the ’High’ spectrum, in order to test for the null hypothesis of the randomness of the residuals of the fit in that energy range. The number of data points (Nt) was 14, with 3 points above zero (N+), and 11 below zero (N-). This gave a probability of obtaining N 3 (Nr is the number of runs) equals 0.009 (0.9%). In the case of ’Int-2’ spectrum in the same energy range, Nt was 14, with 5 N+, and 9 N-, which resulted in probability of obtaining N 3 equals 0.003 (0.3%). The obtained values strongly indicated that the residuals are not due to random fluctulations, and have a systematic structure, indicating the need to add the CRSF component to the spectra. For the ’Int-2’ spectrum, we also performed the test between 25-41 keV, to look for the additional absorption feature at 29 keV. In this case, Nt was 11, with 3 N+, and 8 N-. This gave a probability of obtaining N 3 equals 0.01 or a 1% probability of the structure being due to random fluctulations. The low values obtained in all three cases provide statistical evidence that the residual patterns are not due to random fluctulations.
Although the detection of the CRSF in the high intensity levels of X Persei is not very statistically significant in terms of the delta and the comparison of the statistics with and without inclusion of the CRSF in the spectral model, there is strong indication that the feature is indeed present in the spectrum. This is supported from the results of the run-test and the model independent verification of the feature. Future deep observations will ascertain this further.
6 Discussion
We have performed a comprehensive analysis of X Persei using a long Suzaku observation where we have probed several timing and spectral aspects of the source in detail. The broadband sensitive instruments onboard Suzaku have allowed us to model the continuum spectra robustly and make comparison amongst several spectral models. We have found a two component model suitable for the hard X-ray spectrum extending up to 100 keV as in previous works. There is also strong evidence that BMC dominates the Comptonization process as expected for low luminosity accretion powered pulsars with a hard continuum spectrum. The most intriguing aspect of this work is that we have identified for the first time, associated with changes in the pulse profile, corresponding indications of changes in the continuum spectra with varying intensity levels, pointing to changes in the accretion geometry. We have also found evidence of a CRSF at 40 keV at the highest intensity levels, reinstating the magnetic field strength of the neutron star.
6.1 Broadband continuum modelling
Several previous works have attempted to model the energy spectrum of X Persei, the most notable being Di Salvo et al. (1998) (using BeppoSAX observation), Coburn et al. (2001) (using RXTE observation) and more recently Doroshenko et al. (2012) (using INTEGRAL observation). However these results were based on instruments which were sensitive over different energy ranges and were unable to constrain either the low energy part of the spectrum (in case of RXTE and INTEGRAL) or the high energy part (in case of BeppoSAX) well. X Persei being a low luminosity source with the energy spectrum ranging below 1 keV to above 100 keV, the instruments onboard Suzaku were ideal in this regard. We have tested all the continuum models presently avaiable to fit the broadband spectrum of accretion powered pulsars. In all the cases we required a two component model separately for the low and high energy part of the spectrum as have also been reported in previous works. We find that a powerlaw component with a smooth exponential rollover provides the best-fit both in terms of reduced and realistic values for the continuum parameters. The continuum model parameters we obtain are consistent with Di Salvo et al. (1998) who use the same model to describe the BeppoSAX spectrum. Our results are also consistent with Coburn et al. (2001) who use a blackbody component to model the low energy part and a powerlaw component with an exponential rollover for the high energy ranges of the spectrum. This is because, while the parameters of the hard powerlaw component are similar, we note that RXTE-PCA being sensitive only 3 keV cannot differentiate between a 1.7 keV blackbody component (that they obtained) from a 0.3 powerlaw having a rollover at 3.5 keV (current work). The fit with the ’newhcut’ continuum model however indicated a broad absorption feature at 30 keV in the residuals which can be identified with the CRSF previously reported in the source. Spectral fit with the analytical model ’COMPMAG’ also provides an acceptable fit, and allows constraining physical parameters related to the accretion on the pulsar. The absorption feature at 30 keV is not required by this model indicating that it might be an effect due to insufficient continuum modelling with the phenomenological models, and needs to be treated with caution.
The spectral fit with ’COMPMAG’ model fitted with simple assumptions suitable for low luminosity accreting pulsars provides a direct insight into the process of spectral formation, and the conditions of the accretion column. The best-fit average spectrum indicated a high value of indicating that BMC dominates the Comptonization process in X Persei.
The broadband unabsorbed bolometric luminosity of X Persei (0.3-70 keV) is =1.61035 erg s-1. In accretion powered pulsars with luminosity 1037 erg s-1, it is widely believed that the radiation is mainly generated from the hotspots generated by the infalling plasma which decelerates to the surface of the neutron star due to Coulomb interactions forming an accretion mound (Burnard et al. 1991). In such sources, BMC is believed to play an important role. Further, this model has been particularly preferred to fit the spectrum of steep sources like X Persei (Becker & Wolff 2007, 2005). This is in agreement with our obtained results. The hard power-law tail in the PIN energy range wih a rollover at energies much higher than expected for accreting pulsars ( 56 keV), is in further support of this.
6.2 Intensity levels
We report the presence of large flux variations in the observation and divided the duration into four different intensity levels: a) High b) Intensity 2 c) Intensity 1 and d) Low ordered by decreasing count rates where the difference between the highest and the lowest intensity levels is factor of 5. To investigate whether there are distinct timing and spectral characteristics of the source at different intensity levels, we extracted pulse profiles in the low and high energy band as well as the broadband spectrum corresponding to these intensity levels. We confirm that there are indeed associated changes in the pulse profile, the corresponding spectrum, with the source flux. For all the energy ranges we see that the pulse profiles become narrower with increasing intensity with an increase in pulse fraction from 44 % to 68 % at the highest intensity level. There is also an indication that the highest intensity level (’High’) has a harder spectrum. The highest intensity levels (’High’ and ’Int-2’) also indicate the presence of a CRSF at 40 keV. The changes in the pulse profile and the energy spectrum reflects a change in the beam function and a change in the conditions of the accretion column with intensity.
In accretion powered X-ray pulsars the ’critical luminosity’ divides two regimes of accretion into the super and sub-critical regime (Becker et al. 2012). The equation is given by
| (1) | |||||
Here , , and are, the radius, mass, and surface magnetic field strength (B in terms of G) of the neutron star. The parameter approximates the case of disk accretion, and is suitable for wind accretors, although it is difficult to determine the parameter precisely for an assumption of spherical accretion. on the other hand, characterizes the shape of the photon spectrum inside the column (where there is assumed to be a mean photon energy of ), and characterizes the mode of accretion. For X Persei it is reasonable to assume the value of for wind accretors i.e. 1. Therefore we obtain erg assuming G (obtained from the CRSF centroid energy of 40 keV), and standard values for the mass and radius of the neutron star. This is above the bolometric luminosity of erg s-1 of the source, which indicates the source is in the sub-critical regime with the emission dominating from the accretion mound. In this regime, the characteristic emission height, from where most of the radiation escapes decreases with increasing luminosity. So at higher intensity if the accretion mound is pressed closer to the neutron star surface owing to higher ram pressure of the infalling material, one might be probing the hotter base of the accretion mound with higher fraction of higher energy photons generated due to Comptonization, which gives rise to a harder and more beamed emission. Our results are also consistent with Postnov et al. (2015) which investigated the behaviour of the spectral hardness ratio as a function of X-ray luminosity in a sample of X-ray pulsars at an energy range 12 keV (using RXTE-ASM data). The authors observed an increase in hardness ratio with increasing luminosity for sources in the sub-critical regime. The increasing hardness with luminosity in X Persei are observed at energies 110 keV (The upper limit for the spectral fitting band), and indicates that the postulate is also valid in a broad energy band.
6.3 Cyclotron line
A very interesting outcome of this work is the indication of the presence of the CRSF at the high intensity levels of the source. The presence of the CRSF has been long debated in X Persei. It’s presence was first reported by Coburn et al. (2001) at keV, but was not confirmed later from the BeppoSAX and INTEGRAL observations. We report a strong evidence for the presence of the line at keV keV, for the ’High’ and ’Int-2’ intensity levels respectively. We however do not find a conclusive evidence for the presence of the line in the average spectrum. The detection of the CRSF at a higher centroid energy than in the RXTE observations might be related to the difference of intensity between the two by a factor of 3. The centroid energy of the CRSF varies with intensity. A positive correlation with luminosity has been detected in several other low luminosity sources like GX 304-1 and Her X-1 (Staubert et al. 2007; Yamamoto et al. 2011; Klochkov et al. 2012). The measured luminosity of X Persei being sub-critical, the source perfectly fits in this group. In the sub-critical accretion regime, the CRSF energy increases at higher intensities as the accretion mound is pushed more towards the surface of the neutron star with increasing ram pressure thereby sampling higher magnetic field (assuming a dipolar geometry for the magnetic field). The obtained result also points at another important aspect that the CRSF in X Persei is preferably detected at higher intensities. This was already hinted at Coburn et al. (2001) to explain why the CRSF feature was not detected in the BeppoSAX observation. In table 4 we list the 1–10 keV flux obtained from different observations of the source using different instruments. The results indicate that the CRSF is detected at higher intensities. In fact the Suzaku observation seems to have caught the source at the highest average intensity observed till now. The only other report is from the XMM-Newton observation of the source, which was reported to be at the same luminosity (La Palombara & Mereghetti 2007a). However the XMM band does not allow the detection of the CRSF.
The identification of the line centroid energy is one of the surest method to estimate the magnetic field strength of the emitting region in the neutron star. This is given by the “12-B-12” rule providing an approximate relation between the observed CRSF energy and the magnetic field strength in the scattering region:
| (2) |
where is the magnetic field in units of G and is the gravitational redshift in the scattering region for standard neutron star parameters. This implies the magnetic field strength of the neutron star is G, assuming the scattering region lies close to the neutron star surface.
An intriguing aspect of the CRSF in X Persei is that the residuals after fitting the continuum model in the ’Int-2’ level spectrum shows two dip like structures, one at 29 keV and another at 40 keV. This is an indication of the CRSF being non-Gaussian with a more complex shape. This aspect has been discussed before by (Pottschmidt et al. 2005; Nakajima et al. 2010) and Mushtukov et al. (2015) for the accreting pulsar V 0332+53 where a similar effect has been observed. A complicated non Gaussian CRSF shape has been long predicted by theory Schönherr et al. (2007) but has not been confirmed convincingly from observational evidences, except for one source V0332+53. X Persei will only be the second source in this regard. This effect is also expected to be more prominent at lower luminosities as explained by several theories. Bhattacharya & Mukherjee (2011) predicted complicated CRSF shapes in the spectra of low luminosity pulsars. This is due to the distortion of the dipolar magnetic field near the base of the accretion mound due to the effect of local instabilities. Mushtukov et al. (2015) also predicted a similar effect for sub-critical sources due to the variation of the doppler boost with changing luminosity as discussed before. The observed CRSF in the low luminosity sub-critical source X Persei is consistent with these predictions. We encourage further deep observations of this source with sensitive instruments having high energy resolution to probe this aspect deeper.
| Instrument | Flux | CRSF detected |
|---|---|---|
| – | 1–10 keV | — |
| BeppoSAX | 1.7 | NO |
| RXTE | 2.1 | YES |
| INTEGRAL | 1.9 | NO |
| Suzaku (average) | 6.6 | NO |
| Suzaku (’Int-2’ intensity | 9.0 | YES |
| Suzaku(’High’ intensity) | 11.7 | YES |
a Flux is in units of
7 Summary
We presented a detailed broadband timing and spectral study of X Persei performed using a Suzaku observation. By testing different continuum models, we have obtained the representative broadband X-ray spectrum of X Persei. The spectral fits indicate that BMC is a dominating factor for the Comtonization of the seed photons at the base of the accretion column; both indicated by the requirement of a high in the ’COMPMAG’ model and a hard powerlaw tail like feature with an exponential rollover at 56 keV obtained with the ’newhcut’ model . For the first time, we have identified different intensity levels of the source with distinct changes in the pulsation characteristics and the energy spectrum. All of these indicate a change in the accretion geometry of X Persei with varying intensity. We have also found evidence of a CRSF at 40 keV at higher intensities. This may be related to the fact that the CRSF is preferably detected at higher intensities, and may also indicate a correlation of the line centroid energy with intensity.
Acknowledgments
This work has made use of data obtained from the High Energy Astrophysics Science Archive Research Center (HEASARC), provided by the NASA Goddard Space Flight Center. CM acknowledges the hospitality from Nordita, KTH Royal Institute of Technology and Stockholm University for hosting her for a week, where most of the work for the paper was done, and very fruitful discussions with Ruben Farinelli for help with the COMPMAG and COMPMAG2 models.
References
- Barlow (1989) Barlow R., 1989, Statistics. A guide to the use of statistical methods in the physical sciences
- Becker et al. (2012) Becker P. A., Klochkov D., Schönherr G., Nishimura O., Ferrigno C., Caballero I., Kretschmar P., Wolff M. T., Wilms J., Staubert R., 2012, A&A, 544, A123
- Becker & Wolff (2005) Becker P. A., Wolff M. T., 2005, ApJ, 621, L45
- Becker & Wolff (2007) Becker P. A., Wolff M. T., 2007, ApJ, 654, 435
- Bhattacharya & Mukherjee (2011) Bhattacharya D., Mukherjee D., 2011, in Astronomical Society of India Conference Series Vol. 3 of Astronomical Society of India Conference Series, Probing neutron star evolution using cyclotron lines. p. 25
- Burnard et al. (1991) Burnard D. J., Arons J., Klein R. I., 1991, ApJ, 367, 575
- Chakrabarty et al. (1997) Chakrabarty D., Bildsten L., Grunsfeld J. M., Koh D. T., Prince T. A., Vaughan B. A., Finger M. H., Scott D. M., Wilson R. B., 1997, ApJ, 474, 414
- Coburn (2001) Coburn W., 2001, PhD thesis, UNIVERSITY OF CALIFORNIA, SAN DIEGO
- Coburn et al. (2001) Coburn W., Heindl W. A., Gruber D. E., Rothschild R. E., Staubert R., Wilms J., Kreykenbohm I., 2001, ApJ, 552, 738
- Delgado-Martí et al. (2001) Delgado-Martí H., Levine A. M., Pfahl E., Rappaport S. A., 2001, ApJ, 546, 455
- Di Salvo et al. (1998) Di Salvo T., Burderi L., Robba N. R., Guainazzi M., 1998, ApJ, 509, 897
- Doroshenko et al. (2012) Doroshenko V., Santangelo A., Kreykenbohm I., Doroshenko R., 2012, A&A, 540, L1
- Farinelli et al. (2016) Farinelli R., Ferrigno C., Bozzo E., Becker P. A., 2016, A&A, 591, A29
- Farinelli et al. (2012) Farinelli R., Romano P., Mangano V., Ceccobello C., Ducci L., Vercellone S., Esposito P., Kennea J. A., Burrows D. N., 2012, MNRAS, 424, 2854
- Klochkov et al. (2012) Klochkov D., Doroshenko V., Santangelo A., Staubert R., Ferrigno C., Kretschmar P., Caballero I., Wilms J., Kreykenbohm I., Pottschmidt K., Rothschild R. E., Wilson-Hodge C. A., Pühlhofer G., 2012, A&A, 542, L28
- Klochkov et al. (2008) Klochkov D., Staubert R., Postnov K., Shakura N., Santangelo A., Tsygankov S., Lutovinov A., Kreykenbohm I., Wilms J., 2008, A&A, 482, 907
- La Palombara & Mereghetti (2007a) La Palombara N., Mereghetti S., 2007a, A&A, 474, 137
- La Palombara & Mereghetti (2007b) La Palombara N., Mereghetti S., 2007b, A&A, 474, 137
- Lutovinov et al. (2012) Lutovinov A., Tsygankov S., Chernyakova M., 2012, MNRAS, 423, 1978
- Lyubimkov et al. (1997) Lyubimkov L. S., Rostopchin S. I., Roche P., Tarasov A. E., 1997, MNRAS, 286, 549
- Makishima et al. (1999) Makishima K., Mihara T., Nagase F., Tanaka Y., 1999, ApJ, 525, 978
- Malacaria et al. (2015) Malacaria C., Klochkov D., Santangelo A., Staubert R., 2015, A&A, 581, A121
- Mihara (1995) Mihara T., 1995, PhD thesis, , Dept. of Physics, Univ. of Tokyo (M95), (1995)
- Mitsuda et al. (2007) Mitsuda K., Bautz M., Inoue H., et. al. 2007, PASJ, 59, 1
- Mushtukov et al. (2015) Mushtukov A. A., Tsygankov S. S., Serber A. V., Suleimanov V. F., Poutanen J., 2015, MNRAS, 454, 2714
- Nakajima et al. (2010) Nakajima M., Mihara T., Makishima K., 2010, ApJ, 710, 1755
- Orlandini et al. (2012) Orlandini M., Frontera F., Masetti N., Sguera V., Sidoli L., 2012, ApJ, 748, 86
- Postnov et al. (2015) Postnov K. A., Gornostaev M. I., Klochkov D., Laplace E., Lukin V. V., Shakura N. I., 2015, MNRAS, 452, 1601
- Pottschmidt et al. (2005) Pottschmidt K., Kreykenbohm I., Wilms J., Coburn W., Rothschild R. E., Kretschmar P., McBride V., Suchy S., Staubert R., 2005, ApJ, 634, L97
- Protassov et al. (2002) Protassov R., van Dyk D. A., Connors A., Kashyap V. L., Siemiginowska A., 2002, ApJ, 571, 545
- Schönherr et al. (2007) Schönherr G., Wilms J., Kretschmar P., Kreykenbohm I., Santangelo A., Rothschild R. E., Coburn W., Staubert R., 2007, A&A, 472, 353
- Sguera et al. (2011) Sguera V., Sidoli L., Bazzano A., Bassani L., Orlandini M., 2011, ArXiv e-prints
- Shakura et al. (2012) Shakura N., Postnov K., Kochetkova A., Hjalmarsdotter L., 2012, MNRAS, 420, 216
- Staubert et al. (2007) Staubert R., Shakura N. I., Postnov K., Wilms J., Rothschild R. E., Coburn W., Rodina L., Klochkov D., 2007, A&A, 465, L25
- Tanaka (1986) Tanaka Y., 1986, in Mihalas D., Winkler K.-H. A., eds, IAU Colloq. 89: Radiation Hydrodynamics in Stars and Compact Objects Vol. 255 of Lecture Notes in Physics, Berlin Springer Verlag, Observations of Compact X-Ray Sources. p. 198
- Telting et al. (1998) Telting J. H., Waters L. B. F. M., Roche P., Boogert A. C. A., Clark J. S., de Martino D., Persi P., 1998, MNRAS, 296, 785
- Tsygankov et al. (2007) Tsygankov S. S., Lutovinov A. A., Churazov E. M., Sunyaev R. A., 2007, Astronomy Letters, 33, 368
- White et al. (1977) White N. E., Mason K. O., Sanford P. W., 1977, Nature, 267, 229
- White et al. (1983a) White N. E., Swank J. H., Holt S. S., 1983a, ApJ, 270, 711
- White et al. (1983b) White N. E., Swank J. H., Holt S. S., 1983b, ApJ, 270, 711
- Yamamoto et al. (2011) Yamamoto T., Sugizaki M., Mihara T., Nakajima M., Yamaoka K., Matsuoka M., Morii M., Makishima K., 2011, PASJ, 63, S751